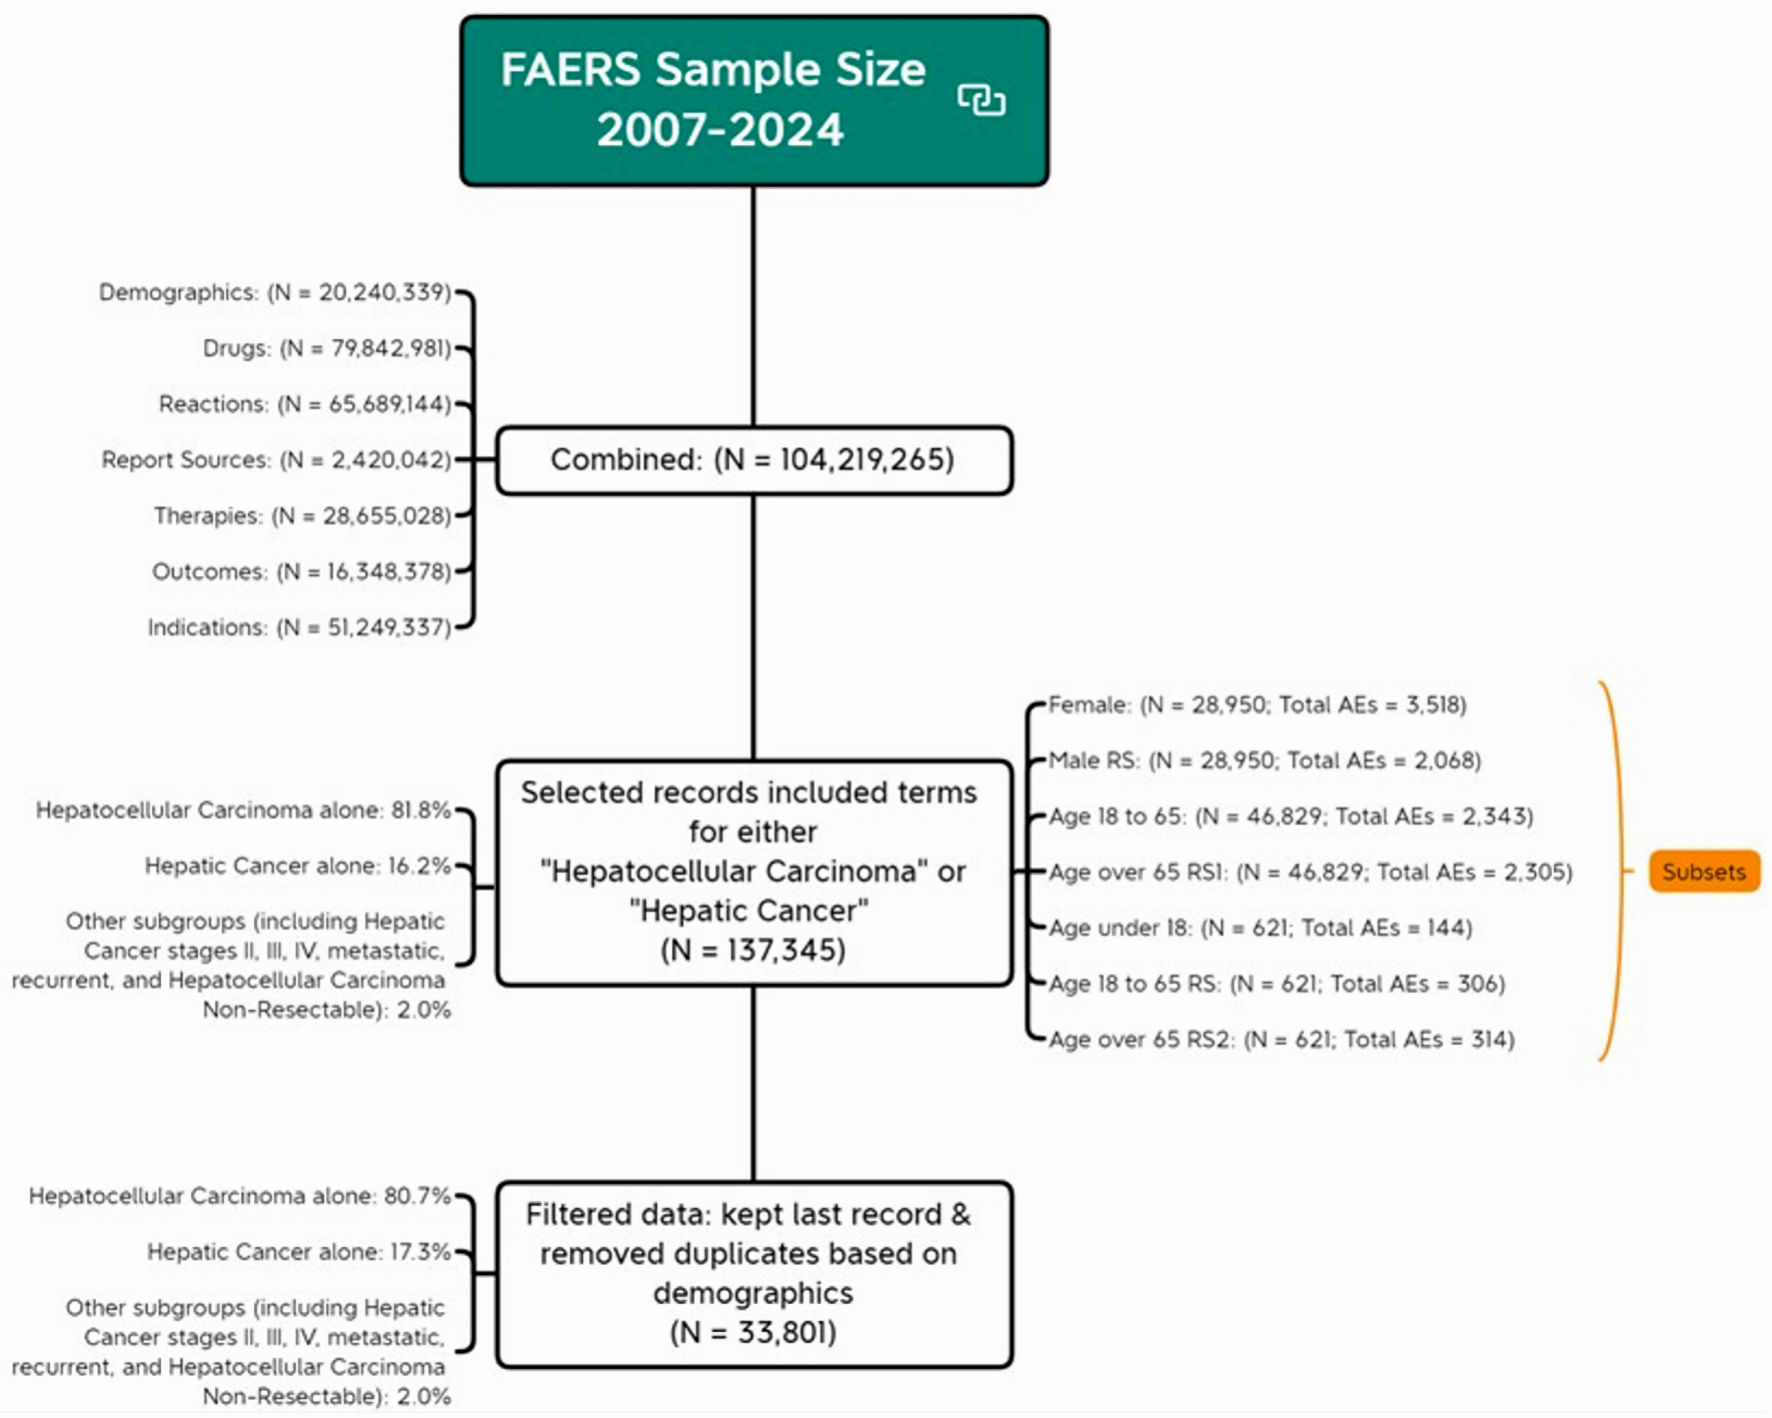
↓ Figure 1. Flow chart of analytical sample
screening. AE: adverse event; FDA: US Food and Drug Administration; FAERS: FDA Adverse Event Reporting
System.
| World Journal of Oncology, ISSN 1920-4531 print, 1920-454X online, Open Access |
| Article copyright, the authors; Journal compilation copyright, World J Oncol and Elmer Press Inc |
| Journal website https://wjon.elmerpub.com |
Original Article
Volume 17, Number 2, April 2026, pages 223-236
Strong Signals of Adverse Events in Tyrosine Kinase Inhibitor Therapy for Liver Cancer Treatment
Figures
Tables
| Variables | Sample size | Overall | Sorafenib (n = 6,469) | Regorafenib (n = 1,294) | Lenvatinib (n = 5,862) | Cabozantinib (n = 2,440) | Others (n = 17,736) |
|---|---|---|---|---|---|---|---|
| Age | |||||||
| Less than 18 | 133 | 0.5 (0.4 - 0.6) | 0.6 (0.4 - 0.8) | 0.1 (0.0 - 0.3) | 0.1 (0.0 - 0.2) | 0.1 (0.0 - 0.3) | 0.7 (0.6 - 0.8) |
| 18 to 65 | 10,388 | 41.3 (40.7 - 41.9) | 50.0 (48.6 - 51.3) | 51.6 (48.4 - 54.7) | 34.8 (33.4 - 36.3) | 33.0 (30.6 - 35.4) | 40.0 (39.2 - 40.9) |
| Greater than 65 | 14,637 | 58.2 (57.6 - 58.8) | 49.4 (48.0 - 50.8) | 48.3 (45.2 - 51.5) | 65.1 (63.6 - 66.6) | 66.9 (64.5 - 69.3) | 59.3 (58.4 - 60.1) |
| Gender | |||||||
| Male | 23,828 | 77.9 (77.4 - 78.4) | 79.1 (78.1 - 80.1) | 77.2 (74.8 - 79.6) | 79.6 (78.5 - 80.6) | 80.6 (79.0 - 82.2) | 76.5 (75.9 - 77.2) |
| Female | 6,665 | 21.8 (21.3 - 22.3) | 20.6 (19.6 - 21.6) | 22.8 (20.4 - 25.2) | 20.4 (19.4 - 21.5) | 19.4 (17.8 - 21.0) | 23.0 (22.3 - 23.7) |
| Not specify | 93 | 0.3 (0.2 - 0.4) | 0.3 (0.2 - 0.4) | - | - | - | 0.5 (0.4 - 0.6) |
| Outcome | |||||||
| Critical outcomes | 5,976 | 19.7 (19.2 - 20.1) | 20.4 (19.4 - 21.4) | 14.0 (12.1 - 15.9) | 15.6 (14.7 - 16.6) | 21.7 (19.3 - 24.1) | 21.1 (20.4 - 21.7) |
| Healthcare utilization | 11,757 | 38.7 (38.1 - 39.2) | 25.0 (24.0 - 26.1) | 24.0 (21.6 - 26.4) | 66.9 (65.6 - 68.1) | 27.5 (24.9 - 30.1) | 35.9 (35.1 - 36.6) |
| Chronic condition | 203 | 0.7 (0.6 - 0.8) | 0.6 (0.4 - 0.8) | 0.9 (0.4 - 1.4) | 0.6 (0.4 - 0.8) | 1.1 (0.5 - 1.7) | 0.7 (0.5 - 0.8) |
| Others | 12,465 | 41.0 (40.4 - 41.6) | 54.0 (52.7 - 55.2) | 61.1 (58.4 - 63.8) | 16.9 (15.9 - 17.9) | 49.7 (46.8 - 52.7) | 42.4 (41.6 - 43.1) |
| Country of occurrence | |||||||
| Japan | 10,208 | 34.9 (34.4 - 35.5) | 23.5 (22.4 - 24.6) | 28.3 (25.8 - 30.8) | 68.8 (67.6 - 70.1) | 40.1 (38.2 - 42.1) | 27.2 (26.5 - 27.9) |
| United States | 7,825 | 26.8 (26.3 - 27.3) | 26.1 (25.0 - 27.2) | 17.7 (15.6 - 19.8) | 15.8 (14.8 - 16.8) | 37.8 (35.9 - 39.8) | 29.9 (29.2 - 30.7) |
| Others | 11,209 | 38.3 (37.8 - 38.9) | 50.4 (49.1 - 51.6) | 54.0 (51.3 - 56.7) | 15.4 (14.4 - 16.4) | 22.0 (20.4 - 23.7) | 42.9 (42.1 - 43.7) |
| Occupation of reporter | |||||||
| Medical professionals | 26,097 | 77.7 (77.2 - 78.1) | 71.6 (70.5 - 72.7) | 77.3 (75.0 - 79.6) | 80.9 (79.9 - 81.9) | 63.6 (61.7 - 65.5) | 80.8 (80.2 - 81.4) |
| Non-medical professionals | 7,500 | 22.3 (21.9 - 22.8) | 28.4 (27.3 - 29.5) | 22.7 (20.4 - 25.0) | 19.1 (18.1 - 20.1) | 36.4 (34.5 - 38.3) | 19.2 (18.6 - 19.8) |
| Type of cancer | |||||||
| Hepatocellular carcinoma | 27,279 | 80.7 (80.3 - 81.1) | 77.5 (76.5 - 78.5) | 83.1 (81.0 - 85.1) | 88.1 (87.2 - 88.9) | 82.6 (81.1 - 84.1) | 79.0 (78.4 - 79.6) |
| Hepatic cancer | 5,832 | 17.3 (16.9 - 17.7) | 20.1 (19.1 - 21.1) | 15.7 (13.7 - 17.7) | 11.6 (10.7 - 12.4) | 17.2 (15.7 - 18.7) | 18.2 (17.6 - 18.8) |
| Others | 690 | 2.0 (1.9 - 2.2) | 2.4 (2.0 - 2.8) | 1.2 (0.6 - 1.8) | 0.4 (0.2 - 0.5) | 0.2 (0.0 - 0.3) | 2.8 (2.5 - 3.0) |
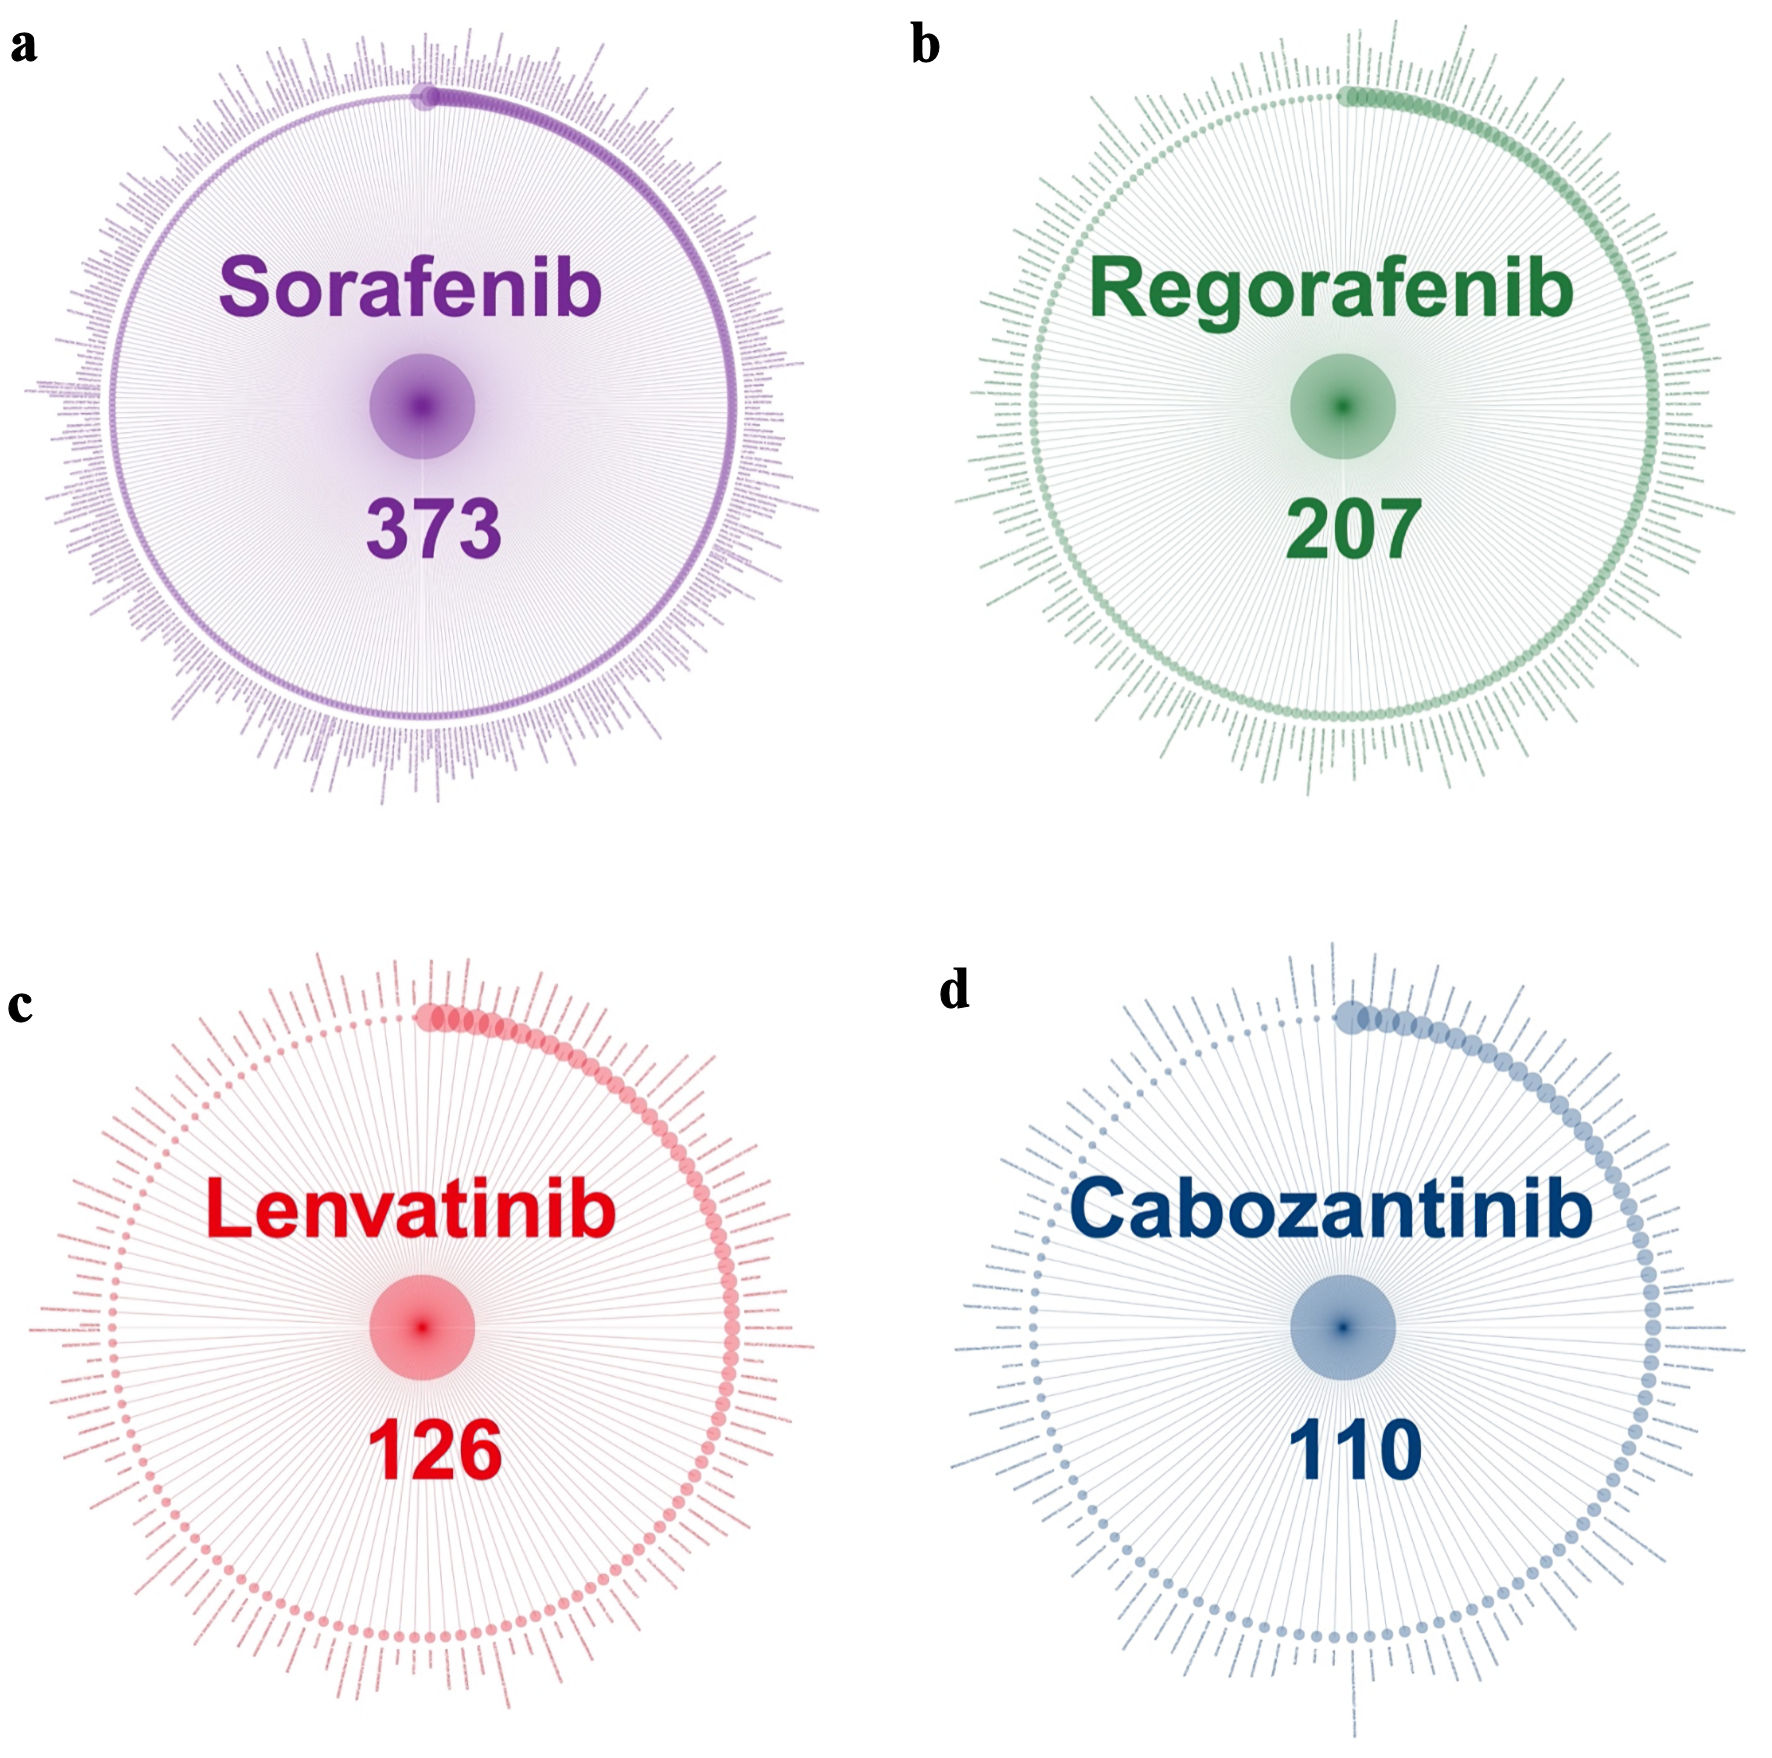
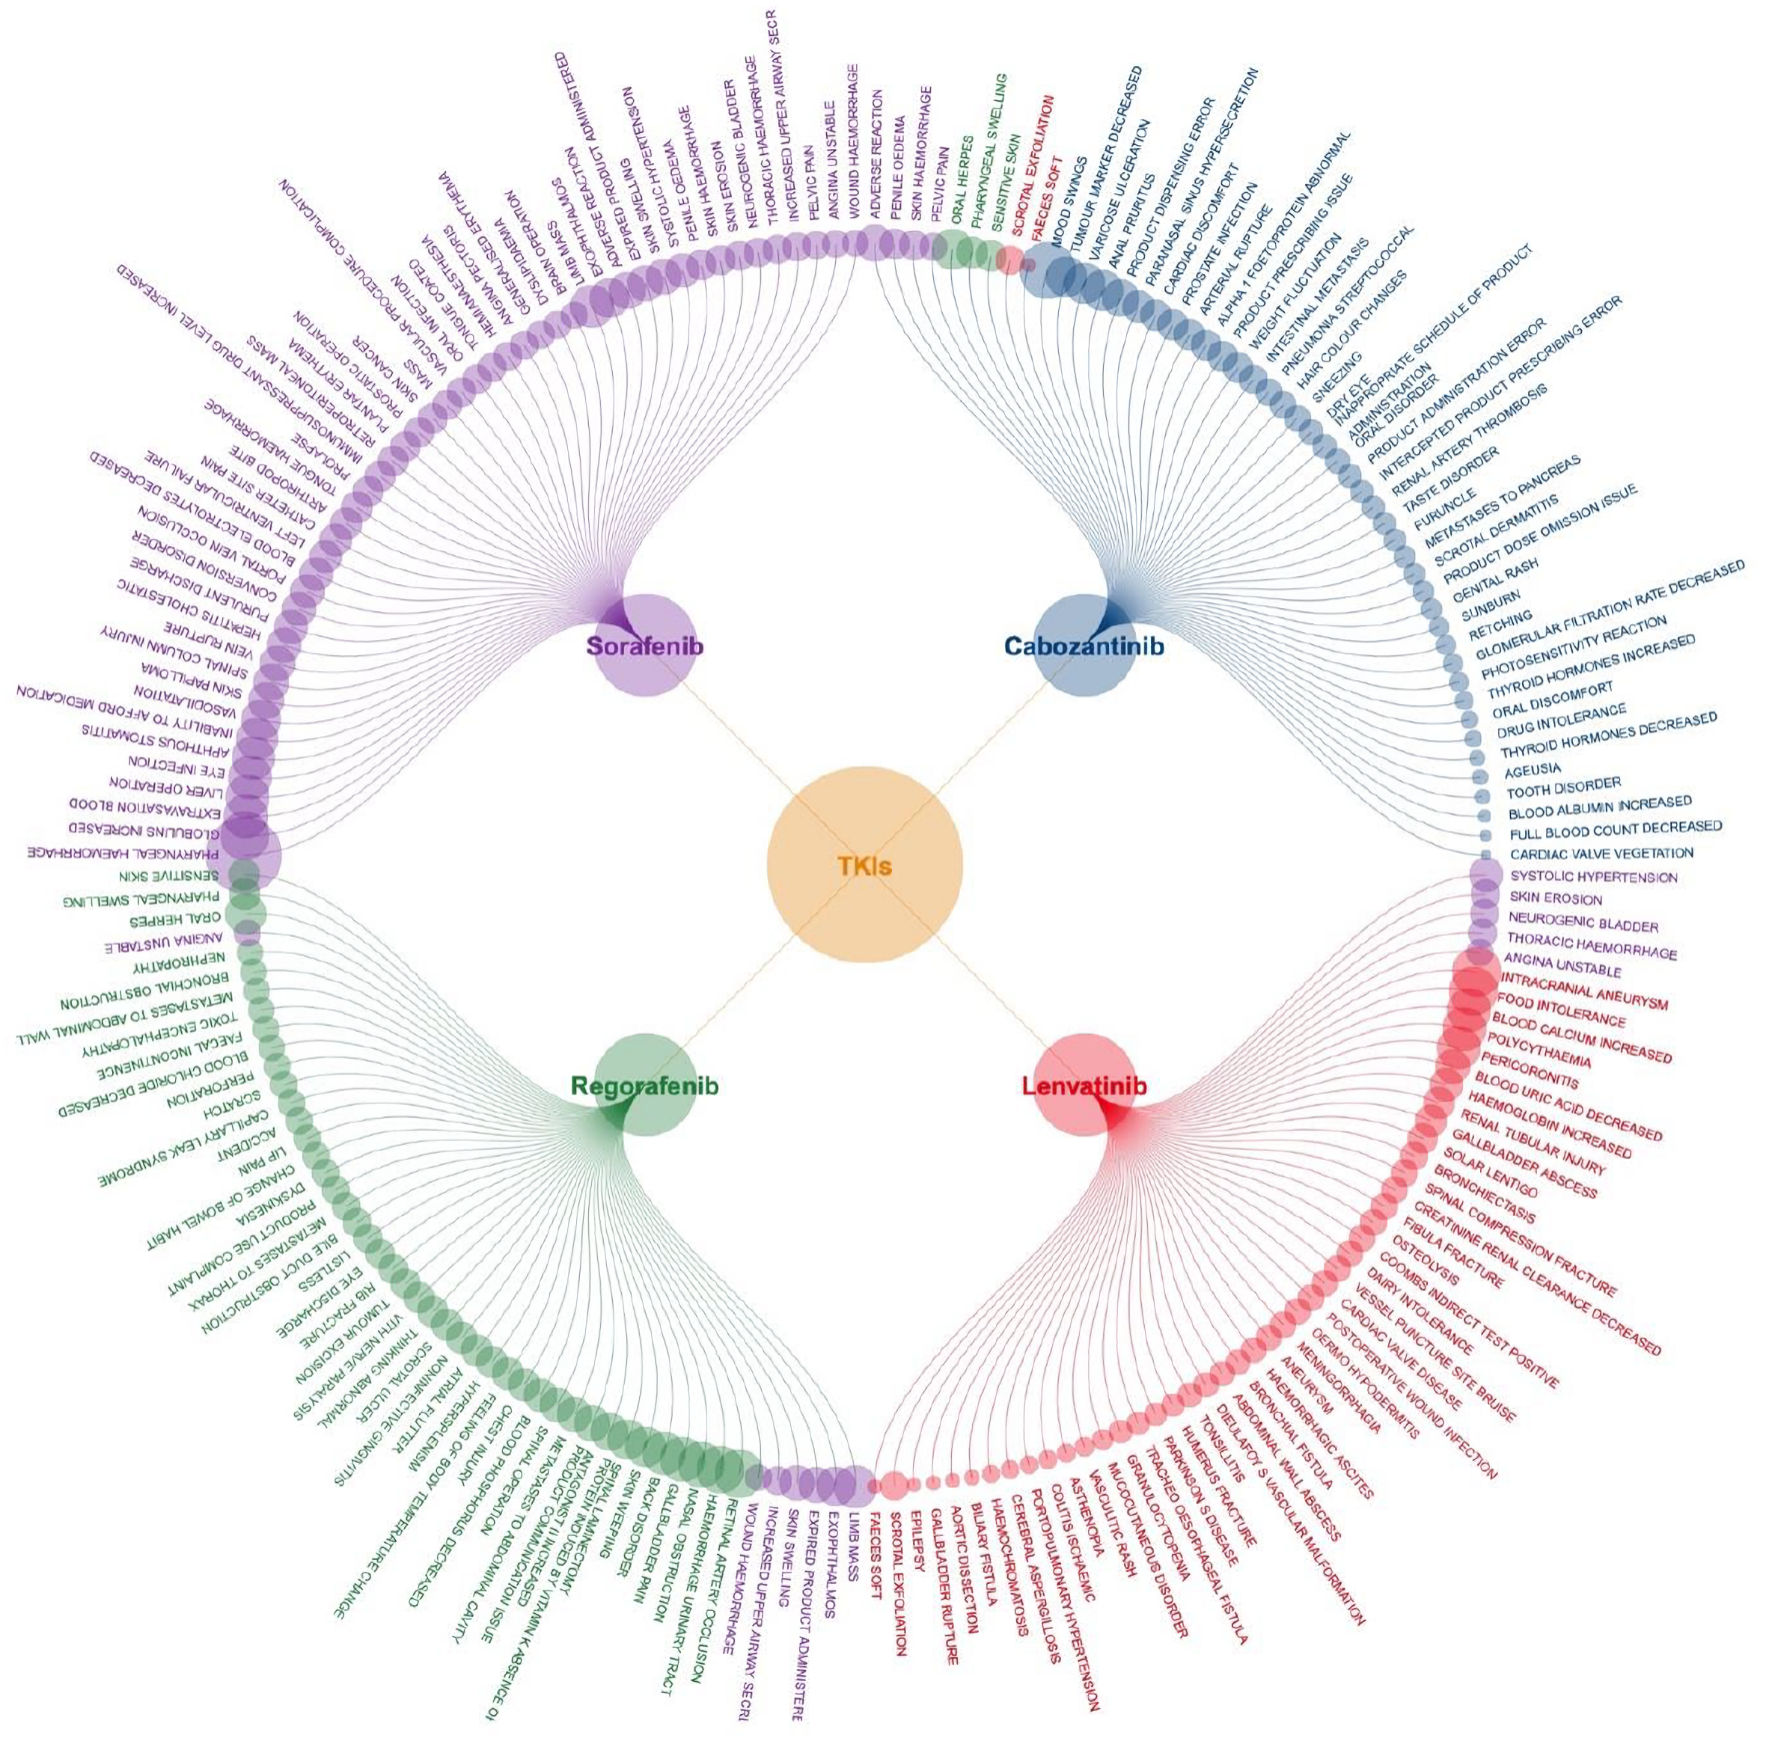
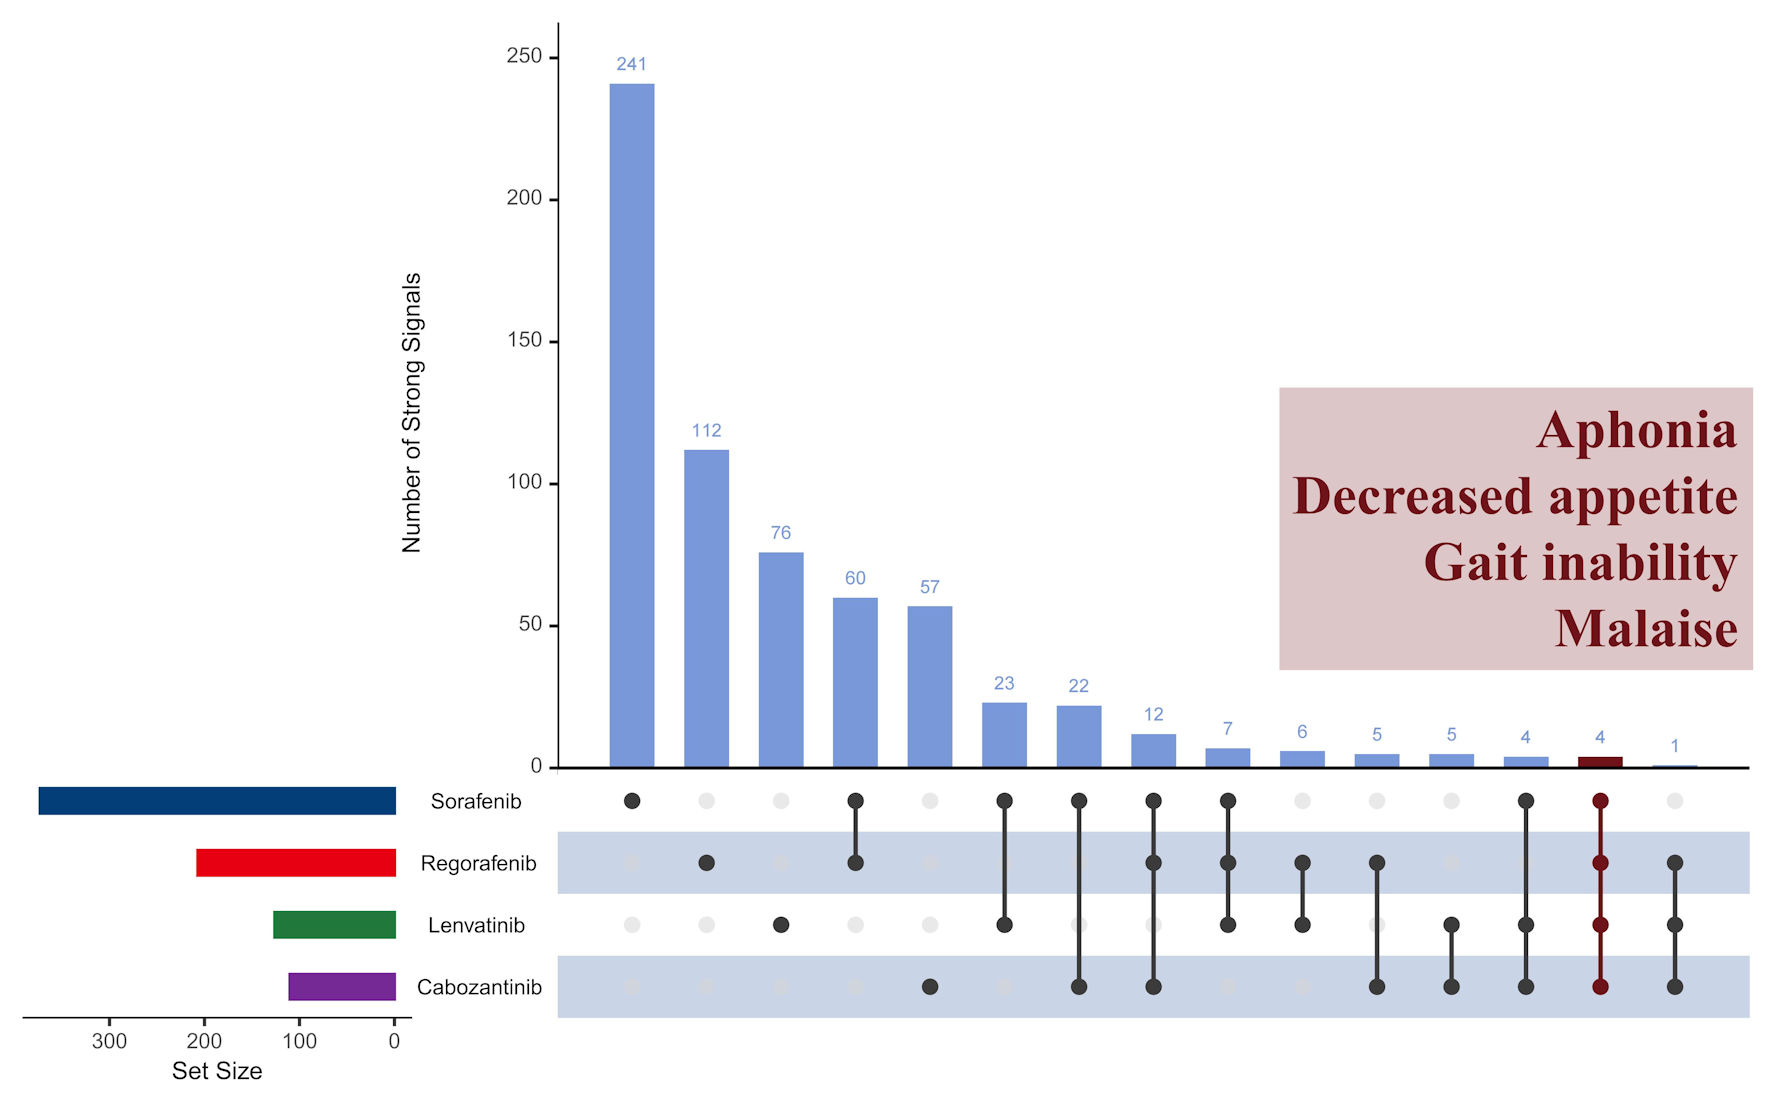
| Sorafenib | Regorafenib | Lenvatinib | Cabozantinib | |
|---|---|---|---|---|
| AE: adverse event; AR: adverse reactions; FDA: US Food and Drug Administration; FAERS: FDA Adverse Event Reporting System; EU: European Union. | ||||
| FAERS | 373 | 207 | 126 | 110 |
| Drug facts | ||||
| FDA | 129 | 43 | 105 | 114 |
| EU | 110 | 65 | 88 | 166 |
| Japan | 117 | 129 | 87 | 73 |
| China | 107 | 61 | 167 | - |
| Consistent AEs | ||||
| FDA | 34 | 8 | 11 | 17 |
| EU | 24 | 9 | 8 | 16 |
| Japan | 25 | 16 | 7 | 11 |
| China | 25 | 8 | 14 | - |
| Comparison between agencies | ||||
| FDA vs. EU | 90 | 35 | 57 | 73 |
| FDA vs. Japan | 88 | 38 | 48 | 51 |
| FDA vs. China | 87 | 33 | 83 | - |
| EU vs. Japan | 92 | 58 | 49 | 60 |
| EU vs. China | 95 | 59 | 82 | - |
| Japan vs. China | 93 | 53 | 60 | - |