Figures
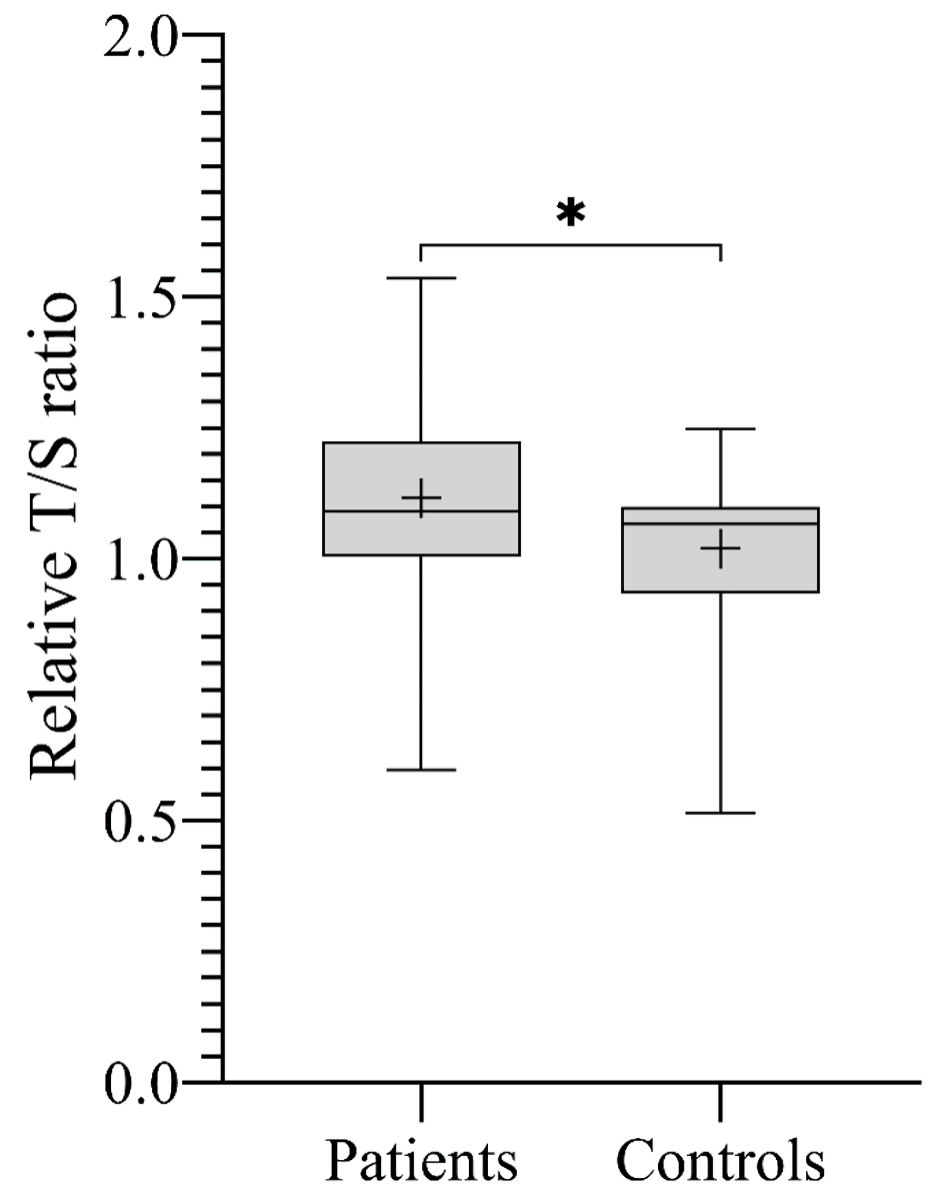
↓ Figure 1. The mean RTL expressed by T/S ratio across all study participants. Boxplot showing that patients with sarcoma had significantly longer RTL compared to controls (*P = 0.02). T/S ratio of patients: 1.12 ± 0.20, corresponding to 5,967 ± 493 bp. T/S ratio of controls: 1.02 ± 0.14, corresponding to 5,735 ± 330 bp. bp: base pairs; RTL: relative telomere length; T/S ratio: telomere to single copy gene ratio.
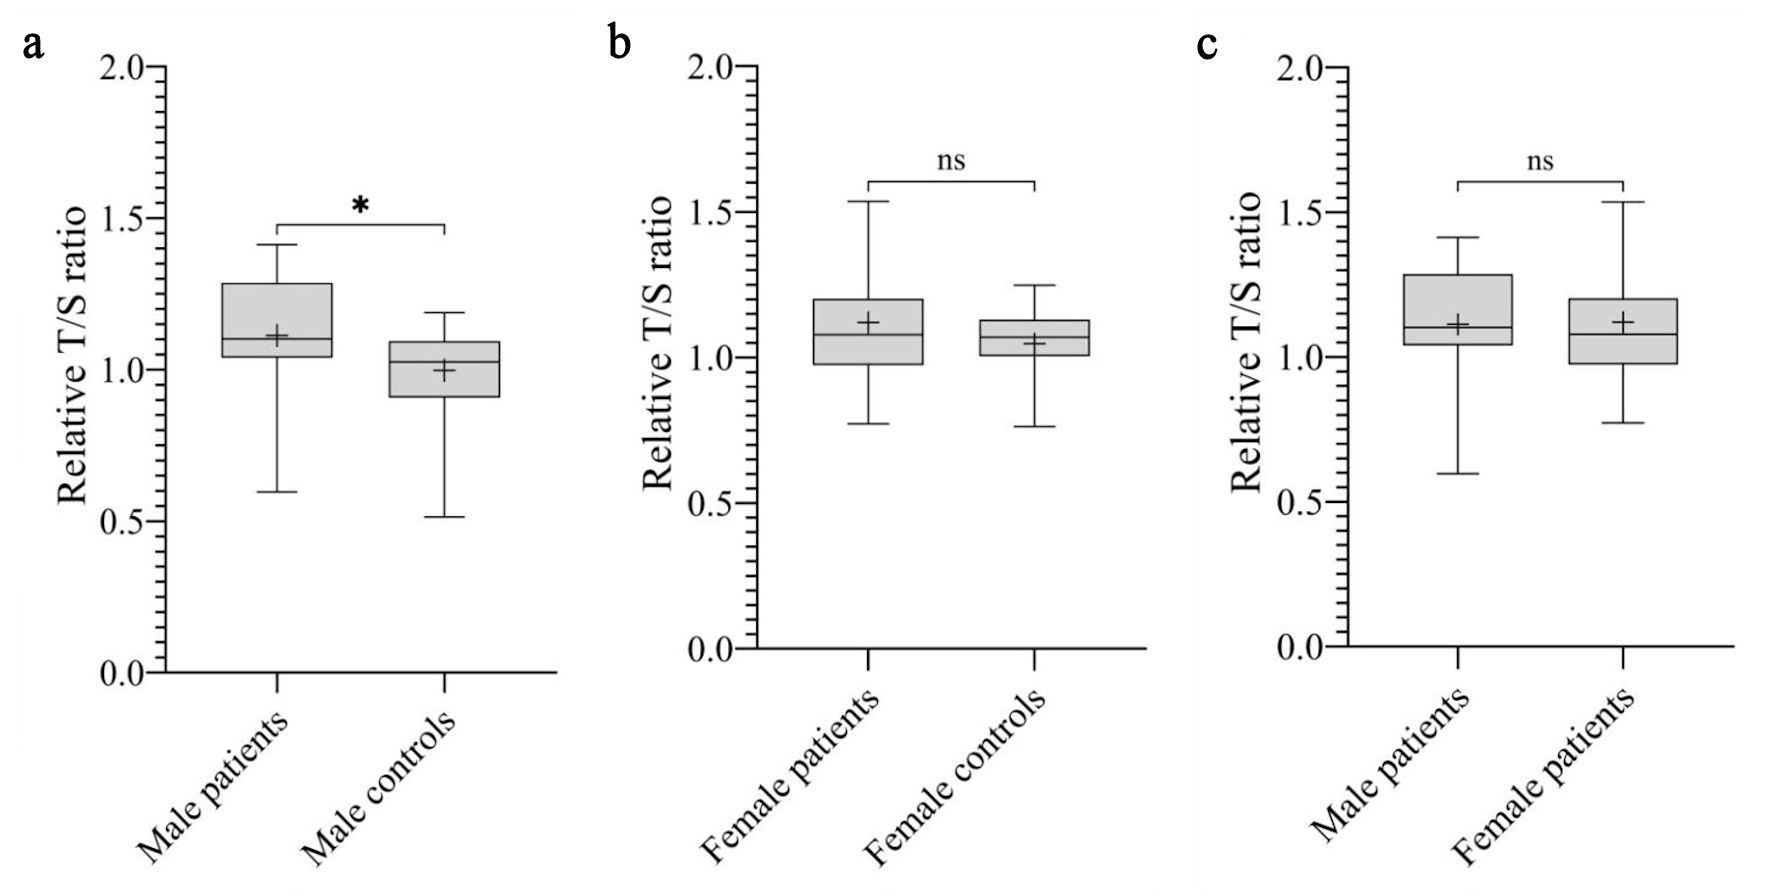
↓ Figure 2. The mean RTL expressed by T/S ratio across gender. (a) Boxplot showing that male patients had significantly longer RTL compared to male controls (*P = 0.01). T/S ratio of male patients: 1.11 ± 0.19, corresponding to 5,960 ± 466 bp. T/S ratio of male controls: 1.00 ± 0.14, corresponding to 5,682 ± 346 bp. (b) No significant difference in RTL was observed between female patients and female controls (P = 0.57). T/S ratio of female patients: 1.12 ± 0.23, corresponding to 5,978 ± 548 bp. T/S ratio of female controls: 1.05 ± 0.13, corresponding to 5,802 ± 302 bp. (c) No significant difference in RTL was observed between male patients and female patients (P = 0.76). bp: base pairs; ns: not significant; RTL: relative telomere length; T/S ratio: telomere to single copy gene ratio.
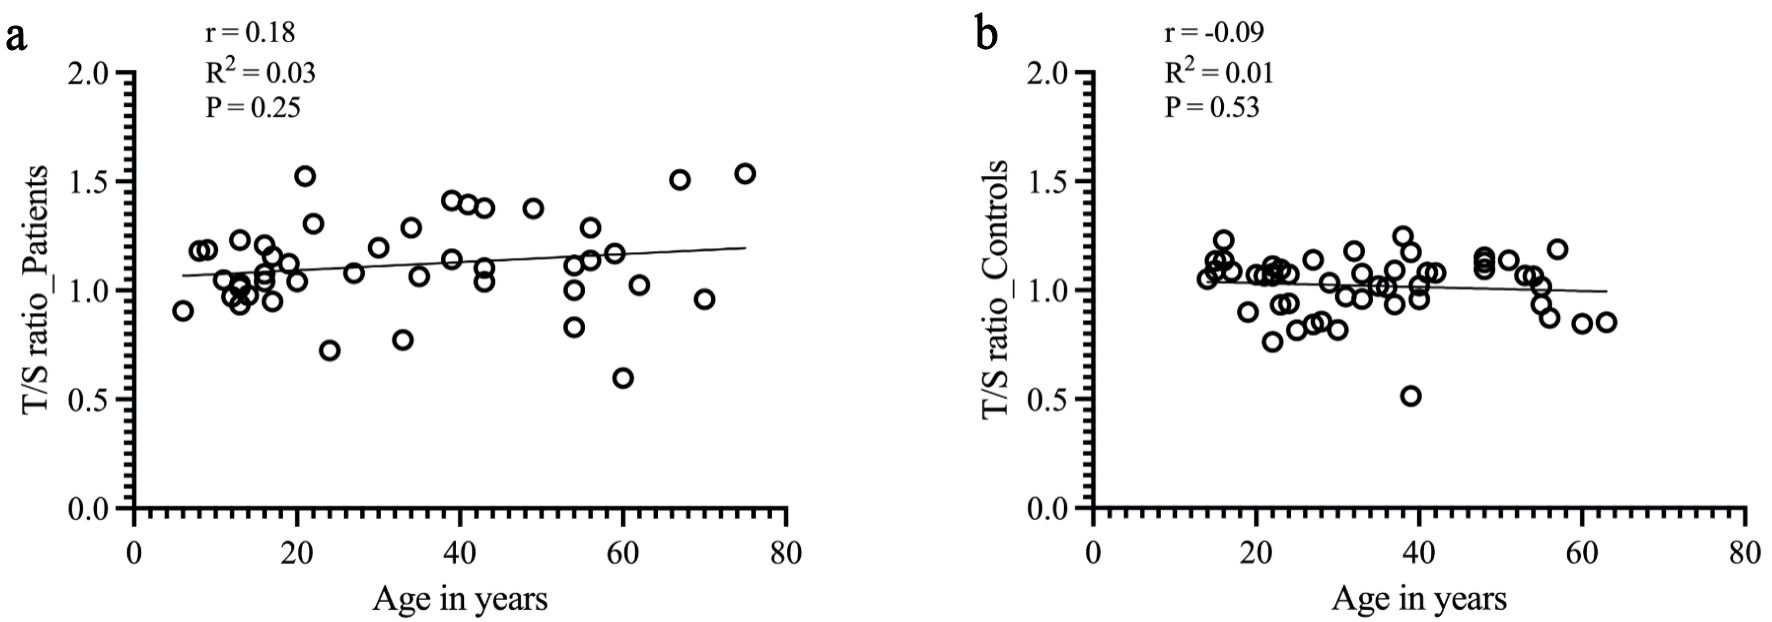
↓ Figure 3. Correlation between the mean RTL and aging in patients and controls. Mean RTL was calculated by linear regression equation and is indicated by solid lines (y-axis = T/S ratio; x-axis = age in years). (a) For patients with sarcoma, no correlation was found between TL shortening and aging (Pearson correlation, r = 0.18, R2 = 0.03, P = 0.25). (b) For the control group, RTL was negatively correlated with age (Pearson correlation, r = -0.09, R2 = 0.01). However, no statistical significance was found (P = 0.5). RTL: relative telomere length; T/S ratio: telomere to single copy gene ratio.
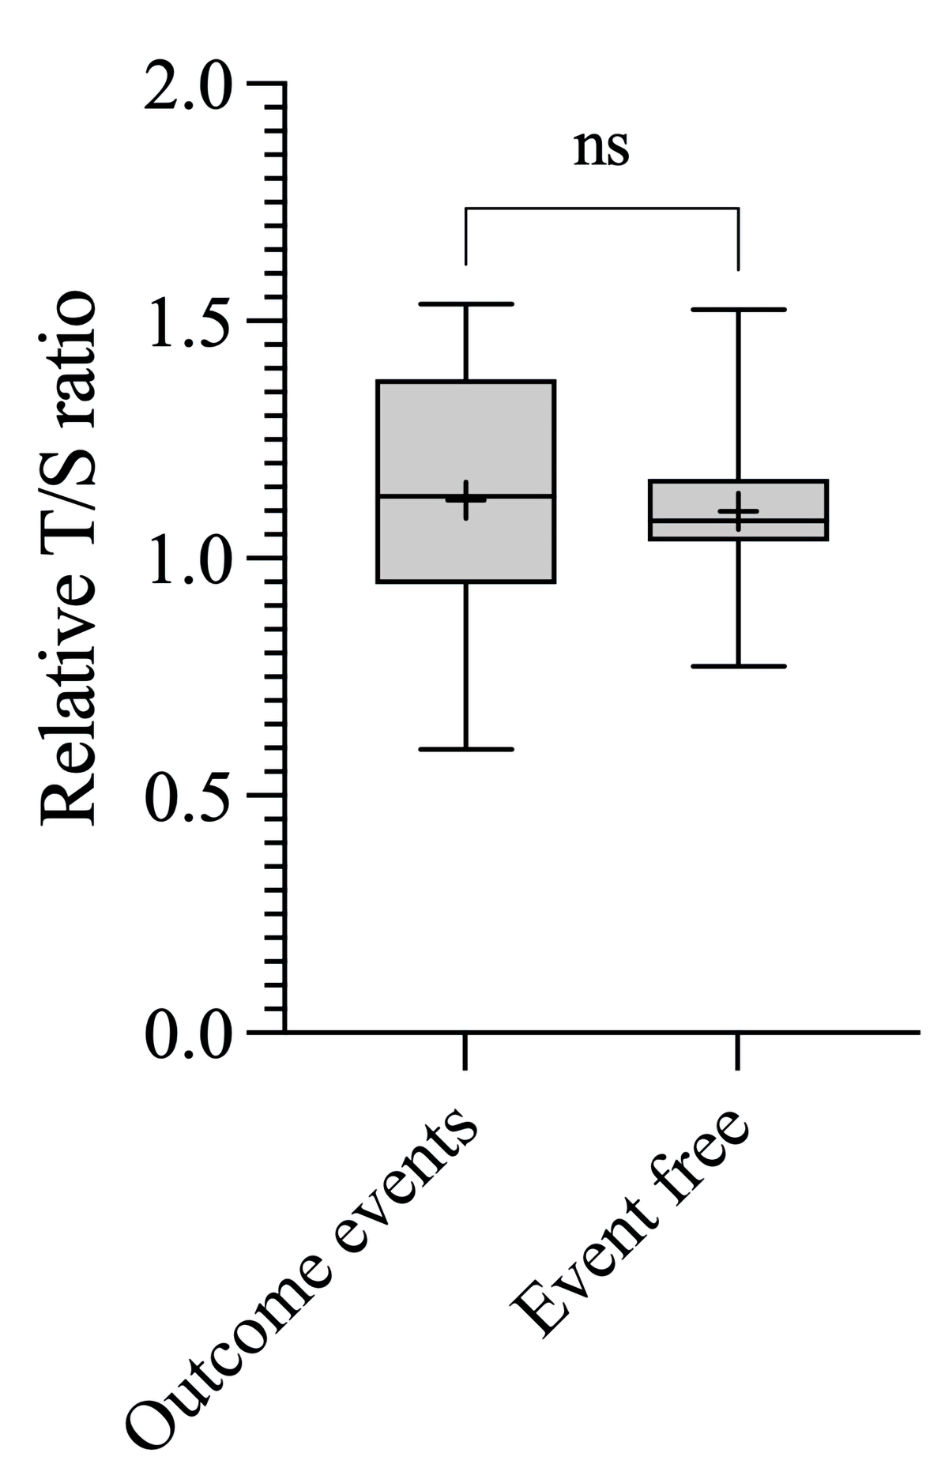
↓ Figure 4. Associations between RTL and outcome events. Boxplot showing the T/S ratio of patients who experienced outcome event (1.12 ± 0.26, corresponding to 5,981 ± 616 bp) and T/S ratio of patients event free (1.10 ± 0.17, corresponding to 5,926 ± 407 bp). bp: base pairs; ns: not significant; RTL: relative telomere length; T/S ratio: telomere to single copy gene ratio.
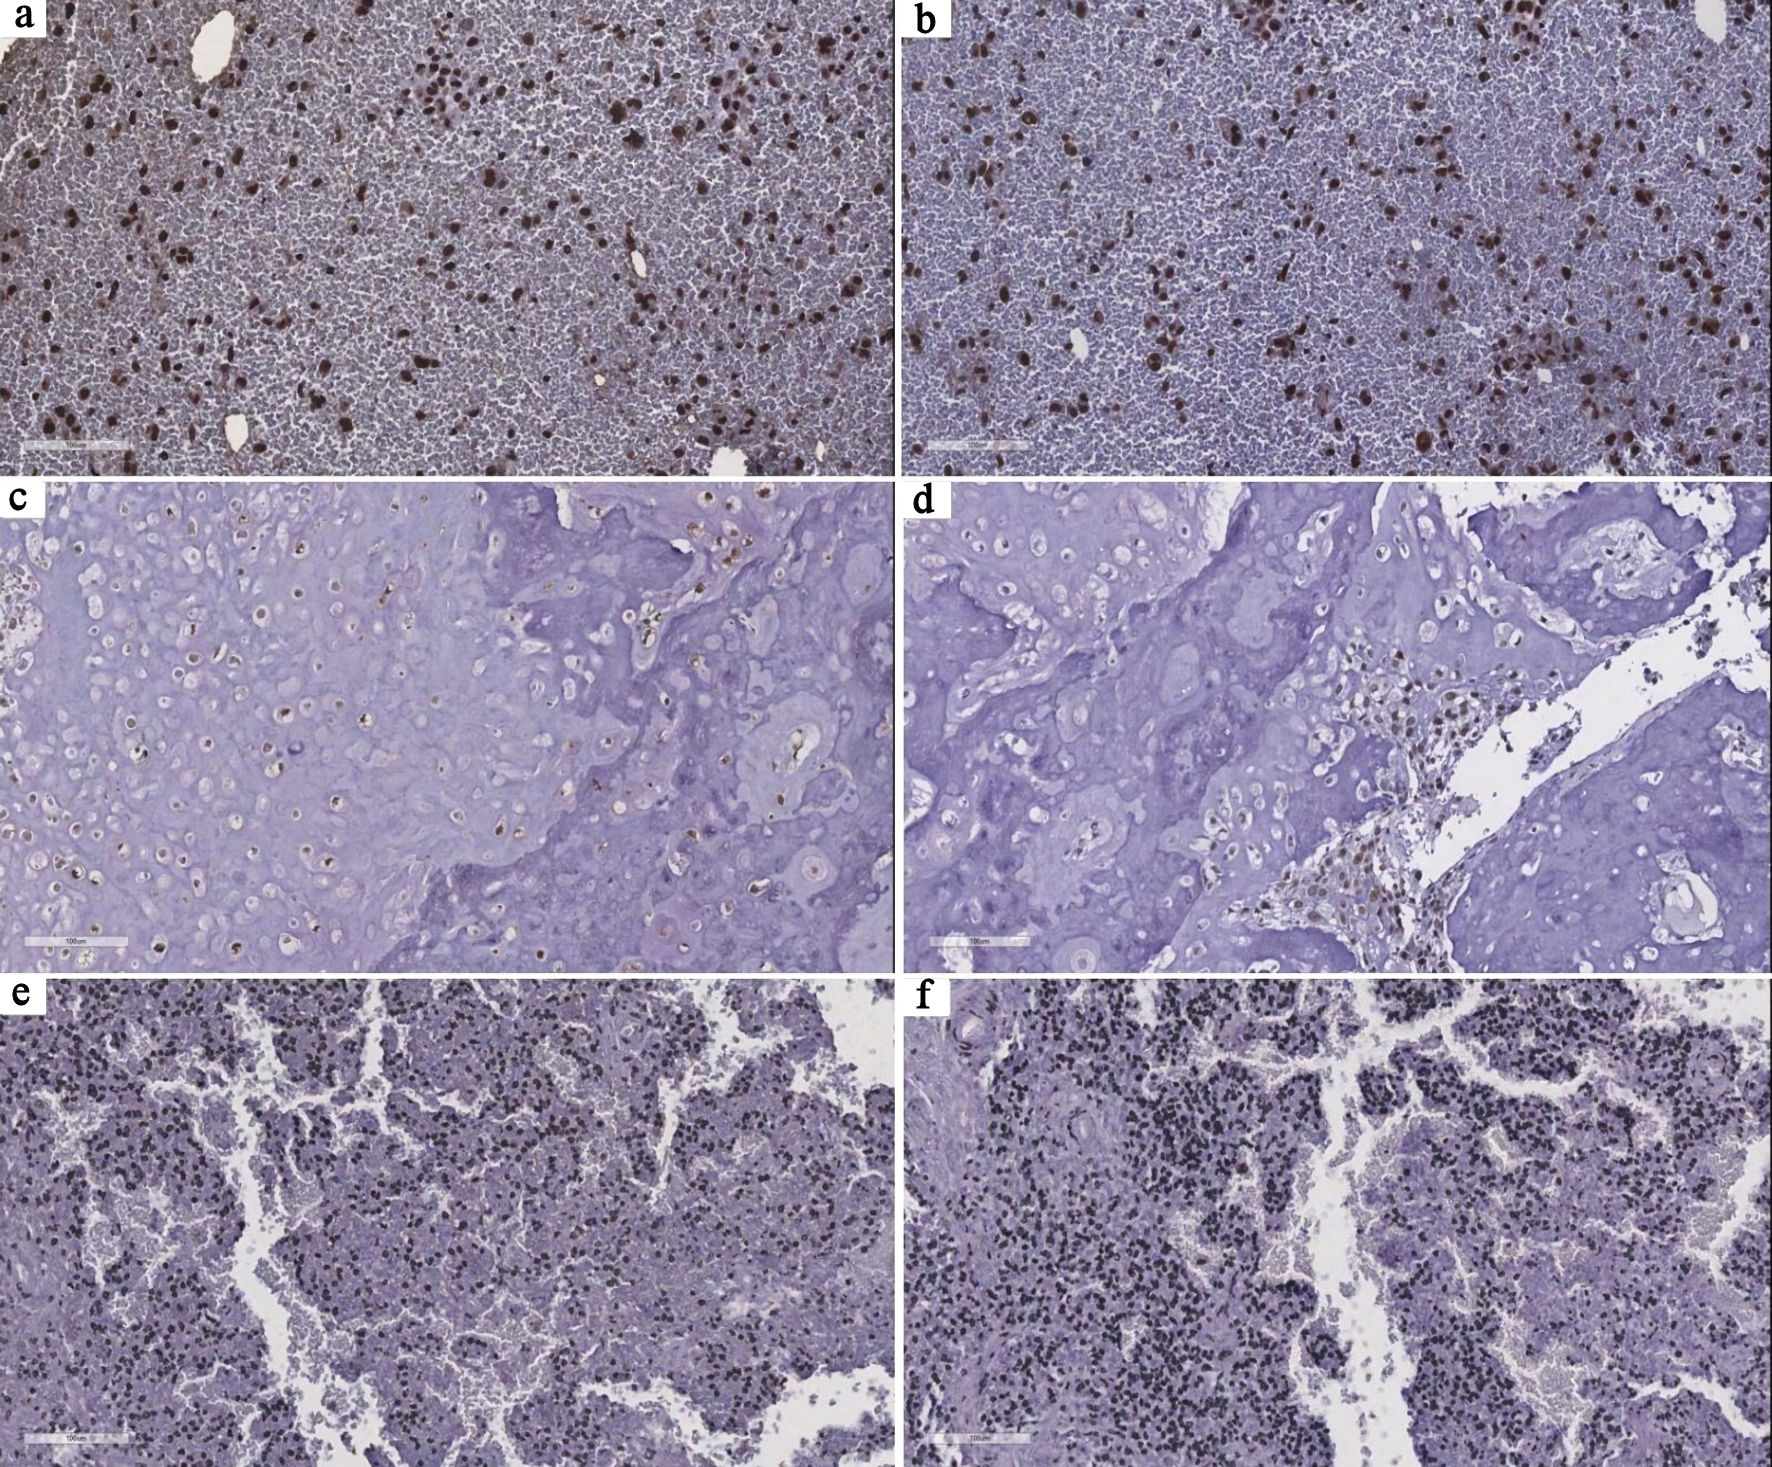
↓ Figure 5. Representative immunohistochemical patterns of TERT and ATRX expression in tumor samples. (a, b) Case 8 shows diffuse, strong nuclear staining for both TERT and ATRX, consistent with a telomerase-associated profile. (c, d) Case 6 demonstrates diffuse and strong nuclear TERT expression with focal, moderate ATRX staining, highlighting intratumoral heterogeneity in telomere maintenance–related pathways. (e, f) Case 13 shows absence of TERT expression and complete loss of ATRX expression, suggesting a potential ALT phenotype. All images are at × 20 magnification. TERT: telomerase reverse transcriptase; ATRX: alpha thalassemia/mental retardation syndrome X-linked; ALT: alternative lengthening of telomeres.
Tables
↓ Table 1. Clinical and Sociodemographic Characteristics of the Participants in This Study
| Characteristics | Patients (n = 44) | Controls (n = 50) |
|---|
| *A total of 35 patients were evaluated during follow-up. SD: standard deviation; NA: not applicable. |
| Age at diagnosis, years, mean ± SD | | |
| Overall | 32.70 ± 19.79 | 34.04 ± 13.75 |
| Adults | 44.81 ± 15.69 | 36.98 ± 12.53 |
| Children | 13.47 ± 3.50 | 16.00 ± 1.63 |
| | |
| Sex | | |
| Female | 17 | 22 |
| Male | 27 | 28 |
| | |
| Tumor grade | | |
| Low | 4 | NA |
| High | 40 | NA |
| | |
| Amputation of the limb | | |
| Yes | 6 | NA |
| No | 38 | NA |
| | |
| Outcome at the last follow-up* | | |
| Yes | 22 | NA |
| Recurrence | 2 | NA |
| Metastasis | 4 | NA |
| Recurrence + metastasis | 3 | NA |
| Death | 7 | NA |
| Metastasis + death | 3 | NA |
| Recurrence + death | 1 | |
| Recurrence + metastasis + death | 2 | |
| No | 13 | NA |
↓ Table 2. Primary Tumor Site of Bone Sarcomas in This Study
| Primary site of tumor | Cases, n (%) |
|---|
| Femur | 21 (47.7) |
| Humerus | 8 (18.2) |
| Tibia | 6 (13.6) |
| Fibula | 4 (9.1) |
| Pelvis | 2 (4.5) |
| Iliac | 2 (4.5) |
| Scapula | 1 (2.3) |
| Total | 44 (100) |
↓ Table 3. Telomere Length (T/S Ratio) in Peripheral Blood and Tumor Tissue, and Immunohistochemical Expression of TERT and ATRX
| Patient | Sarcoma type | T/S blood | T/S tumor | TERT | ATRX |
|---|
| TERT and ATRX expression are reported as pattern (diffuse, multifocal, focal), intensity (strong, moderate, weak), and localization (N: nuclear; C: cytoplasmic; Nu: nucleolar). ATRX loss was defined as complete absence of nuclear staining in tumor cells in the presence of positive internal controls. NA: not available; CS: chondrosarcoma; OS: osteosarcoma; ES: Ewing sarcoma; T/S ratio: telomere to single copy gene ratio; TERT: telomerase reverse transcriptase; ATRX: alpha thalassemia/mental retardation syndrome X-linked. |
| 1 | CS | 0.96 | 1.03 | NA | NA |
| 2 | CS | 1.29 | 1.55 | NA | NA |
| 3 | CS | 1.11 | 1.02 | Diffuse–strong–N/C | Diffuse–strong–N/C |
| 4 | CS | 1.14 | NA | Diffuse–strong–N | Diffuse–strong–N |
| 5 | OS | 1.23 | 1.00 | Multifocal–strong–N/Nu | Multifocal–strong–N |
| 6 | OS | 1.19 | 1.11 | Diffuse–strong–N | Focal–moderate |
| 7 | OS | 1.39 | 1.19 | NA | NA |
| 8 | OS | 1.52 | 1.26 | Diffuse–strong–N | Diffuse–strong–N |
| 9 | OS | 1.04 | 1.06 | NA | NA |
| 10 | OS | 1.04 | 1.07 | NA | NA |
| 11 | OS | 1.38 | 1.09 | Focal–C | Focal–weak–N |
| 12 | OS | 0.95 | 1.22 | Diffuse–strong–C | Diffuse–strong–N |
| 13 | ES | 1.18 | NA | Negative | Loss |
| 14 | ES | 1.16 | NA | Diffuse–moderate/strong–N/Nu | Diffuse–moderate/strong–N/Nu |
| 15 | ES | 1.38 | 1.06 | Multifocal–moderate–N | Diffuse–strong–N |
| 16 | ES | 1.41 | 1.21 | NA | NA |