Figures
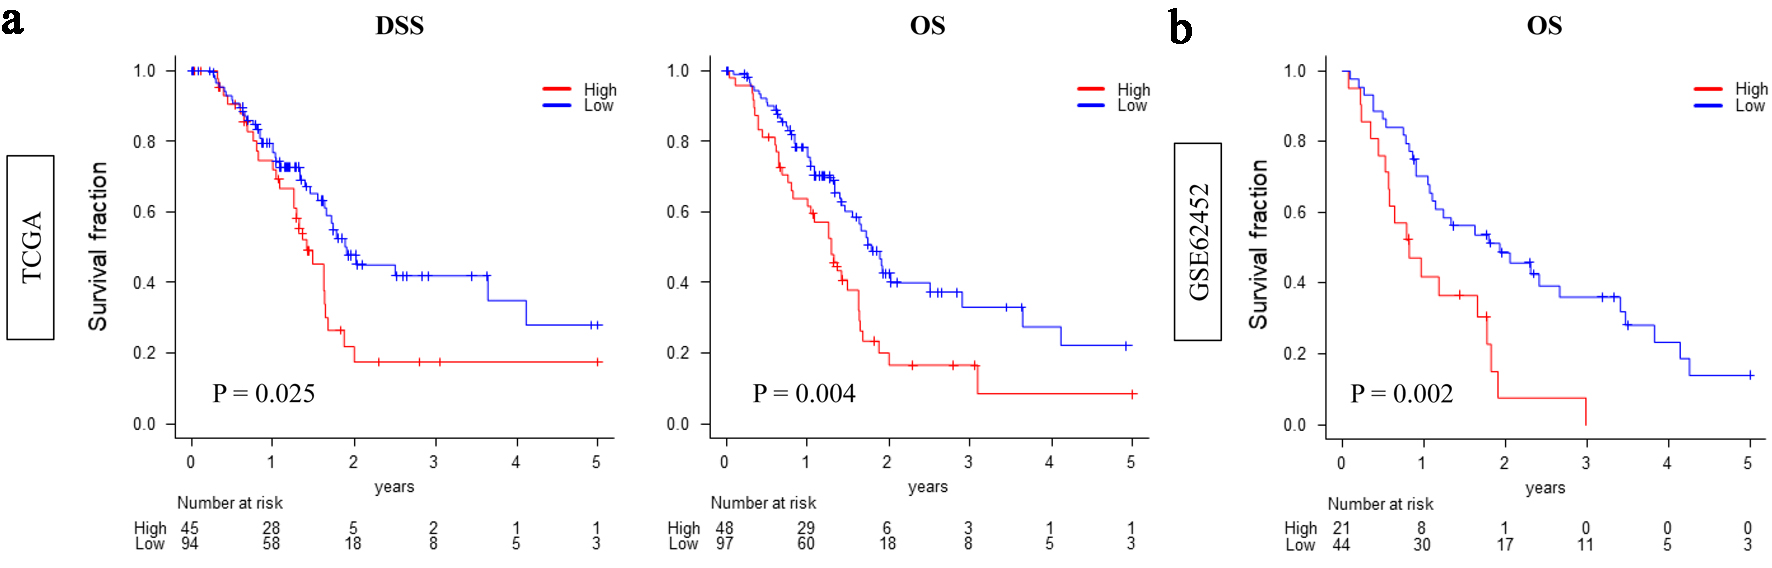
↓ Figure 1. High CDCP1 expression is associated
with poor survival in pancreatic ductal adenocarcinoma (PDAC). Kaplan-Meier survival curves comparing
overall survival between high CDCP1 and low CDCP1 groups in the TCGA and GSE62452 cohorts. Survival
endpoints include disease-specific survival (DSS) and overall survival (OS) in TCGA (a) and OS in
GSE62452 (b). Log-rank test was used to evaluate statistical significance.
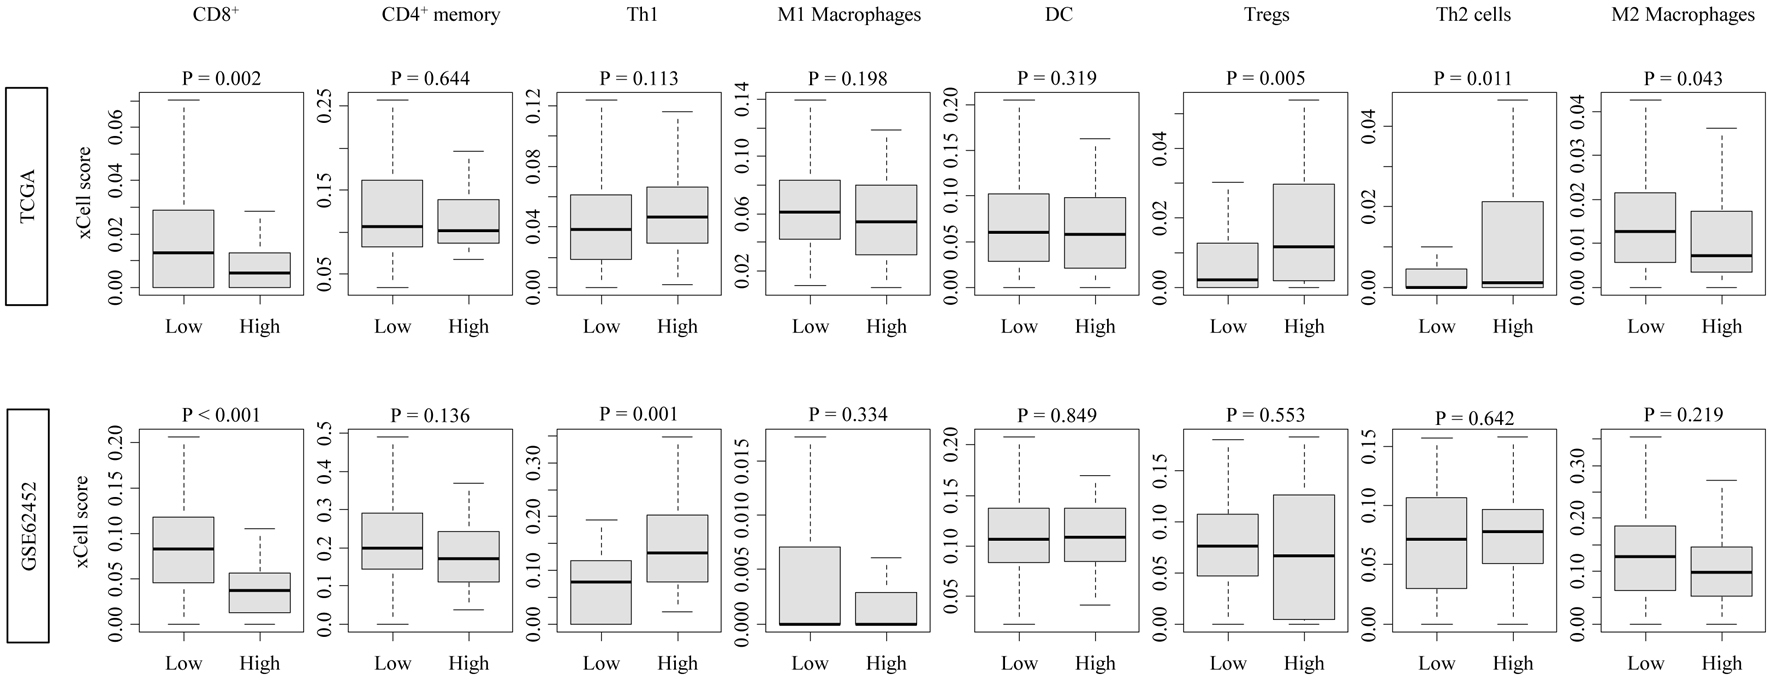
↓ Figure 2. Immune cell infiltration profiles
associated with CDCP1 expression in PDAC. Boxplots showing xCell-inferred infiltration scores of
CD8+ T cells, CD4+ memory T cells, Th1 cells, Th2 cells, regulatory T cells
(Tregs), dendritic cells (DCs), and M1/M2 macrophages in high CDCP1 and low CDCP1 groups in the TCGA and
GSE62452 cohorts.
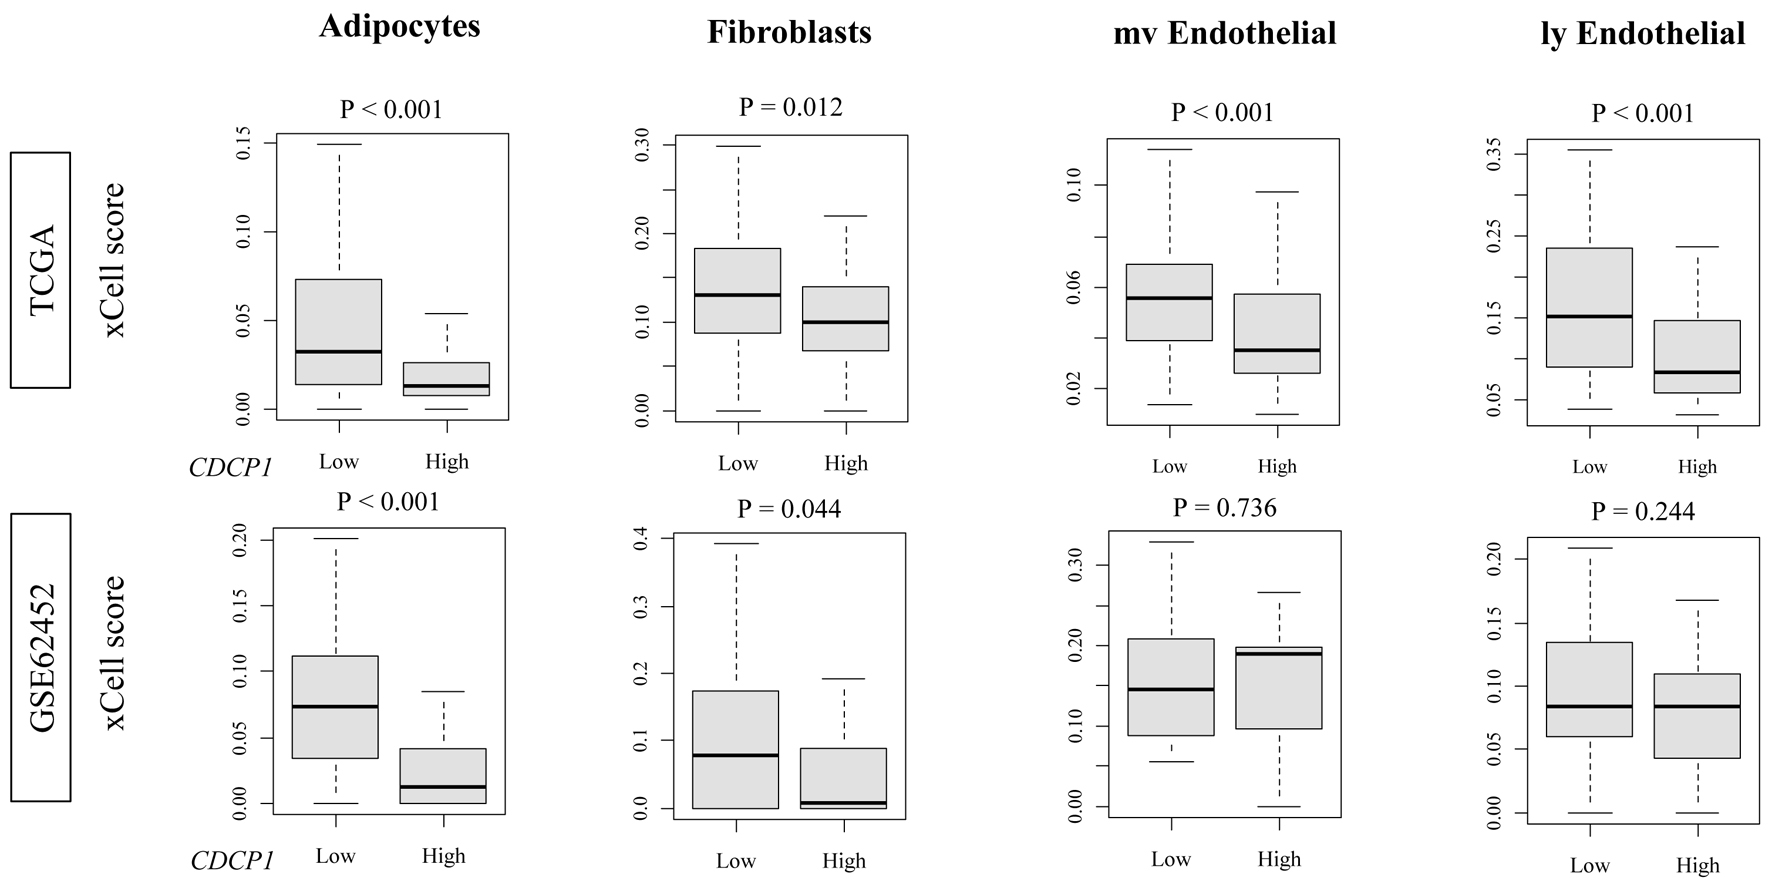
↓ Figure 3. Stromal and endothelial cell
fractions in high CDCP1 versus low CDCP1 PDAC tumors. xCell scores comparing infiltration of adipocytes,
fibroblasts, microvascular endothelial cells (mvECs), and lymphatic endothelial cells (lyECs) between
high CDCP1 and low CDCP1 tumors in the TCGA and GSE62452 cohorts.
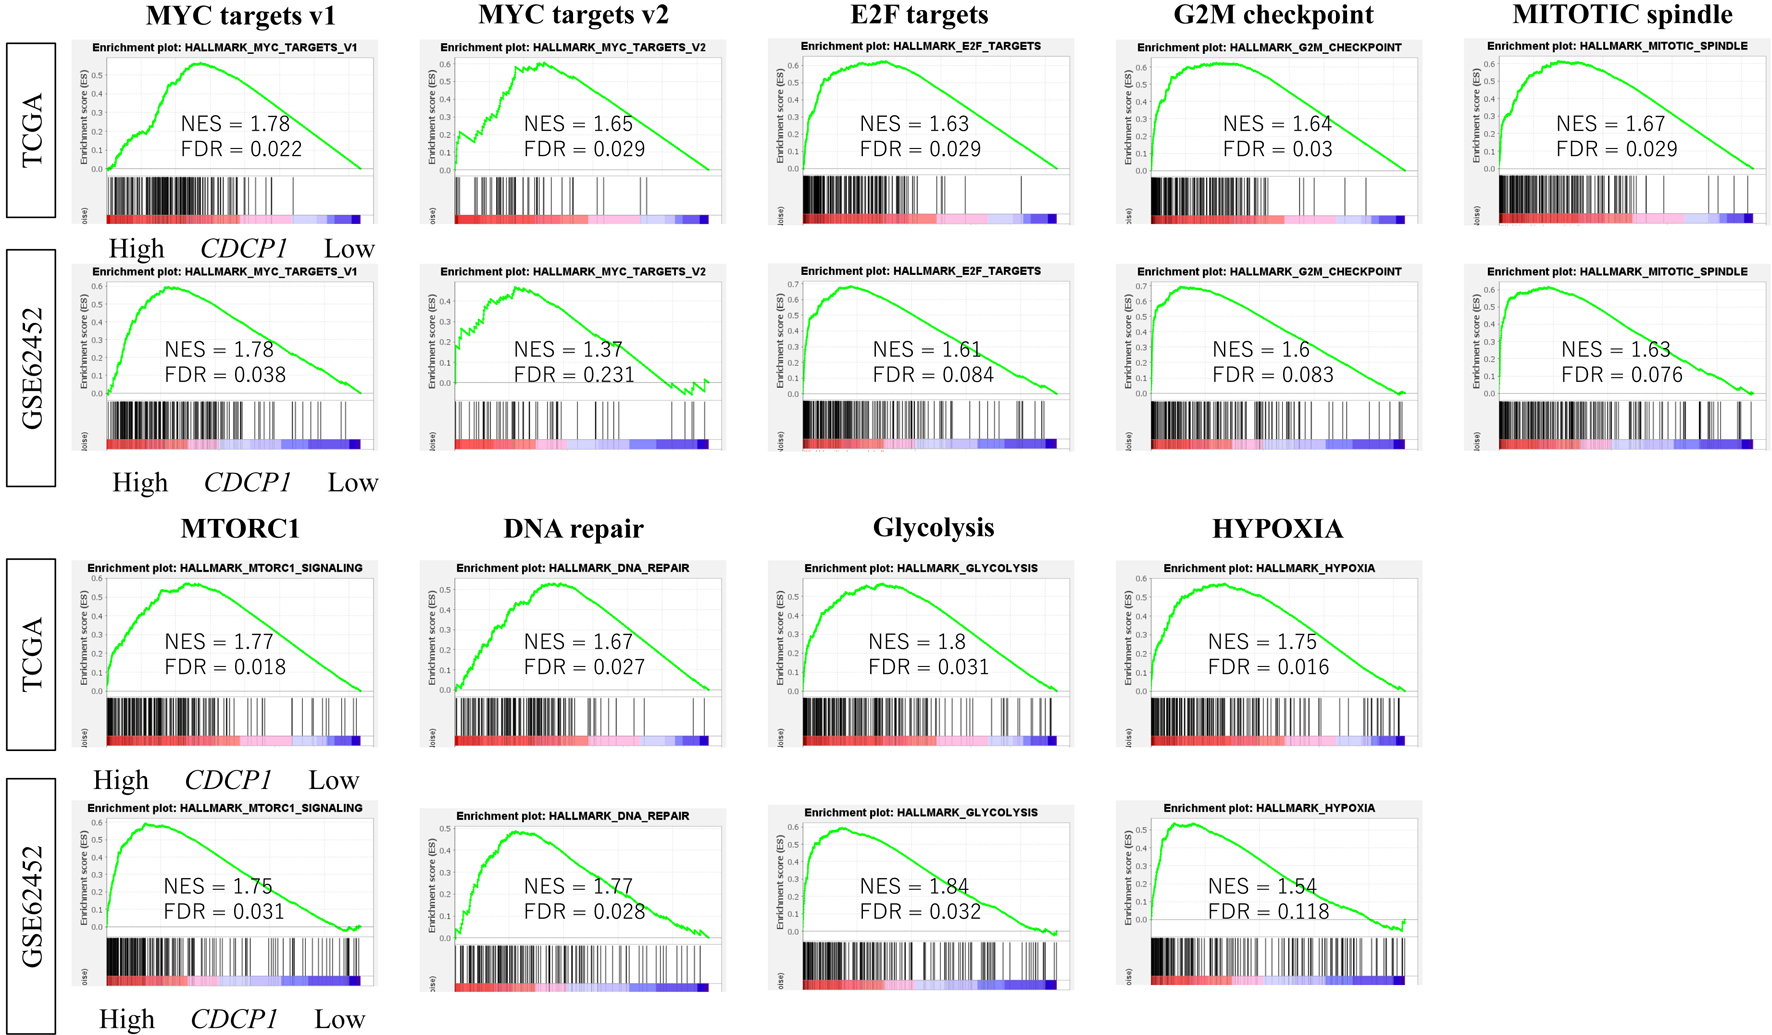
↓ Figure 4. Enrichment of oncogenic signaling
pathways in high CDCP1 PDAC. Comparison of Gene Set Variation Analysis (GSVA) scores for hallmark
pathways including MYC targets v1/v2, E2F targets, mitotic spindle, G2M checkpoint, mTORC1, DNA repair,
PI3K/AKT/mTOR signaling, glycolysis, and hypoxia, between high CDCP1 and low CDCP1 tumors in the TCGA
and GSE62452 cohorts.
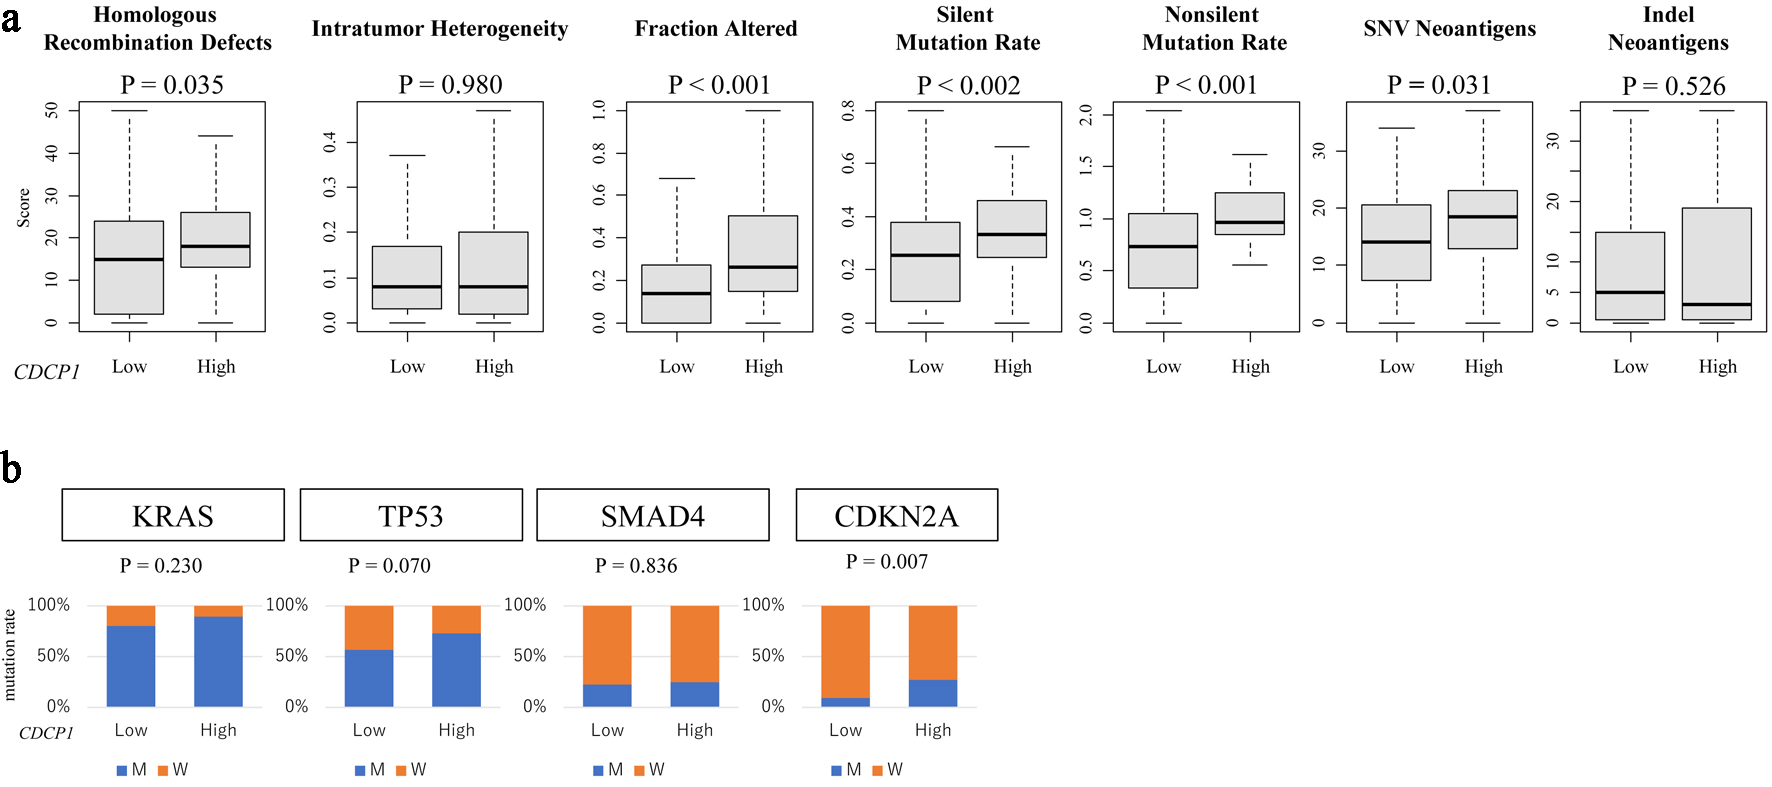
↓ Figure 5. CDCP1 expression is associated with
genomic instability and specific gene mutations. (a) Genomic instability metrics including silent and
non-silent mutation rates, single nucleotide variant (SNV) and indel neoantigen loads, fraction altered,
intratumor heterogeneity, and homologous recombination deficiency (HRD) scores across CDCP1 expression
groups. (b) Bar plots of mutation frequency for key PDAC driver genes (KRAS, TP53, SMAD4, and CDKN2A) in
high CDCP1 and low CDCP1 tumors in the TCGA cohort.