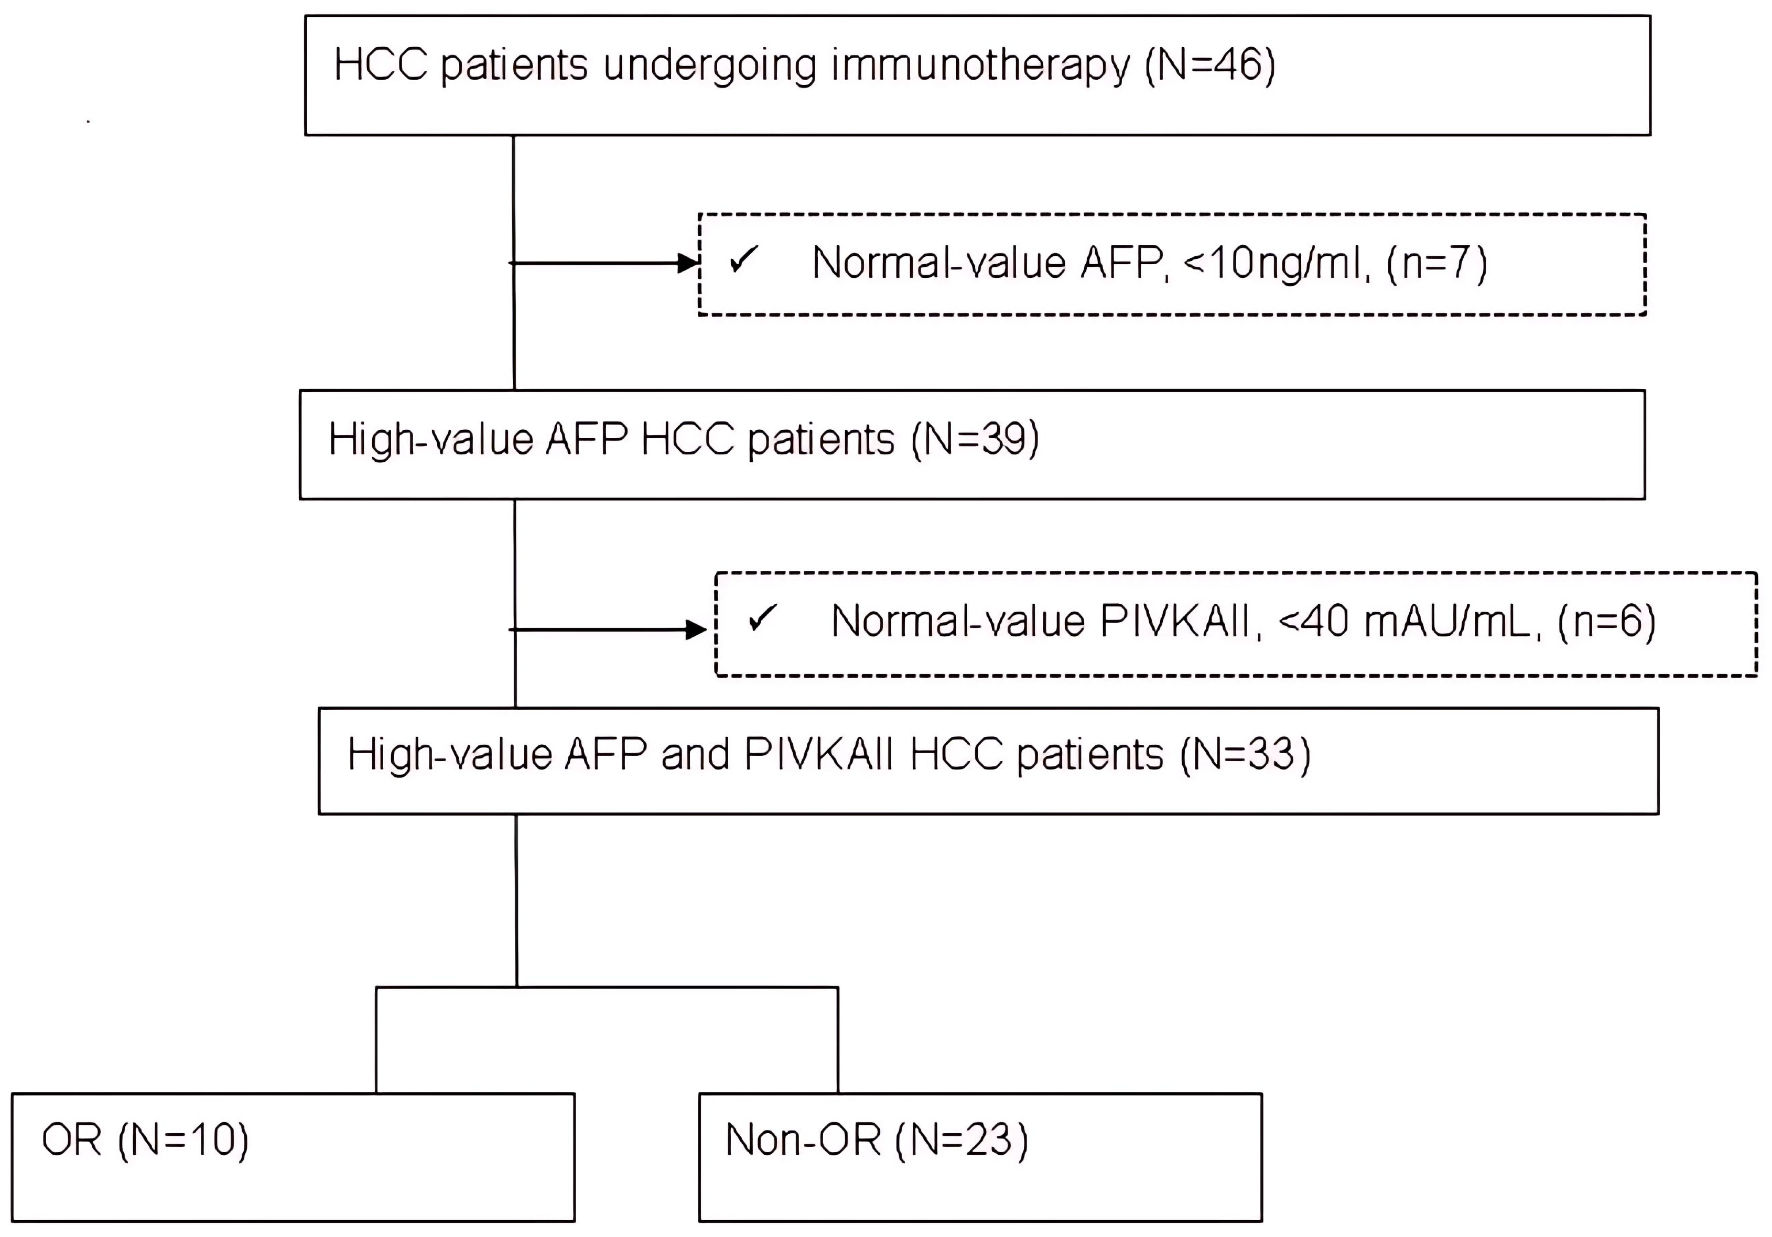
↓ Figure 1. Flow chart of patient selection. AFP:
alpha-fetoprotein; HCC: hepatocellular carcinoma; N: number of patients; OR: objective response.
| World Journal of Oncology, ISSN 1920-4531 print, 1920-454X online, Open Access |
| Article copyright, the authors; Journal compilation copyright, World J Oncol and Elmer Press Inc |
| Journal website https://wjon.elmerpub.com |
Original Article
Volume 16, Number 6, December 2025, pages 565-573
Utility of Alpha-Fetoprotein and Protein Induced by Vitamin K Absence or Antagonist-II Kinetics in Predicting Radiologic Response and Survival in Unresectable Hepatocellular Carcinoma Undergoing Immunotherapy
Figures
Tables
| Variables, mean ± SD or n (%) | Total, n = 33 (100%) | OR, n = 10 (30.3%) | Non-OR, n = 23 (69.7%) | P value |
|---|---|---|---|---|
| AFP; alpha-fetoprotein; ALBI: Albumin-Bilirubin; EHS: extrahepatic spread; HBV: hepatitis B; HCV: hepatitis C; LRT: locoregional therapy; MVI: macrovascular invasion; OR: objective response; SD: standard deviation; TKI: tyrosine kinase inhibitor. | ||||
| Age (years) | 66.4 ± 12.4 | 64.7 ± 11.3 | 68.5 ± 12.9 | 0.425 |
| > 65 | 14 (42.4%) | 4 (40%) | 10 (43.5%) | 0.581 |
| Gender | ||||
| Male | 26 (78.8%) | 9 (90.0%) | 17 (73.9%) | 0.294 |
| Female | 7 (21.2%) | 1 (10.0%) | 6 (26.1%) | |
| Viral hepatitis | ||||
| HBV | 19 (57.6%) | 5 (50.0%) | 14 (60.9%) | 0.419 |
| HCV | 8 (22.2%) | 4 (40.0%) | 4 (17.4%) | 0.170 |
| ALBI grade | ||||
| 1 | 15 (45.5%) | 5 (50.0%) | 10 (43.5%) | 0.512 |
| 2/3 | 18 (54.5%) | 5 (50.0%) | 13 (56.5%) | |
| BCLC stage | ||||
| B | 4 (12.1%) | 2 (20.0%) | 2 (8.7%) | 0.351 |
| C | 29 (87.9%) | 8 (80.0%) | 21 (91.3%) | |
| MVI | 24 (72.7%) | 7 (70.0%) | 17 (73.9%) | 0.566 |
| EHS | 13 (39.4%) | 3 (30.0%) | 10 (43.5%) | 0.371 |
| Concurrent | ||||
| TKI | 19 (57.6%) | 8 (80.0%) | 11 (47.8%) | 0.131 |
| LRT | 9 (27.3%) | 2 (20.0%) | 7 (30.4%) | 0.434 |
| AFP (ng/mL) | 26,911.3 ± 56,182.9 | 38,036.6 ± 57,340.2 | 22,074.2 ± 56,263.2 | 0.470 |
| AFP > 100 ng/mL | 22 (66.7%) | 9 (90.0%) | 13 (56.5%) | 0.066 |
| PIVKA-II (mAU/mL) | 3,754.6 ± 7,912.7 | 2,629.1 ± 4,505.5 | 4,243.9 ± 9,052.1 | 0.598 |
| RECIST | All (n = 33) | |
|---|---|---|
| N | % | |
| Complete response | 1 | 3.0% |
| Partial response | 9 | 27.3% |
| Stable disease | 6 | 18.2% |
| Progressive disease | 17 | 51.5% |
| Objective response rate | 10 | 30.3% |
| Disease control rate | 16 | 48.5% |
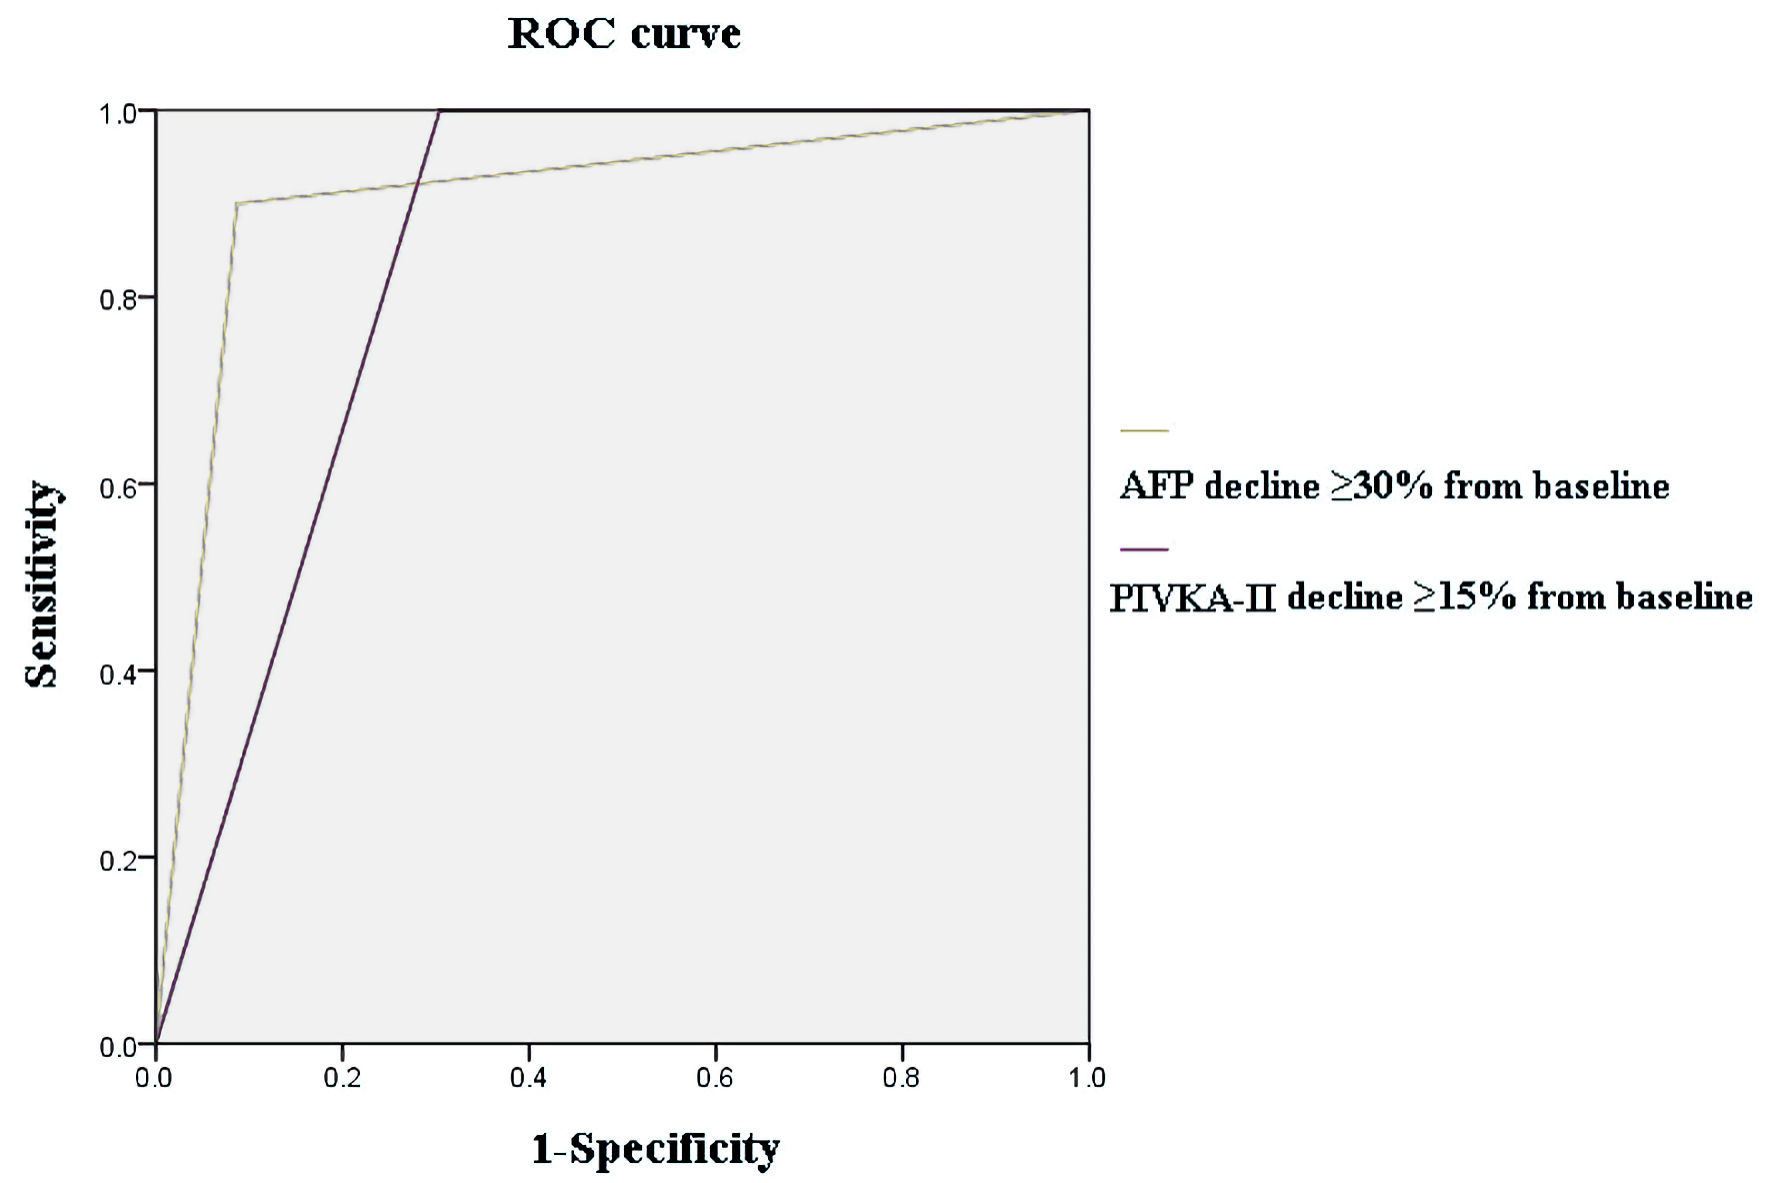
| To OR | ||||||
|---|---|---|---|---|---|---|
| Sensitivity (SEN) | Specificity (SPE) | SEN + SPE | Diagnostic efficacy | Youden index | ROC AUC | |
| AFP: alpha-fetoprotein; PIVKA-II: protein induced by vitamin K absence or antagonist-II; AUC: area under the curve; OR: objective response; ROC: receiver operating characteristic. | ||||||
| AFP decline from baseline | ||||||
| ≥ 5% | 1.0 | 0.70 | 1.70 | 0.79 | 0.70 | |
| ≥ 10% | 0.90 | 0.70 | 1.60 | 0.76 | 0.60 | |
| ≥ 15% | 0.90 | 0.74 | 1.64 | 0.79 | 0.64 | |
| ≥ 20% | 0.90 | 0.78 | 1.68 | 0.82 | 0.68 | |
| ≥ 25% | 0.90 | 0.78 | 1.68 | 0.82 | 0.68 | |
| ≥ 30% | 0.90 | 0.91 | 1.81 | 0.91 | 0.81 | 0.907 |
| ≥ 35% | 0.90 | 0.91 | 1.81 | 0.91 | 0.81 | |
| ≥ 40% | 0.90 | 0.91 | 1.81 | 0.91 | 0.81 | |
| ≥ 45% | 0.80 | 0.91 | 1.71 | 0.88 | 0.71 | |
| ≥ 50% | 0.80 | 0.91 | 1.71 | 0.88 | 0.71 | |
| PIVKA-II decline from baseline | ||||||
| ≥ 5% | 1.00 | 0.65 | 1.65 | 0.76 | 0.65 | |
| ≥ 10% | 1.00 | 0.65 | 1.65 | 0.76 | 0.65 | |
| ≥ 15% | 1.00 | 0.70 | 1.70 | 0.77 | 0.70 | 0.848 |
| ≥ 20% | 0.90 | 0.74 | 1.64 | 0.77 | 0.64 | |
| ≥ 25% | 0.80 | 0.74 | 1.54 | 0.76 | 0.54 | |
| ≥ 30% | 0.80 | 0.74 | 1.54 | 0.76 | 0.54 | |
| ≥ 35% | 0.80 | 0.74 | 1.54 | 0.76 | 0.54 | |
| ≥ 40% | 0.70 | 0.74 | 1.44 | 0.73 | 0.44 | |
| ≥ 45% | 0.70 | 0.78 | 1.48 | 0.76 | 0.48 | |
| AFP and/or PIVKA-II decline from baseline | ||||||
| AFP ≥ 30% | 0.90 | 0.91 | 1.81 | 0.91 | 0.81 | 0.907 |
| PIVKA-II ≥ 15% | 1.00 | 0.70 | 1.70 | 0.77 | 0.70 | 0.848 |
| AFP ≥ 30% and PIVKA-II ≥ 15% | 0.90 | 0.91 | 1.81 | 0.91 | 0.81 | 0.907 |
| AFP ≥ 30% or PIVKA-II ≥ 15% | 1.00 | 0.70 | 1.70 | 0.79 | 0.70 | 0.848 |
| Variables | Univariate analysis | |
|---|---|---|
| HR (95% CI) | P value | |
| ALBI: Albumin-Bilirubin; AFP: alpha-fetoprotein; HBsAg: hepatitis B surface antigen; BCLC: Barcelona Clinic Liver Cancer; CI: confidence interval; EHS: extrahepatic spread; HBV: hepatitis B; HCV: hepatitis C; HR: hazard ratio; LRT: locoregional therapy; MVI: macrovascular invasion; OR: objective response; OS: overall survival; PIVKA-II: protein induced by vitamin K absence or antagonist-II; TKI: tyrosine kinase inhibitor. | ||
| Age (≤ 65 vs. > 65 years) | 0.57 (0.23 - 1.42) | 0.230 |
| Gender (male vs. female) | 1.29 (0.47 - 3.57) | 0.624 |
| HBV (HBsAg + vs. -) | 1.09 (0.46 - 2.59) | 0.845 |
| HCV (anti-HCV + vs. -) | 0.72 (0.28 - 1.87) | 0.501 |
| ALBI grade (1 vs. 2/3) | 0.66 (0.27 - 1.58) | 0.348 |
| BCLC stage (B vs. C) | 0.21 (0.03 - 1.60) | 0.133 |
| MVI (yes vs. no) | 1.40 (0.53 - 3.66) | 0.494 |
| EHS (yes vs. no) | 1.25 (0.52 - 3.00) | 0.612 |
| Concurrent TKI (yes vs. no) | 0.42 (0.18 - 1.01) | 0.053 |
| Concurrent LRT (yes vs. no) | 0.89 (0.34 - 2.30) | 0.807 |
| Baseline AFP (≤ 100 vs. > 100 ng/mL) | 0.56 (0.23 - 1.35) | 0.195 |
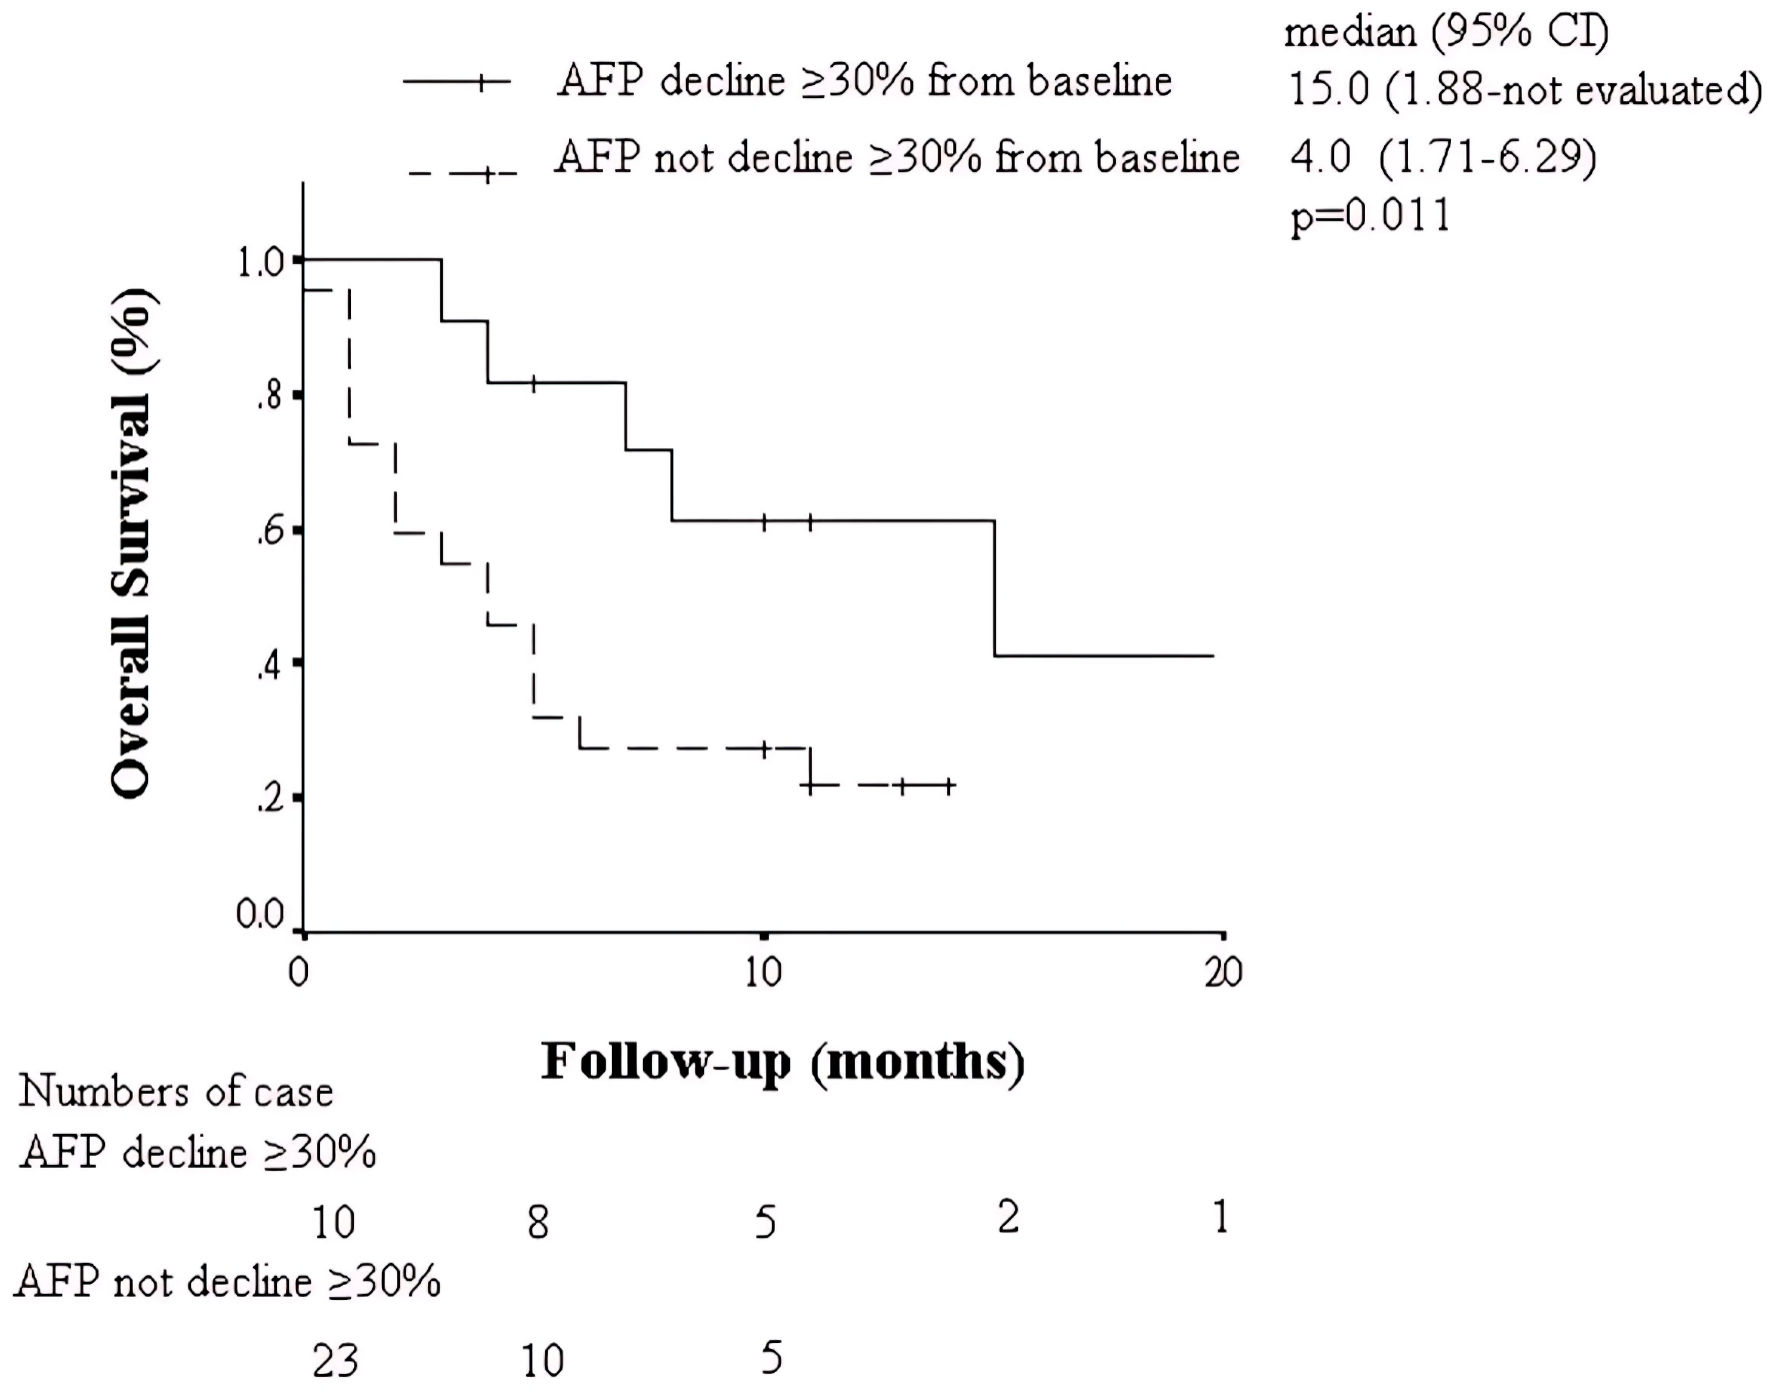
| AFP decline ≥ 30% (yes vs. no) | 0.32 (0.11 - 0.95) | 0.041 |
| PIVKA-II decline ≥ 15% (yes vs. no) | 0.41 (0.16 - 1.03) | 0.057 |
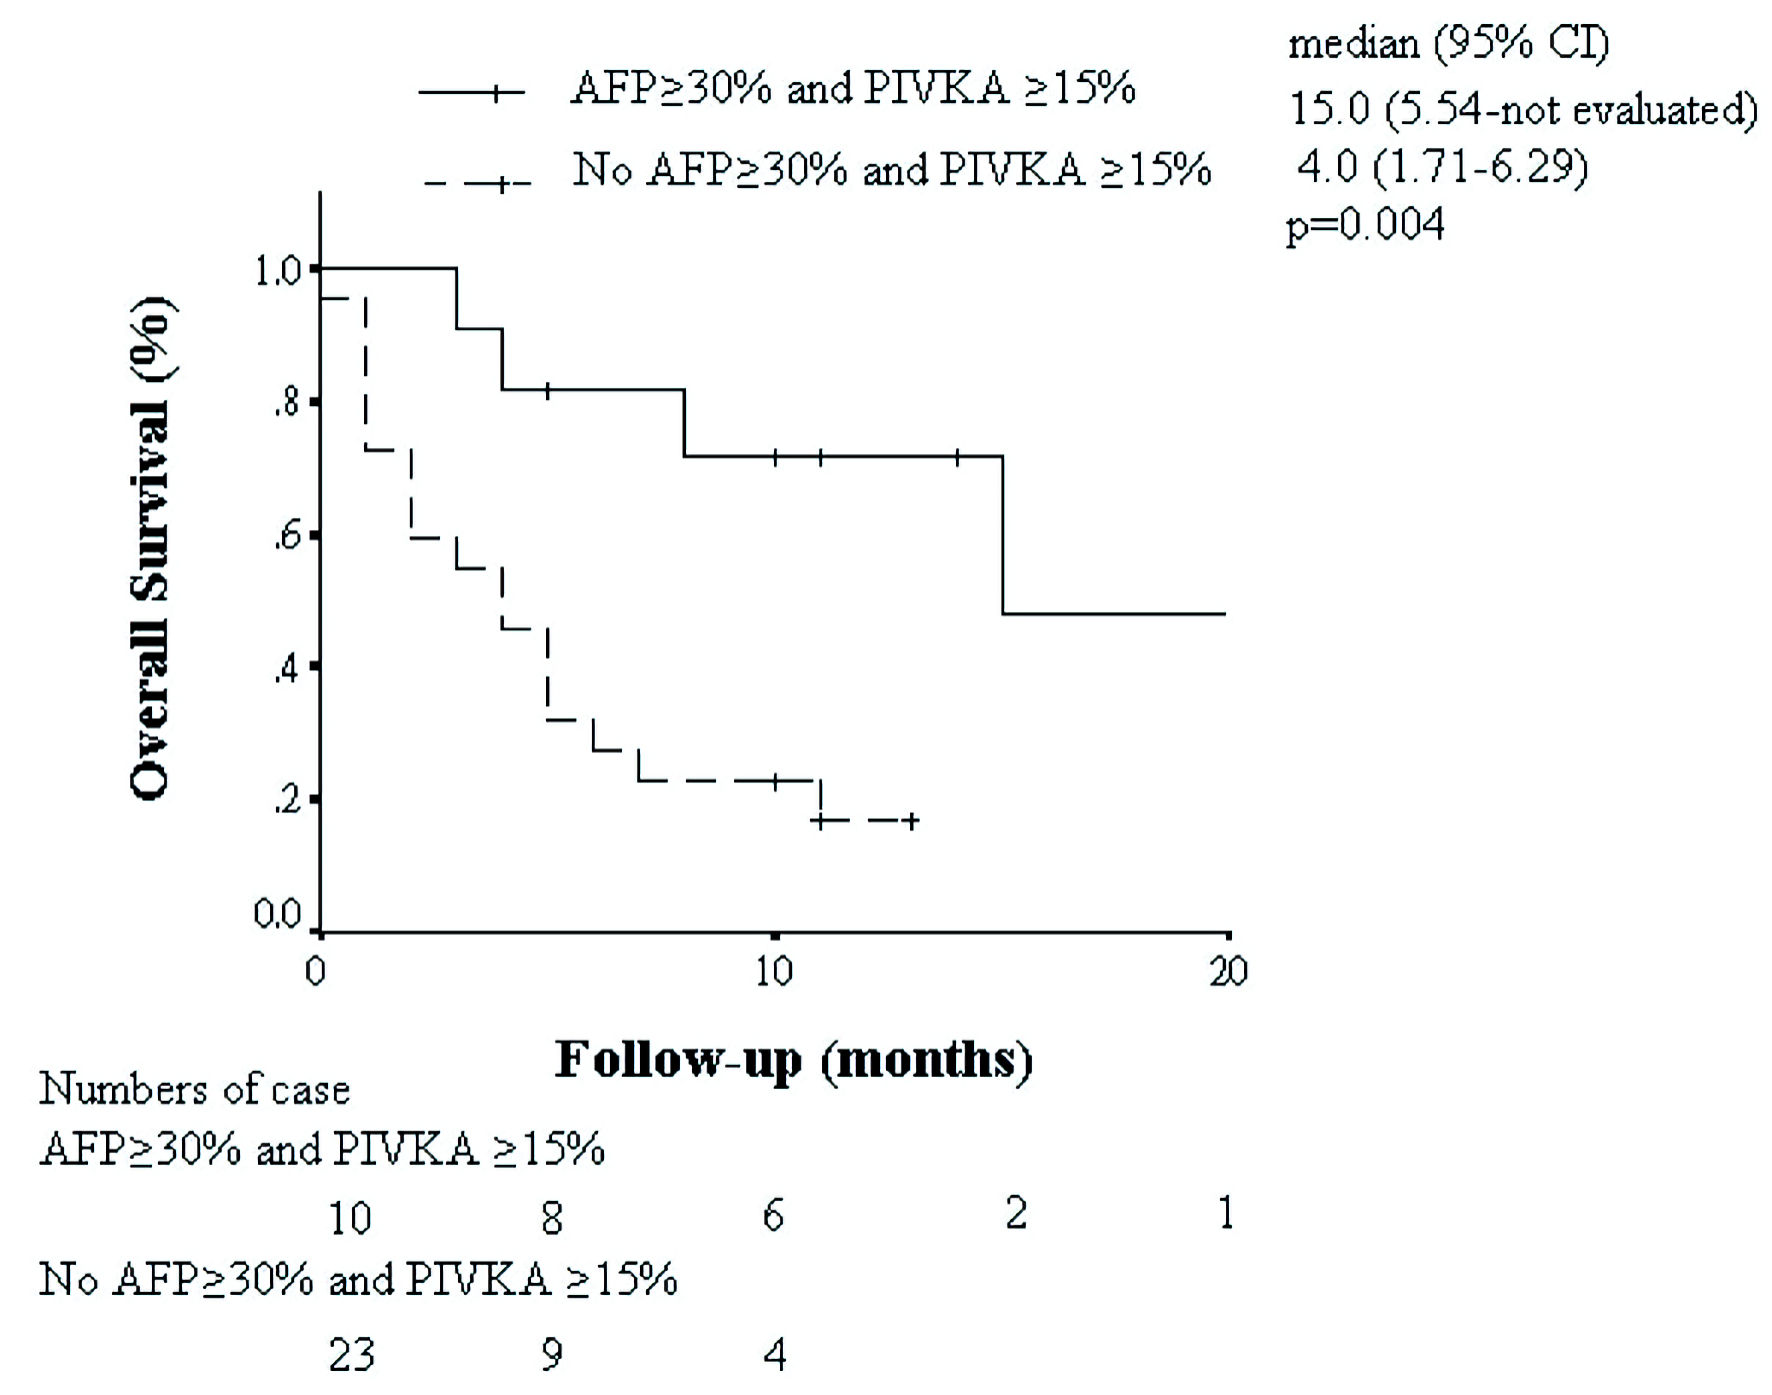
| AFP ≥ 30% and PIVKA-II decline ≥ 15% (yes vs. no) | 0.21 (0.06 - 0.73) | 0.014 |