Figures
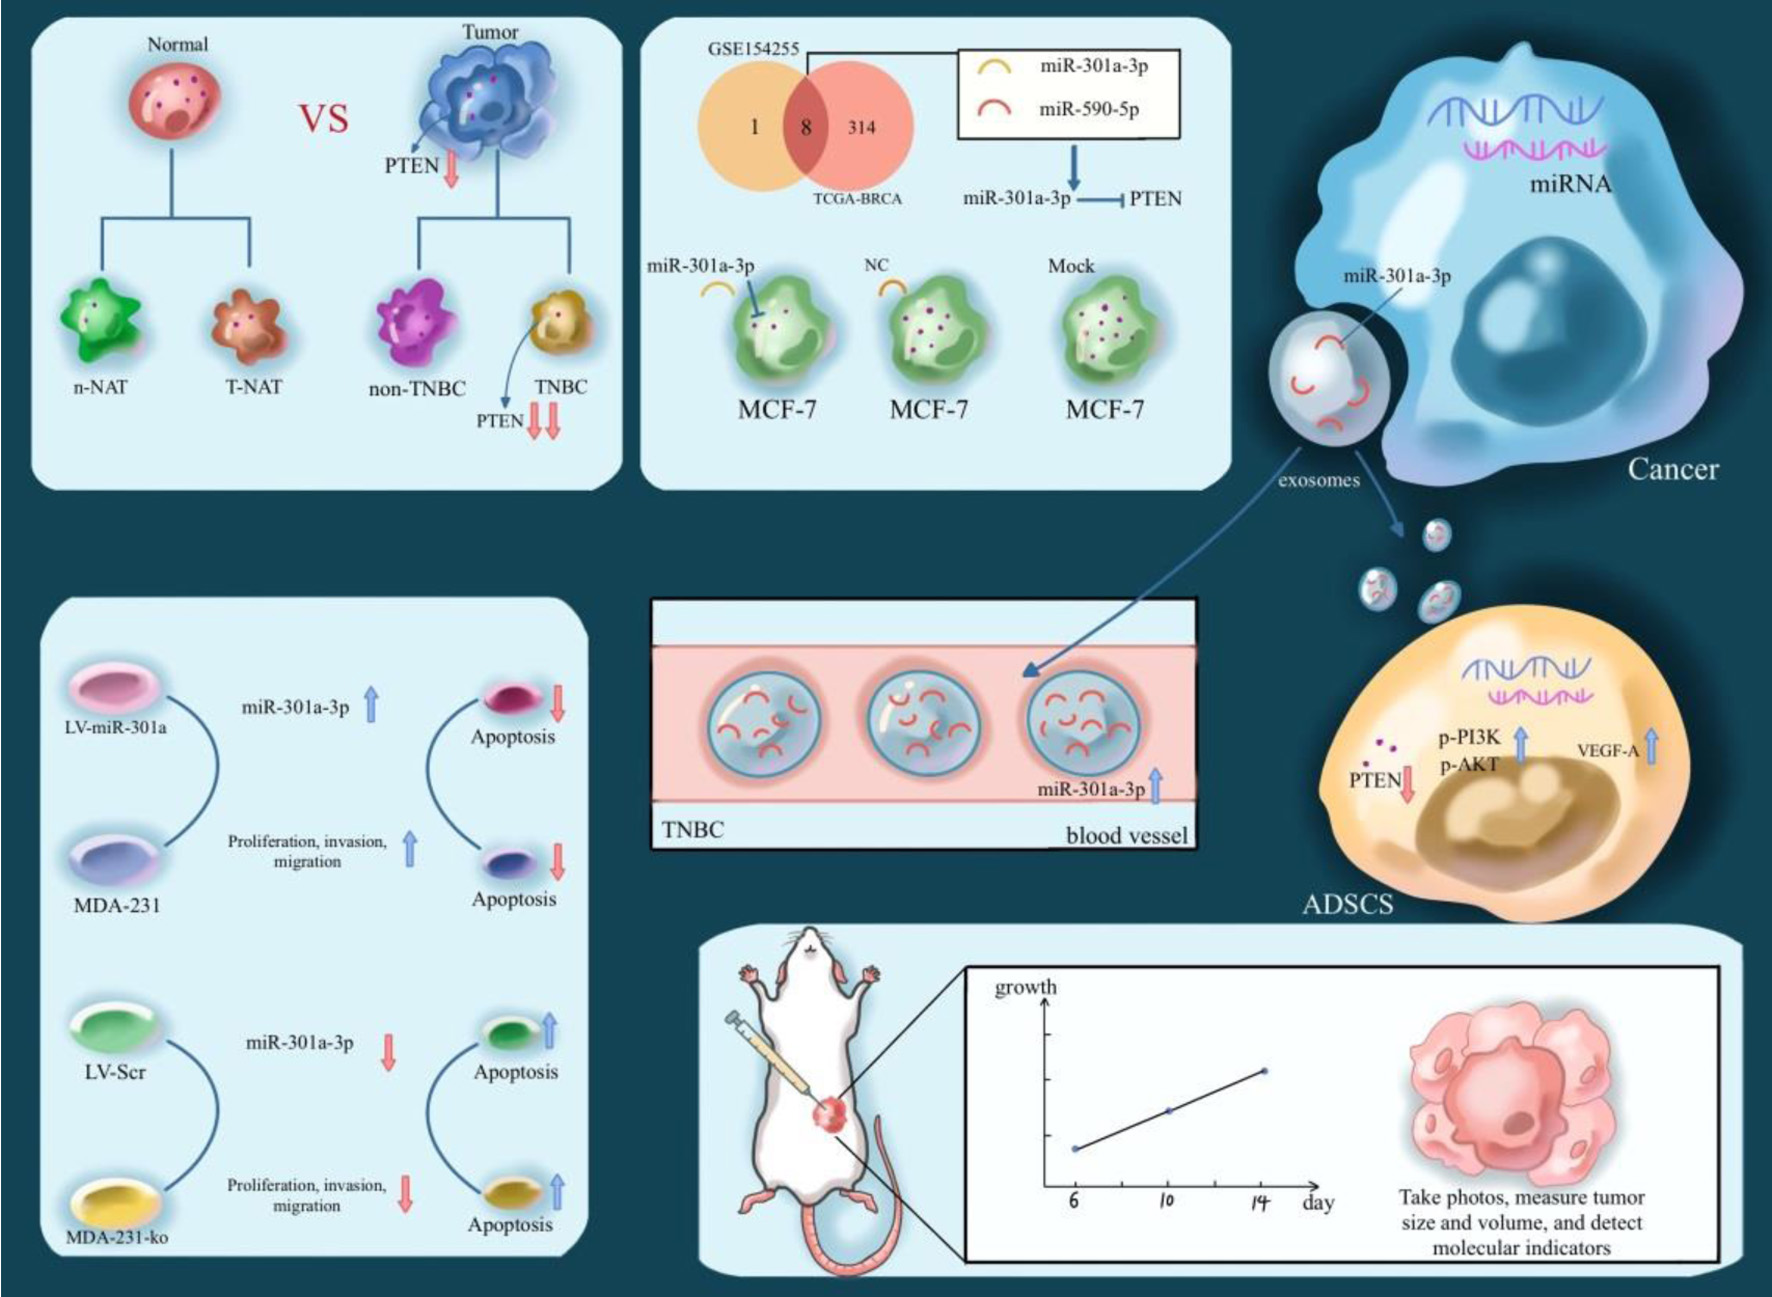
↓ Figure 1. Illustration of the expression level
and biological effects of PTEN in TNBC. TNBC: triple-negative breast cancer.
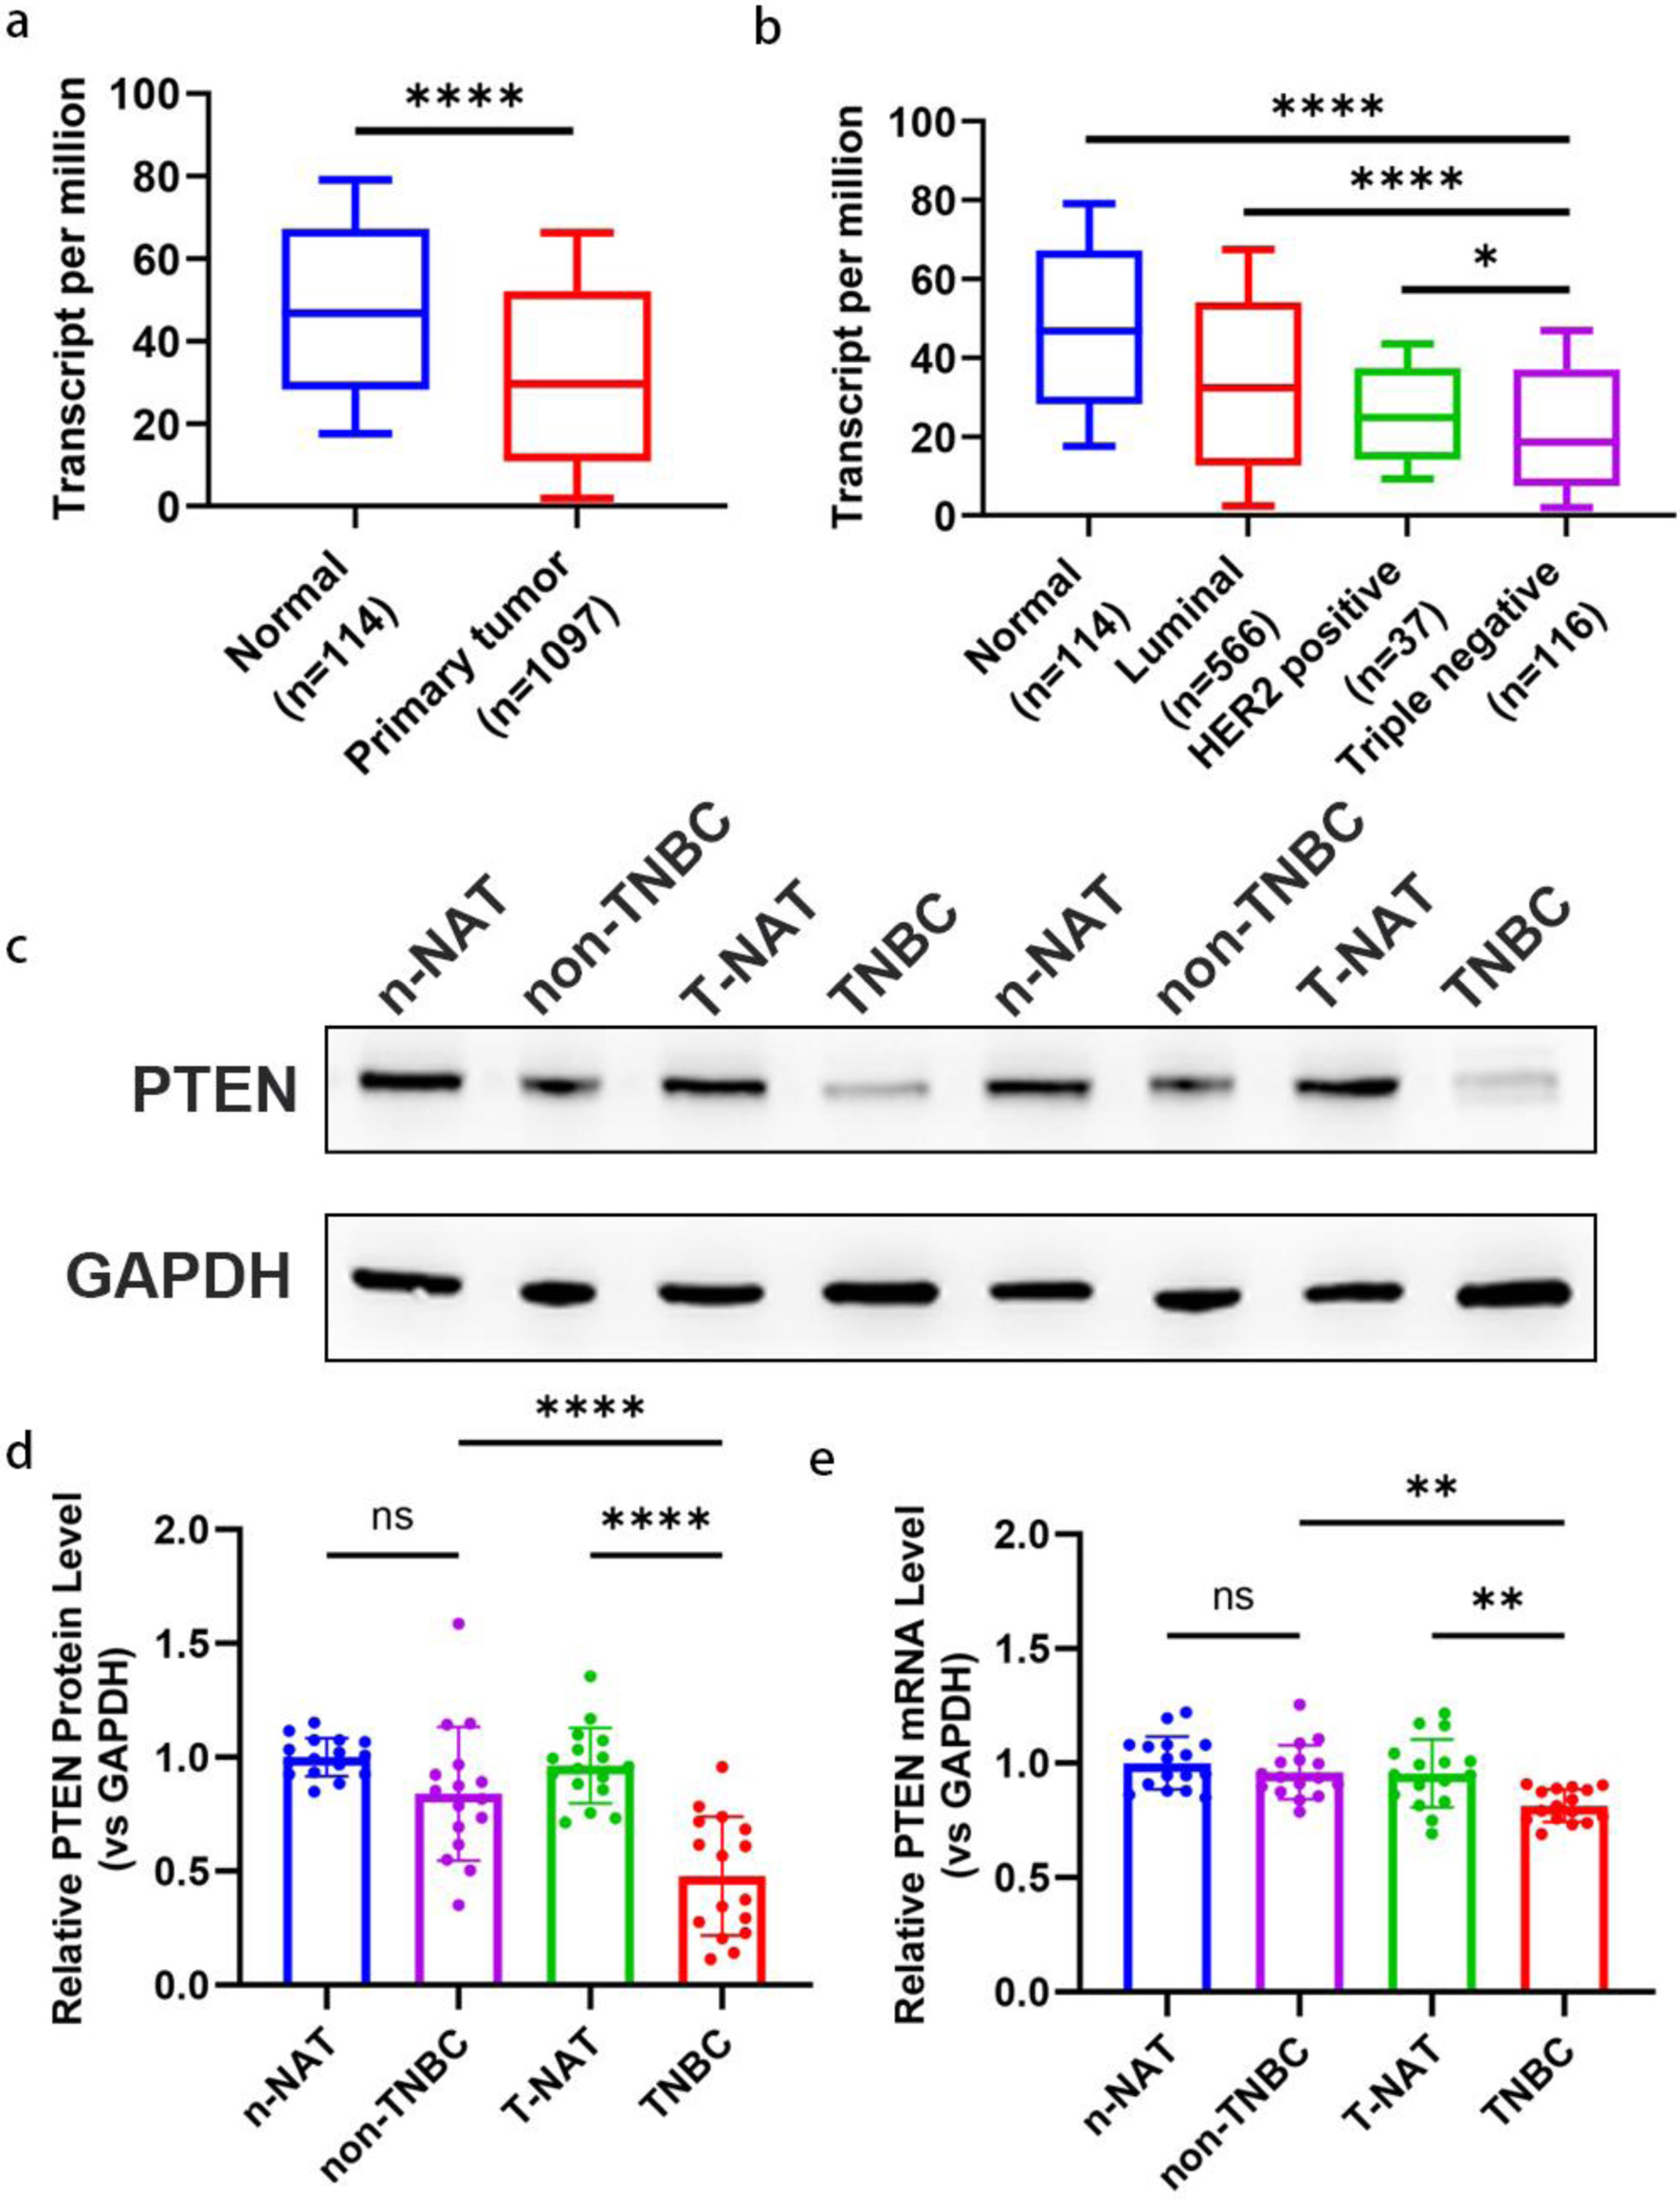
↓ Figure 2. Downregulation of PTEN expression in
TNBC tissues. (a) The expression level of PTEN mRNA in 1097 breast tumor tissues and 114 normal breast
tissues based on the TCGA database. A significant downregulation of PTEN mRNA is observed in tumor
tissues compared to normal tissues. (b) Transcript levels of PTEN mRNA were compared across different
breast cancer subtypes (luminal, HER2-positive, TNBC) and normal breast tissues using TCGA data. Sample
sizes for each group are as follows: Luminal (n = 566), HER2-positive (n = 67), TNBC (n = 116), and
normal tissues (n = 114). TNBC tissues display the lowest PTEN mRNA expression compared to other
subtypes and normal tissues. (c, d) Representative Western blot images (c) and corresponding
densitometric quantification (d) of PTEN protein expression in 34 pairs of breast cancer tumor tissues
and their matched adjacent normal tissues. Protein levels were normalized to β-actin as a loading
control. (e) PTEN mRNA expression levels were quantified in the same 34 pairs of breast cancer tumor
tissues and corresponding normal adjacent tissues using qRT-PCR. Expression levels were normalized to
GAPDH as an internal control and are presented as relative fold change. HER-2: human epidermal growth
factor receptor 2; qRT-PCR: quantitative real-time polymerase chain reaction; TCGA: The Cancer Genome
Atlas; TNBC: triple-negative breast cancer.
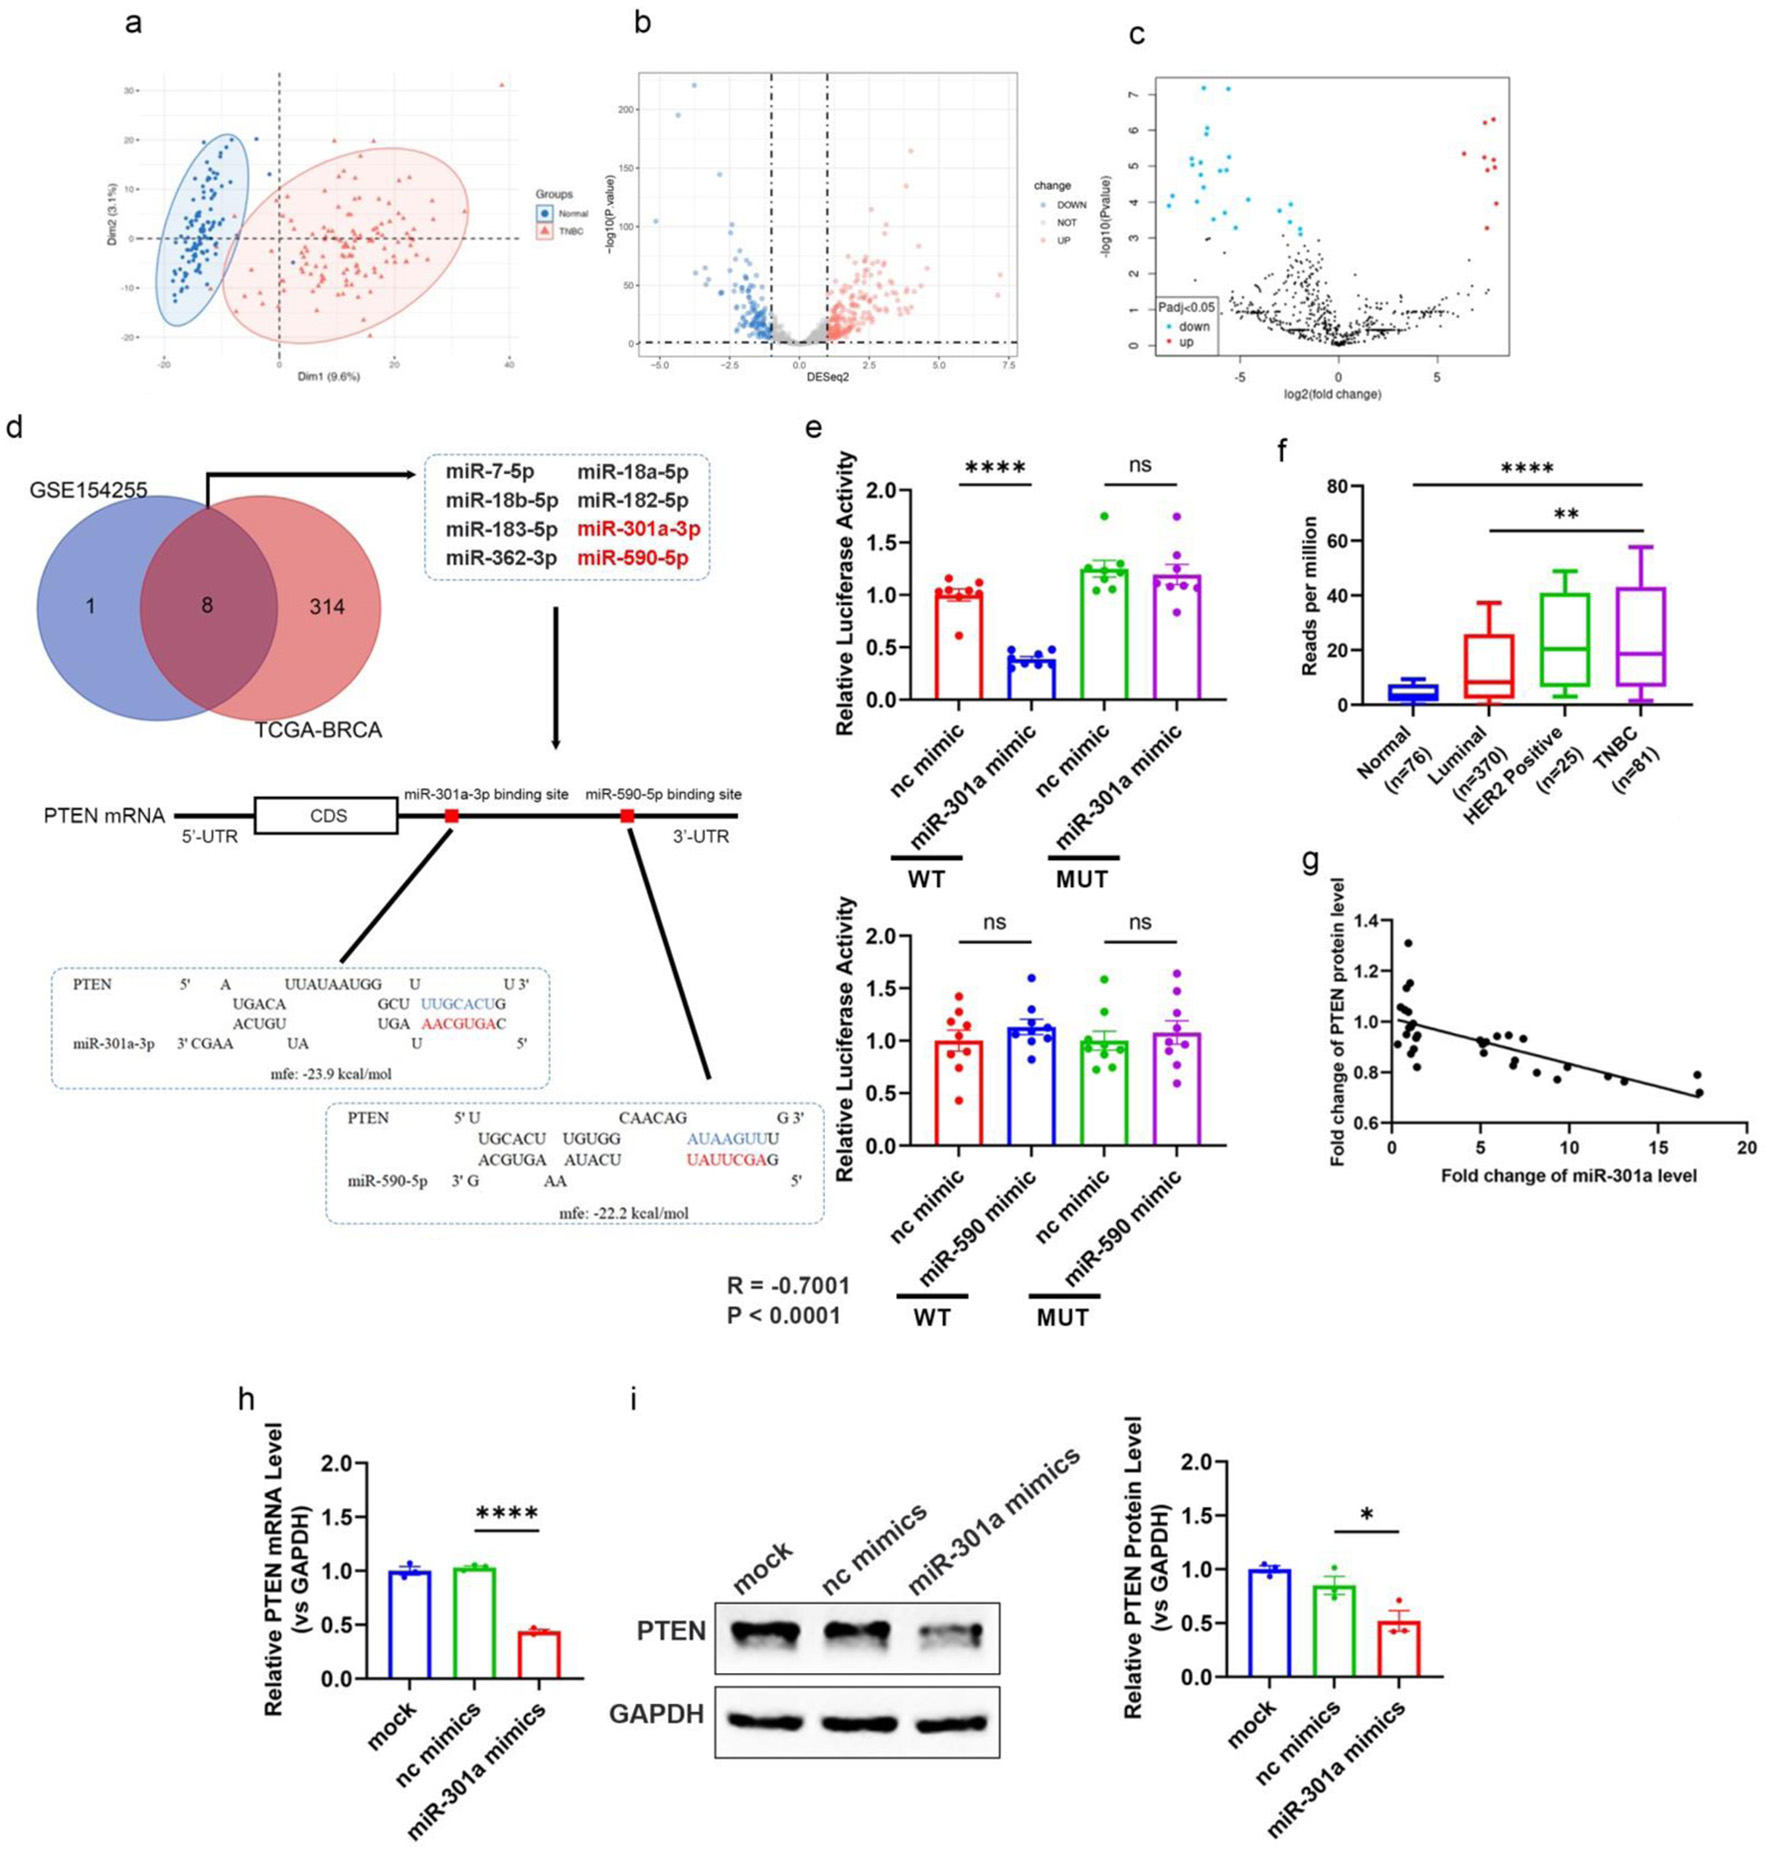
↓ Figure 3. Elevated miR-301a-3p in TNBC
directly targets PTEN, contributing to tumor progression. (a) PCA plot showing the distinct clustering
of miRNA expression profiles from TNBC tissue samples (n = 116) and normal breast tissue samples (n =
114) within the TCGA-BRCA cohort. The separation indicates significant differences in miRNA expression
patterns between TNBC and normal tissues. (b, c) Volcano plots highlighting differentially expressed
miRNAs between TNBC and normal breast tissues from two datasets: (b) TCGA-BRCA cohort and (c) GEO
database dataset GSE154255. Each dot represents a miRNA, with red indicating upregulation and blue
indicating downregulation (fold change > 2 or < -2, adjusted P < 0.05, log2-transformed data).
miR-301a-3p is marked as significantly upregulated in both datasets. (d) Venn diagram and schematic
showing miRNAs significantly upregulated in both GSE154255 and TCGA-BRCA datasets, with a focus on those
predicted to target the 3’-UTR of PTEN. The schematic illustrates the binding site duplex formed
between the PTEN 3’-UTR and candidate miRNAs, including miR-301a-3p. (e) The luciferase
activities in 293T cells co-transfected with wild type or mutant PTEN 3’-UTR and miRNA or
scramble mimics. (f) The transcript level of miR-301a-3p in different subtypes of breast cancer
(luminal, Her2 positive, TNBC) and normal breast tissues based on the TCGA database. (g)
Pearson’s correlation scatter plot of the fold changes of PTEN mRNA and miR-301a-3p in human TNBC
tissue pairs (n = 18). (h) PTEN mRNA expression in MCF-7 cells after transfection with miR-301a-3p
mimic. (i) Western blot analysis and densitometric analysis showing PTEN protein levels in MCF-7 cells
after transfection with miR-301a-3p mimic. GEO: Gene Expression Omnibus; PCA: principal component
analysis; TCGA: The Cancer Genome Atlas; TNBC: triple-negative breast cancer.
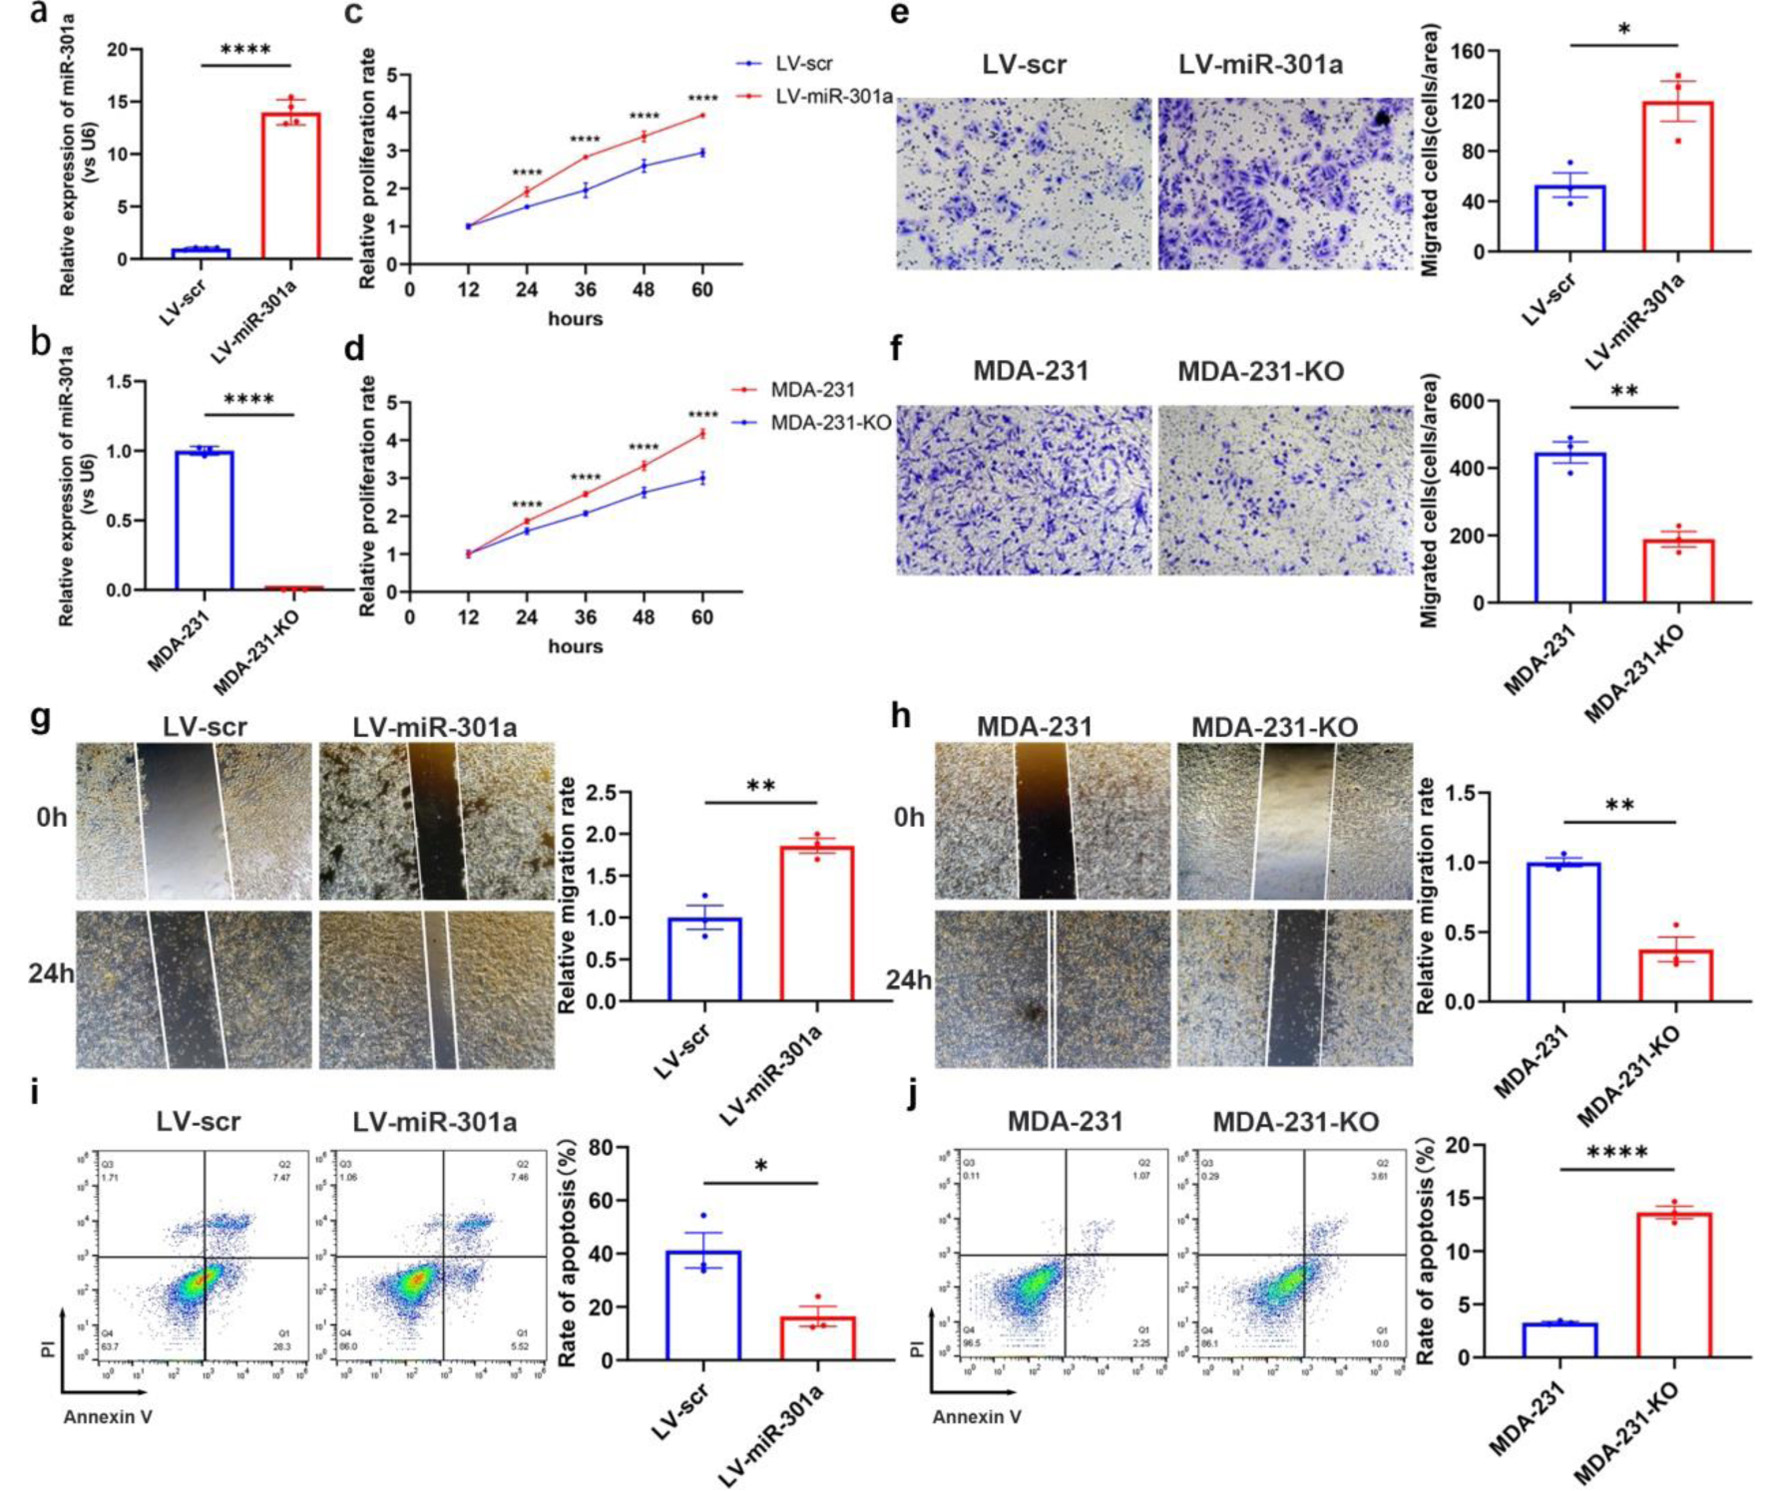
↓ Figure 4. MiR-301a-3p enhances proliferation,
migration and invasion but suppresses apoptosis in breast cancer cells. (a) qRT-PCR analysis confirming
the efficiency of stable miR-301a-3p overexpression in the MCF-7 cell line (LV-miR-301a). (b) qRT-PCR
analysis confirming the knockout efficiency of miR-301a-3p in the MDA-MB-231 cell line (MDA-231-KO). (c)
CCK-8 assay showing the proliferation rate of LV-miR-301a cells compared to LV-scr cells. (d) CCK-8
assay showing the proliferation rate of MDA-231-KO cells compared to MDA-MB-231 cells. (e) Transwell
assay showing the invasion capability of LV-miR-301a cells compared to LV-scr cells. (f) Transwell assay
showing the invasion capability of MDA-231-KO cells compared to MDA-MB-231 cells. (g) Wound healing
assay revealing the migration capability of LV-miR-301a cells compared to LV-scr cells. (h) Wound
healing assay revealing the migration capability of MDA-231-KO cells compared to MDA-MB-231 cells. (i)
Analysis of apoptosis in LV-miR-301a cells and LV-scr cells. (j) Analysis of apoptosis in MDA-231-KO
cells and MDA-MB-231 cells. Left panel: representative image; Right panel: quantitative analysis. CCK-8:
cell counting kit-8; qRT-PCR: quantitative real-time polymerase chain reaction.
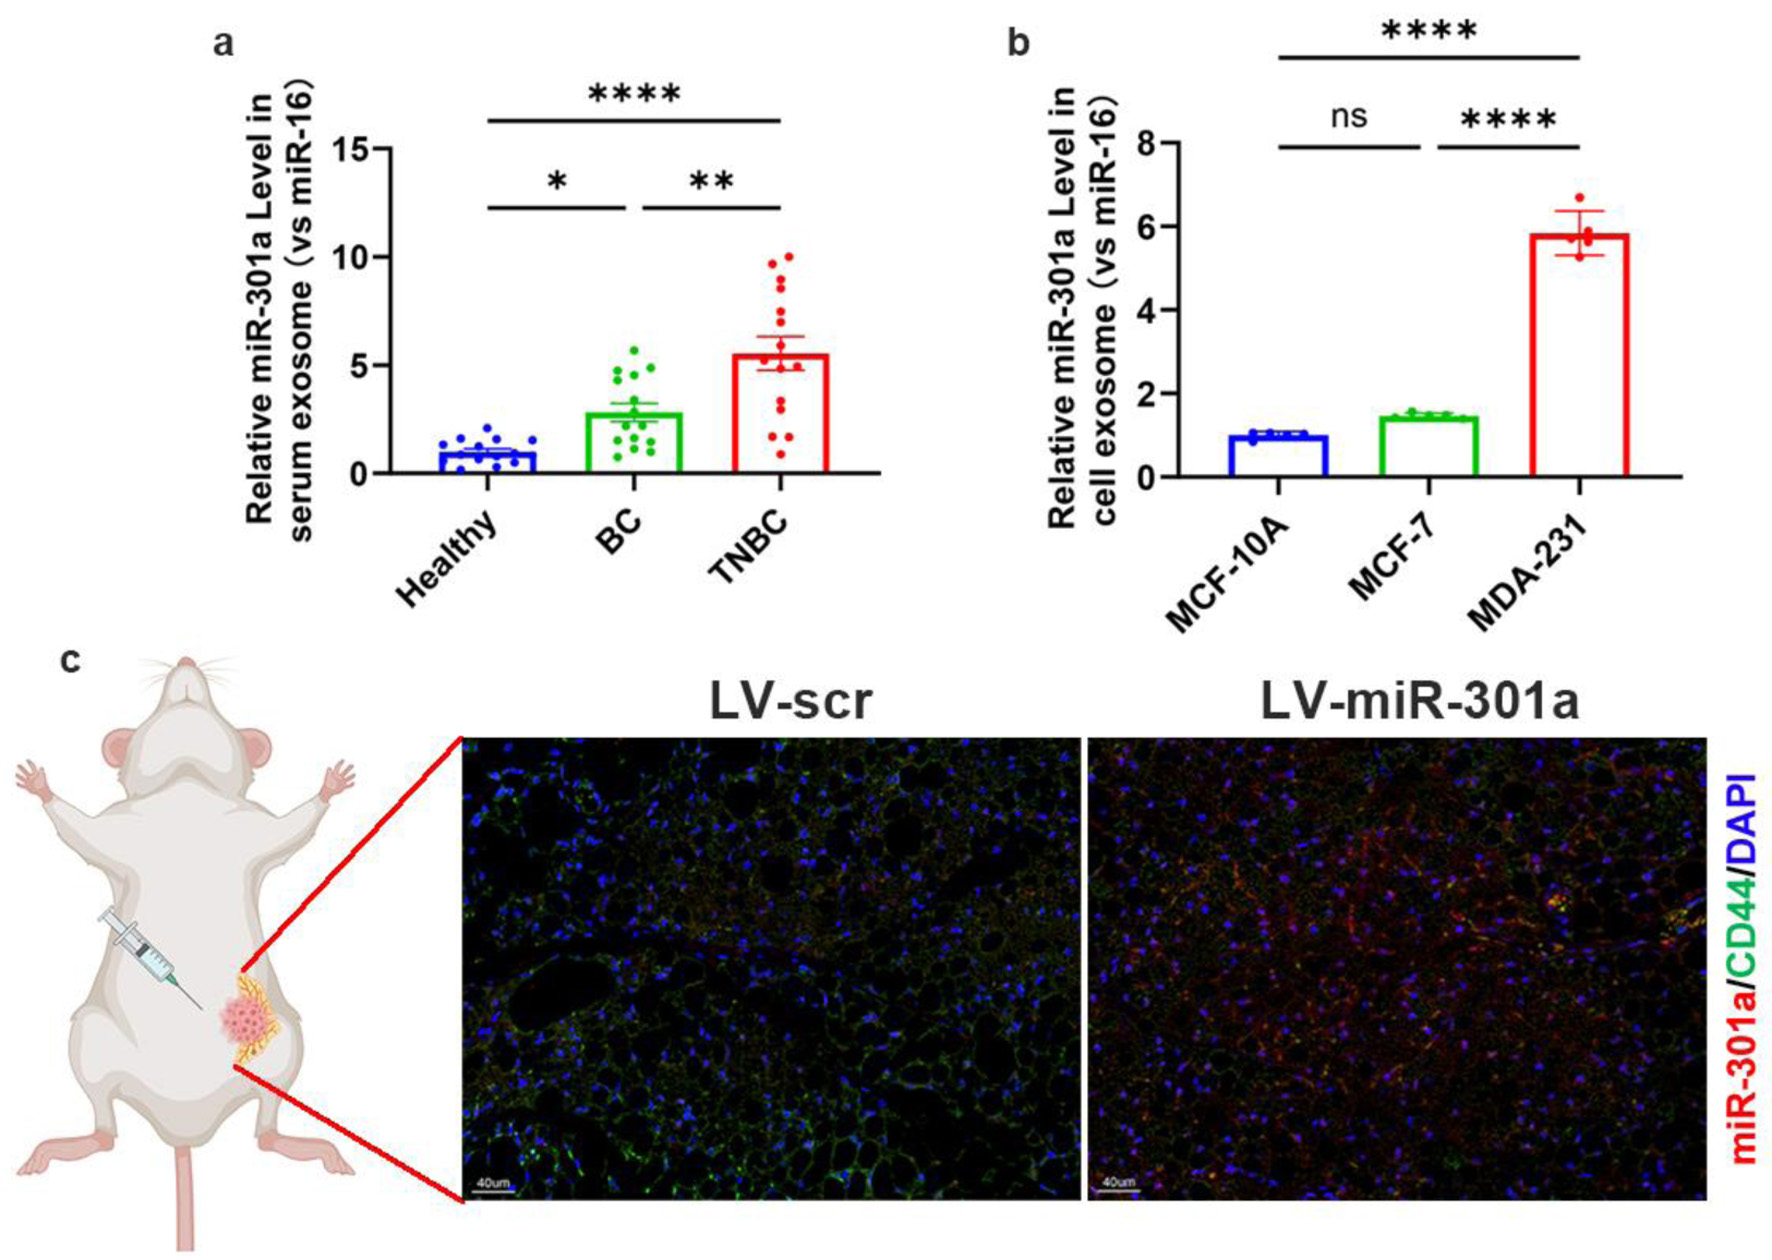
↓ Figure 5. TNBC exosomes deliver upregulated
miR-301a-3p to peritumoral ADSCs. (a) Quantification of miR-301a-3p levels in serum-derived exosomes
from healthy donors, non-TNBC patients, and TNBC patients. (b) qRT-PCR analysis of relative miR-301a-3p
expression in exosomes derived from MDA-MB-231, MCF-7, and MCF-10A cell lines. (c) In situ
hybridization for miR-301a-3p and immunofluorescence for CD44 in peritumoral tissues from orthotopic
tumor models. ADSCs: adipose-derived stem cells; qRT-PCR: quantitative real-time polymerase chain
reaction; TNBC: triple-negative breast cancer.
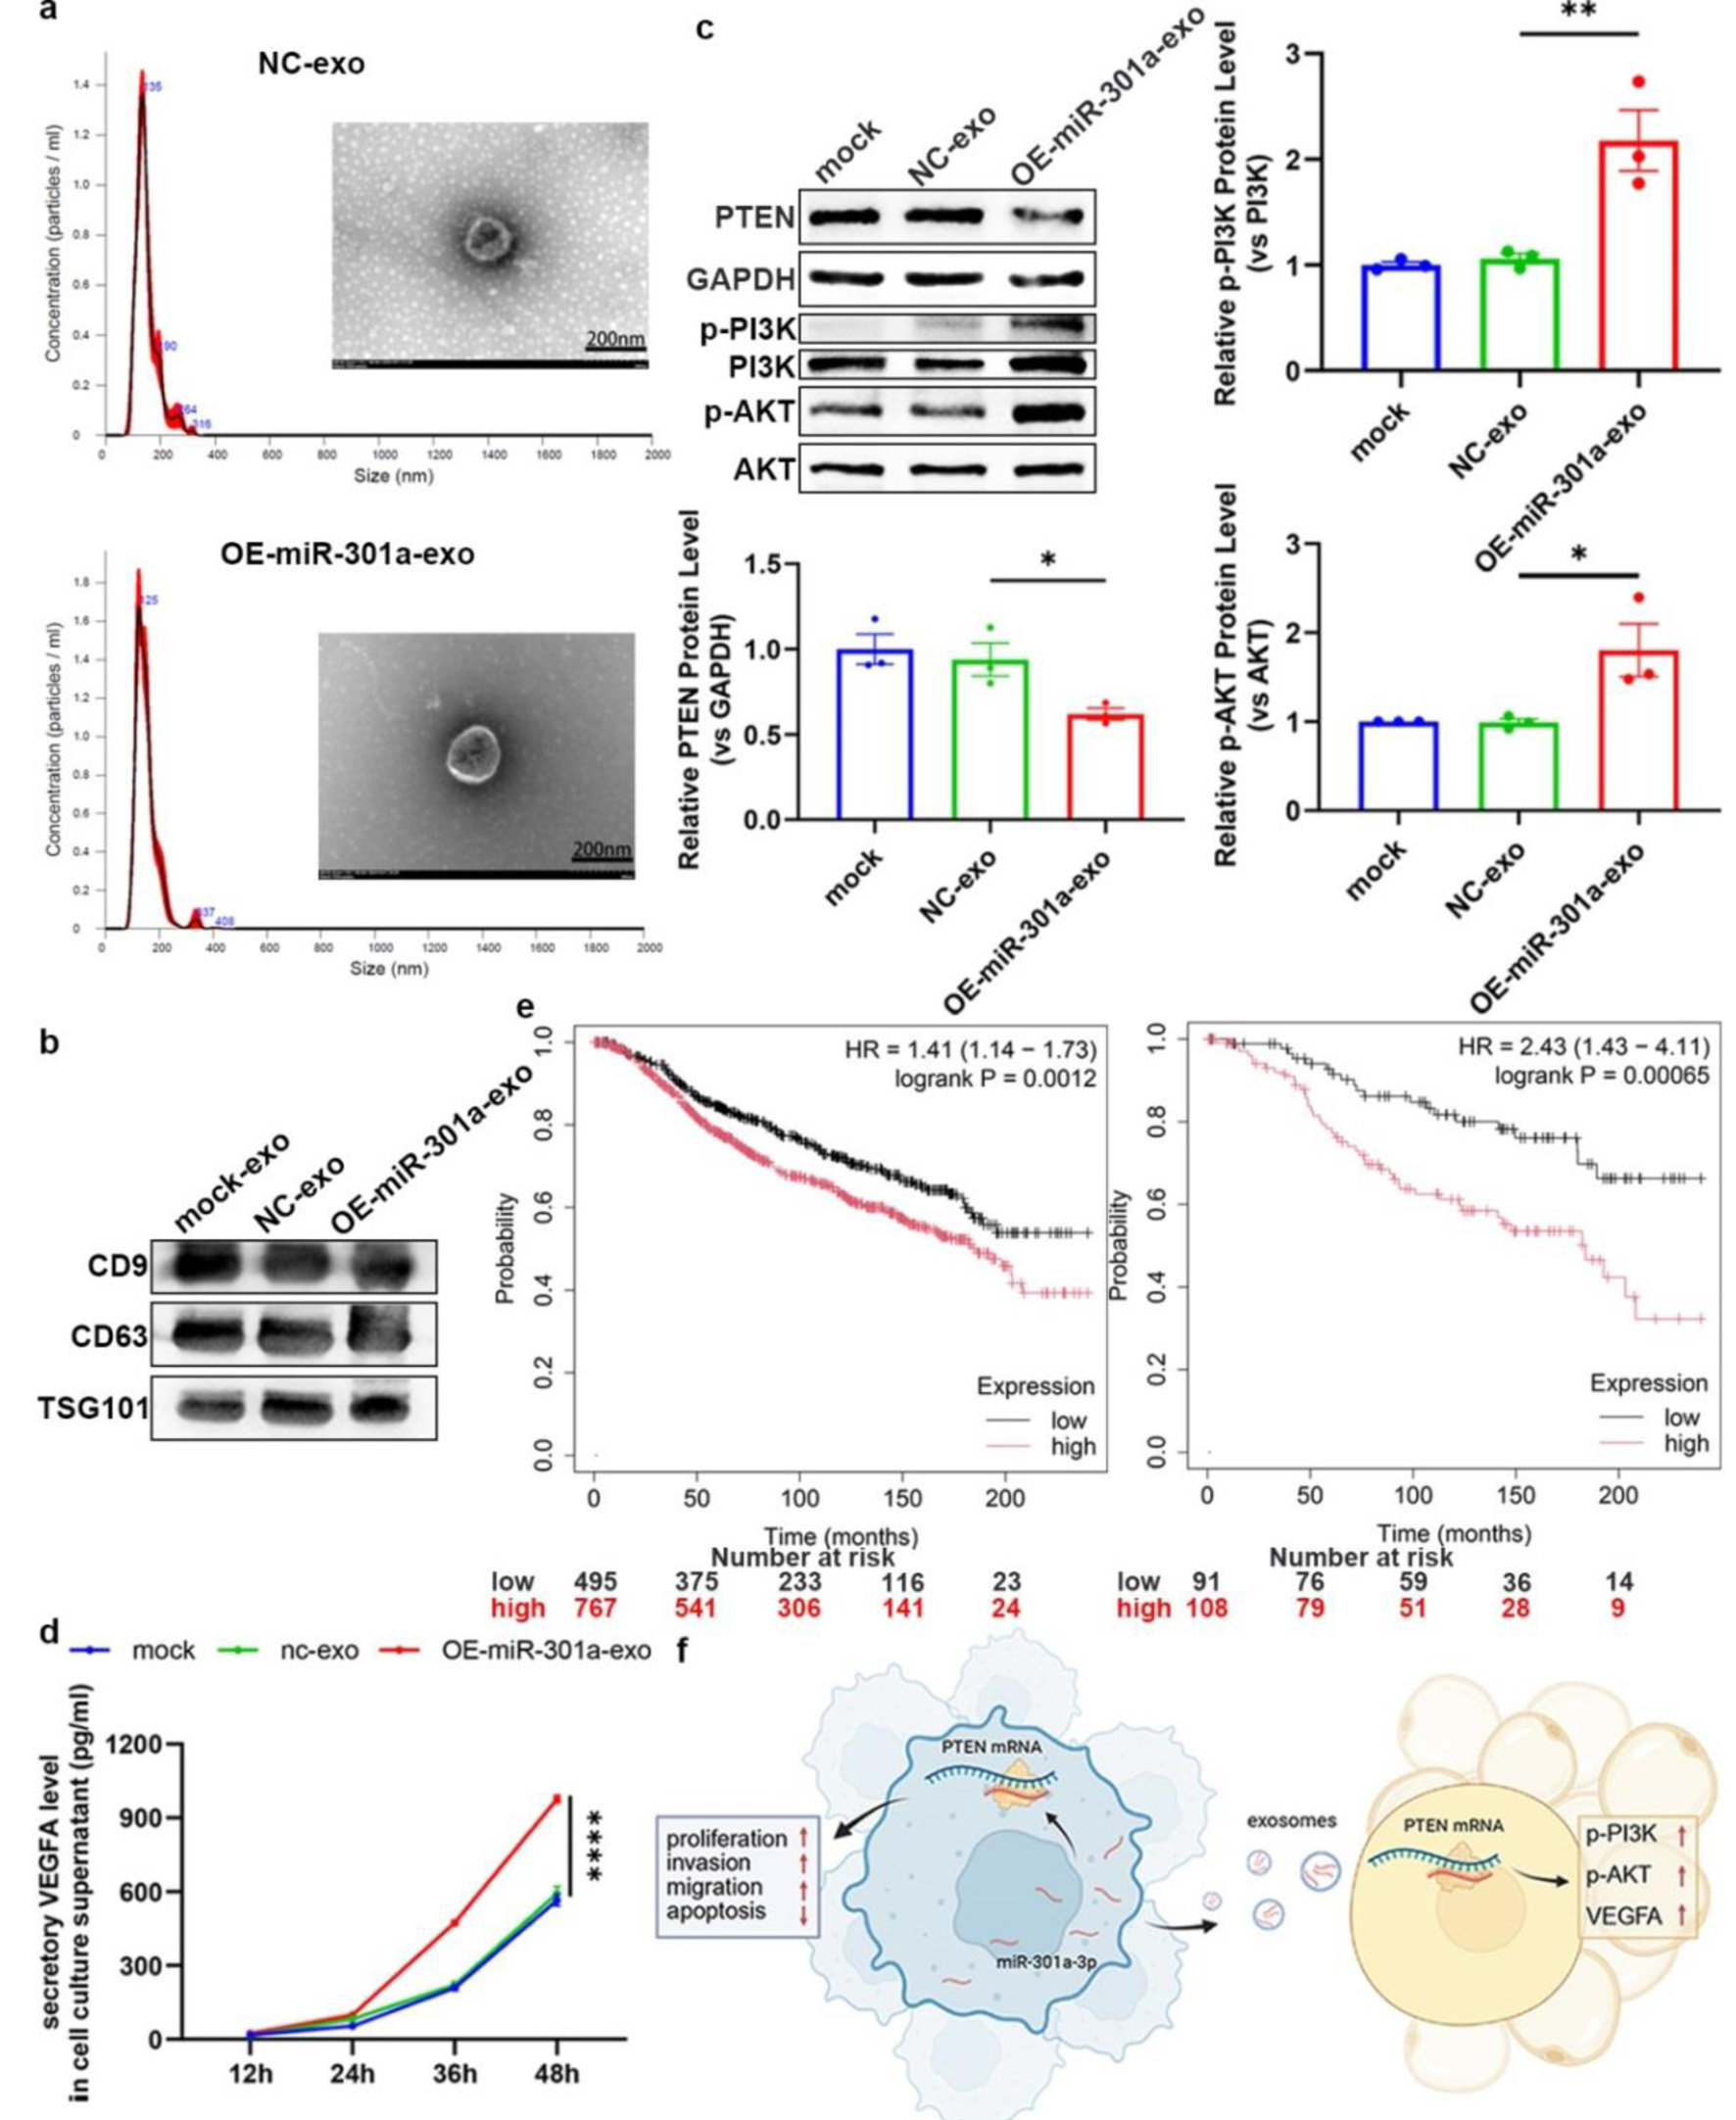
↓ Figure 6. Exosomal miR-301a-3p from TNBC cells
modulates the TME through regulating the PTEN/PI3K/AKT pathway in ADSC. (a) DLS analysis showing the
size distribution of exosomes isolated from the culture medium of LV-301a or LV-scr cells. TEM image
showing the typical cup-shaped morphology of isolated exosomes. (b) Western blot analysis of exosomal
protein markers (e.g., CD9, CD63, TSG101). (c) Representative western blot and densitometric analysis of
PTEN protein levels in ADSCs following treatment with exosomes from miR-301a-3p-overexpressing cells
(OE-exosomes) or control cells (NC-exosomes). (d) ELISA for VEGFA in the culture medium of ADSCs
following treatment with OE-exosomes or NC-exosomes. (e) Kaplan-Meier survival analysis of all (left
panel) and untreated (right panel) breast cancer patients from the TCGA database, stratified by high
versus low miR-301a-3p expression. (f) Schematic model illustrating the proposed mechanism of exosomal
miR-301a-3p transfer and its downstream signaling. ADSC: adipose-derived stem cell; DLS: dynamic light
scattering; ELISA: enzyme-linked immunosorbent assay; TCGA: The Cancer Genome Atlas; TEM: transmission
electron microscopy; TME: tumor microenvironment; TNBC: triple-negative breast cancer; VEGFA: vascular
endothelial growth factor A.
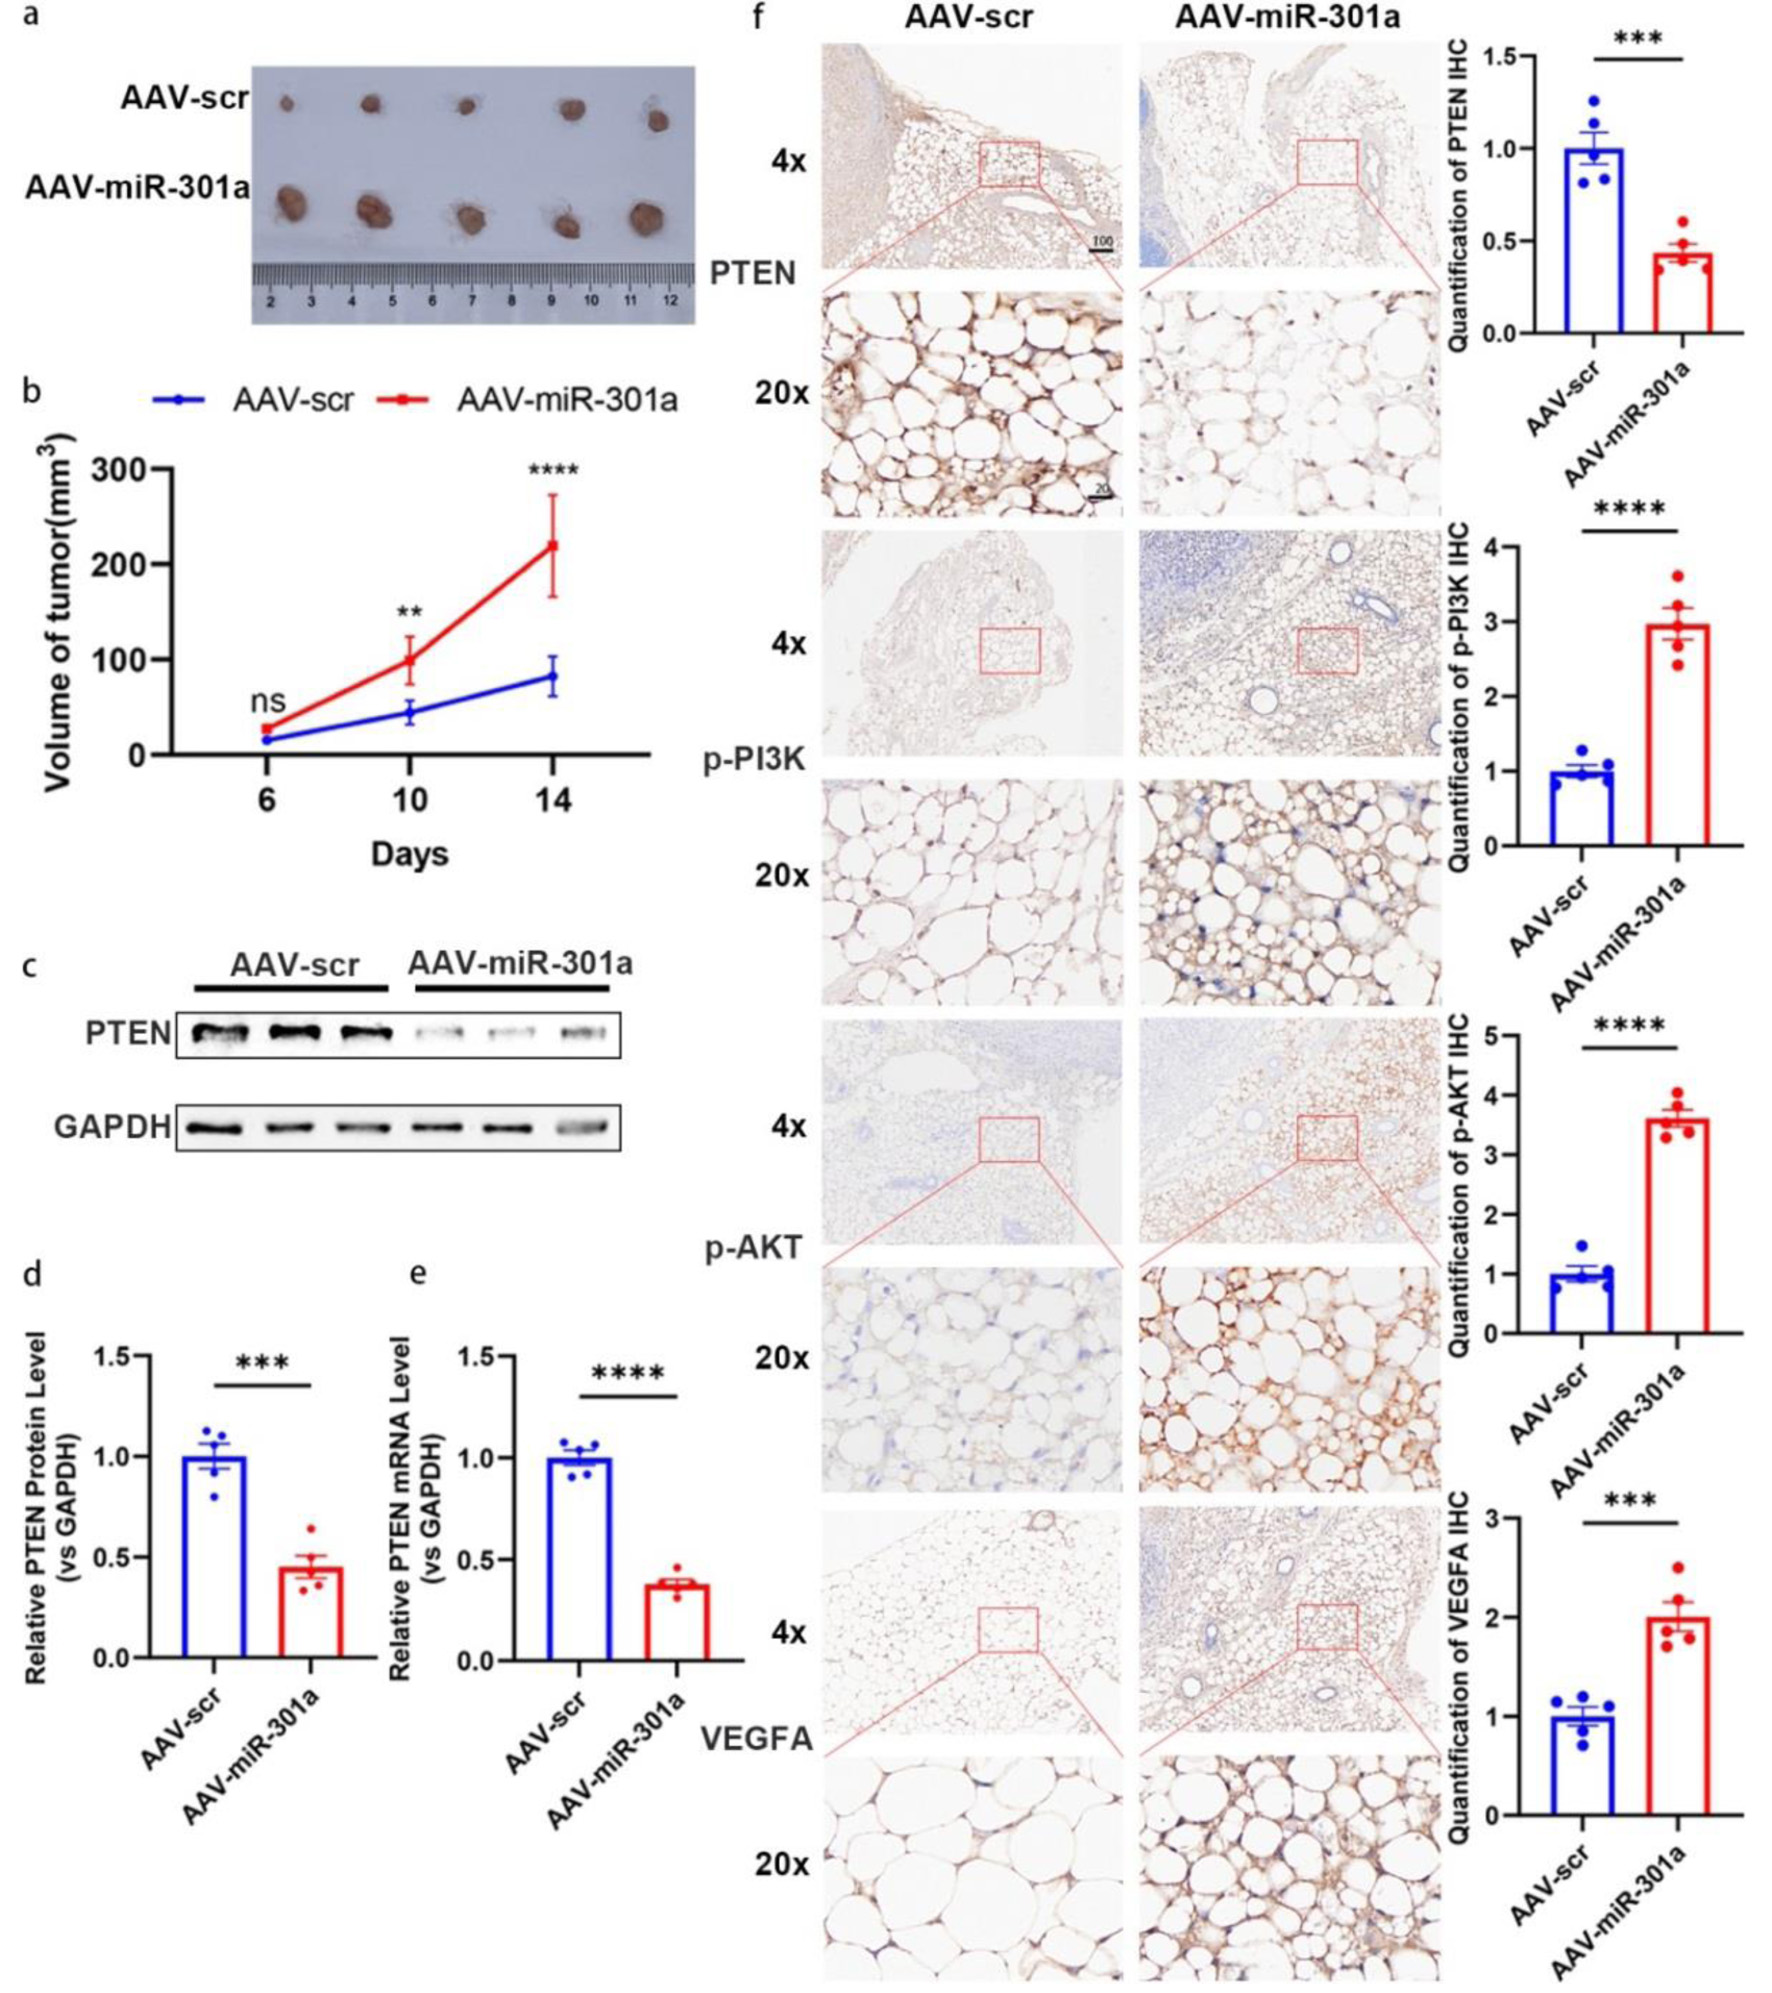
↓ Figure 7. MiR-301a-3p promotes tumor growth
in vivo. (a, b) Orthotopic MCF-7 mouse models (n = 6 per group) were subjected to intra-tumoral
injection with adeno-associated virus expressing miR-301a-3p (AAV-miR-301a) or scramble control
(AAV-scr). Tumor volumes were measured for 14 days post-injection. (a) Representative photographs of
excised tumors from each group at the endpoint (day 14). (b) Tumor growth curves depicting the volume of
tumors (measured in mm3) over time in, and data are presented as mean ± SEM, showing
significantly enhanced growth in the AAV-miR-301a group compared to AAV-scr. (c, d) PTEN expression
analysis in tumor tissues: Representative Western blot images (c) and densitometric quantification (d)
of PTEN protein levels in tumor tissues harvested from mice treated with AAV-miR-301a or AAV-scr (n = 5
per group). Protein expression is normalized to β-actin as a loading control and presented as
relative expression (mean ± SEM), showing a significant reduction in PTEN protein in the
AAV-miR-301a group compared to AAV-scr. (e) qRT-PCR analysis of PTEN mRNA levels in the same tumor
tissues, normalized to GAPDH as an internal control and presented as relative fold change (mean ±
SEM, n = 5 per group), demonstrating significant downregulation in the AAV-miR-301a group compared to
AAV-scr. (f) Representative IHC images showing staining for PTEN, phosphorylated PI3K (p-PI3K),
phosphorylated AKT (p-AKT), and VEGFA in peritumoral adipose tissues from mice treated with AAV-miR-301a
or AAV-scr (n = 5 per group). Staining intensity was quantified using ImageJ software, with data
indicating decreased PTEN expression and increased p-PI3K, p-AKT, and VEGFA expression in the
AAV-miR-301a group compared to AAV-scr. Scale bars represent 50 µm. IHC: immunohistochemistry;
qRT-PCR: quantitative real-time polymerase chain reaction; SEM: standard error of the mean; VEGFA:
vascular endothelial growth factor A.
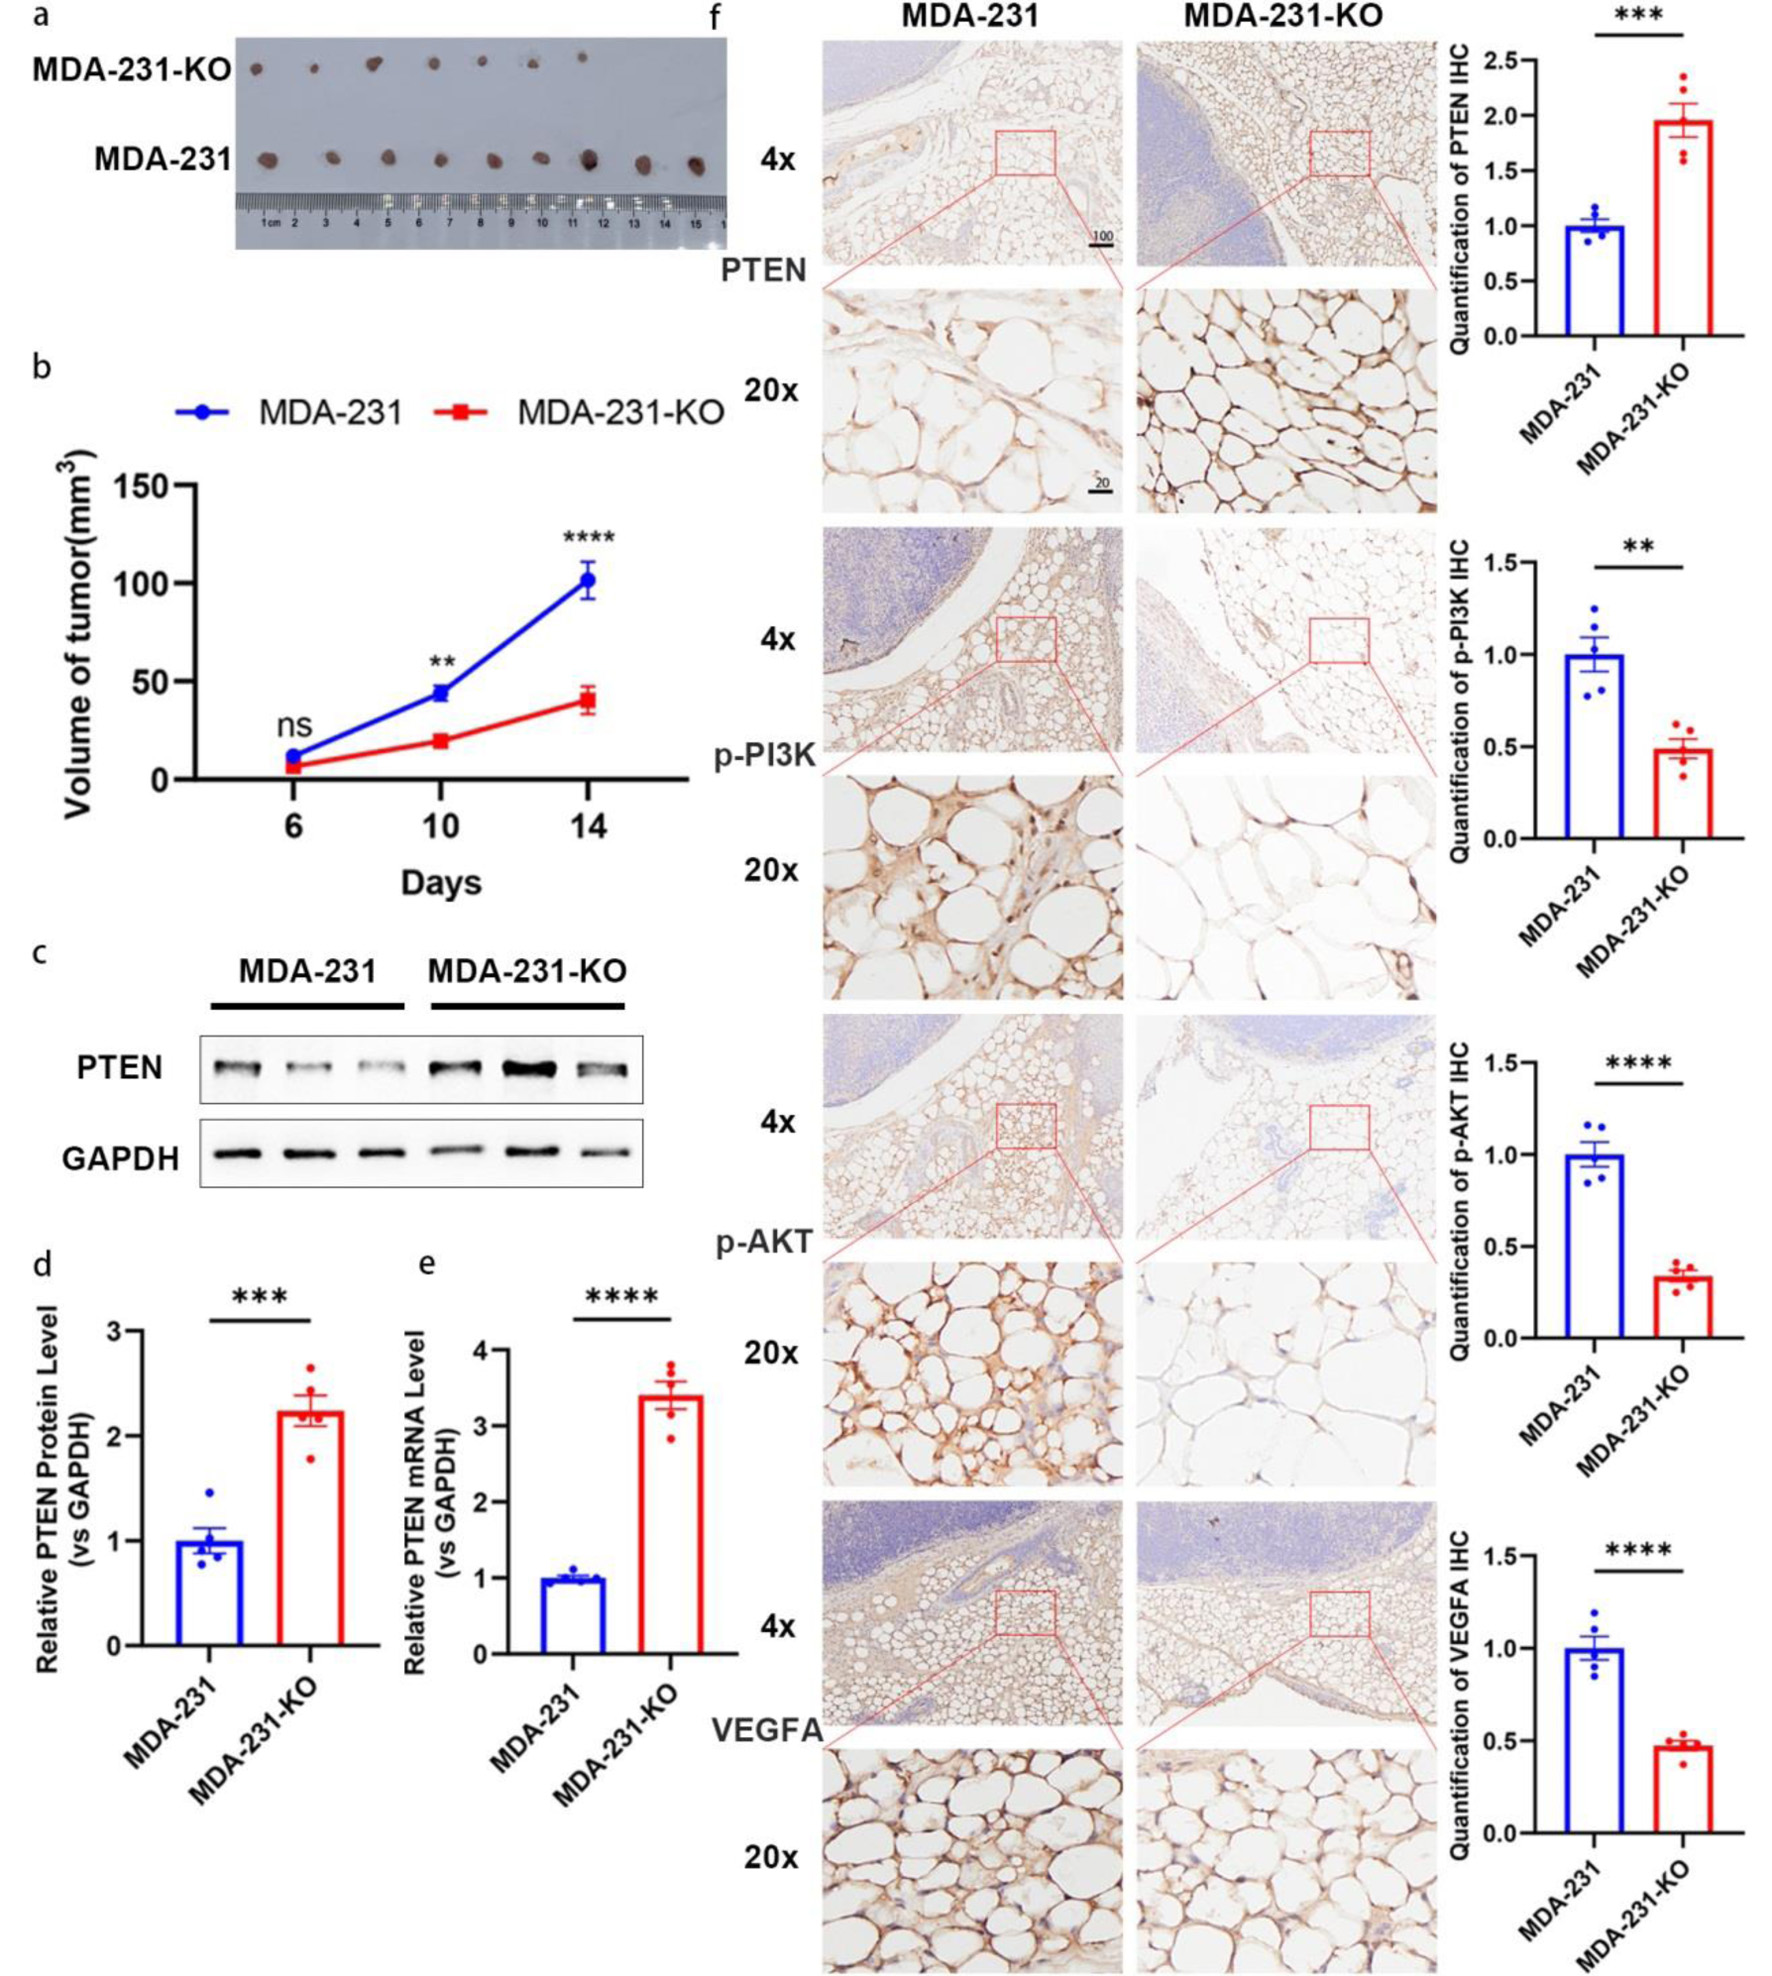
↓ Figure 8. Depletion of miR-301a-3p inhibits
tumor growth in vivo. (a, b) Tumor growth curves and representative images of tumors from an
orthotopic mouse model established with MDA-MB-231 (MDA-231) or miR-301a-3p knockout (MDA-231-KO) cells.
(a) Representative photographs of excised tumors from each group at the endpoint (day 14). (b) Tumor
growth curves depicting the volume of tumors (measured in mm3) over time in, and data are
presented as mean ± SEM, showing significantly enhanced growth in the MDA-231 group compared to
MDA-231-KO group. (c, d) PTEN expression analysis in tumor tissues: representative Western blot images
(c) and densitometric quantification (d) of PTEN protein levels in tumor tissues harvested from mice
implanted with MDA-231 or MDA-231-KO cells (n = 5 per group). Protein expression is normalized to
β-actin as a loading control and presented as relative expression (mean ± SEM), showing a
significant increase in PTEN protein in the MDA-231-KO group compared to MDA-231. (e) qRT-PCR analysis
of PTEN mRNA levels in the same tumor tissues, normalized to GAPDH as an internal control and presented
as relative fold change (mean ± SEM, n = 5 per group), demonstrating significant upregulation in
the MDA-231-KO group compared to MDA-231. (f) Representative IHC images showing staining for PTEN,
p-PI3K, p-AKT, and VEGFA in peritumoral adipose tissues from mice implanted with MDA-231 or MDA-231-KO
cells (n = 5 per group). Staining intensity was quantified using ImageJ software, with data indicating
increased PTEN expression and decreased p-PI3K, p-AKT, and VEGFA expression in the MDA-231-KO group
compared to MDA-231 group. Scale bars represent 50 µm. IHC: immunohistochemistry; qRT-PCR:
quantitative real-time polymerase chain reaction; SEM: standard error of the mean; VEGFA: vascular
endothelial growth factor A.