Figures
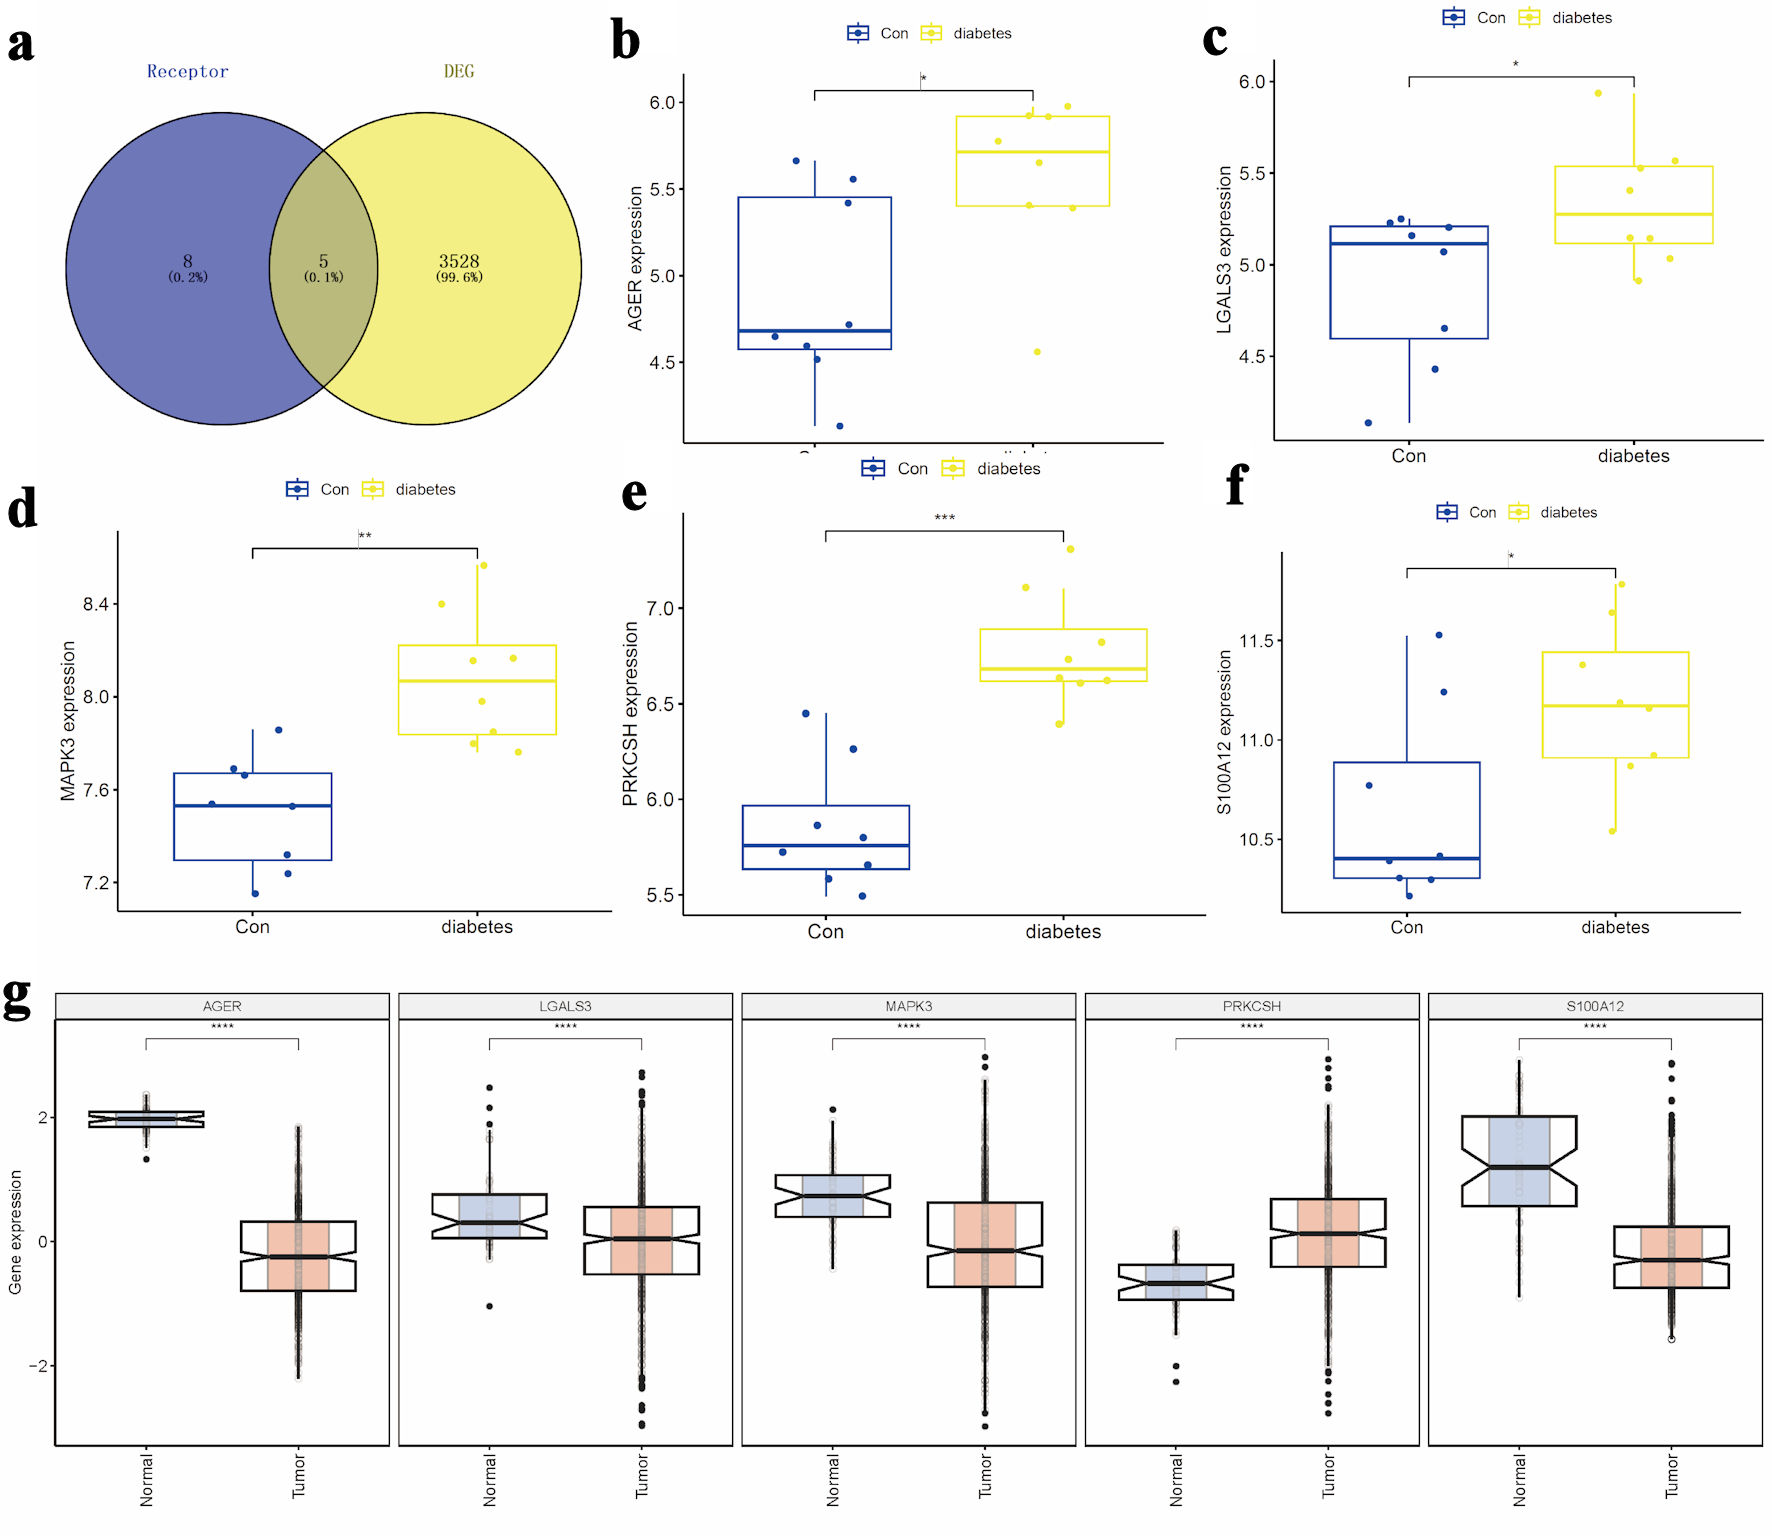
↓ Figure 1. Selection of candidate target genes.
(a) Intersection of DEGs from the GSE15932 diabetes dataset with genes related to the advanced
glycosylation end product receptor. (b–d) Comparative expression analysis of S100A12,
AGER, and PRKCSH between diabetic and control groups. (e, f) Expression profiles of
MAPK3 and LGALS3 across the study cohorts. (g) Differential expression patterns of
S100A12, AGER, PRKCSH, MAPK3, and LGALS3 in LUAD tissues compared to
adjacent non-tumorous and normal lung tissues. AGER: advanced glycosylation end-product-specific
receptor; DEGs: differentially expressed genes; LGALS3: galectin-3; LUAD: lung adenocarcinoma; MAPK3:
mitogen-activated protein kinase 3; PRKCSH: protein kinase C substrate 80K-H.
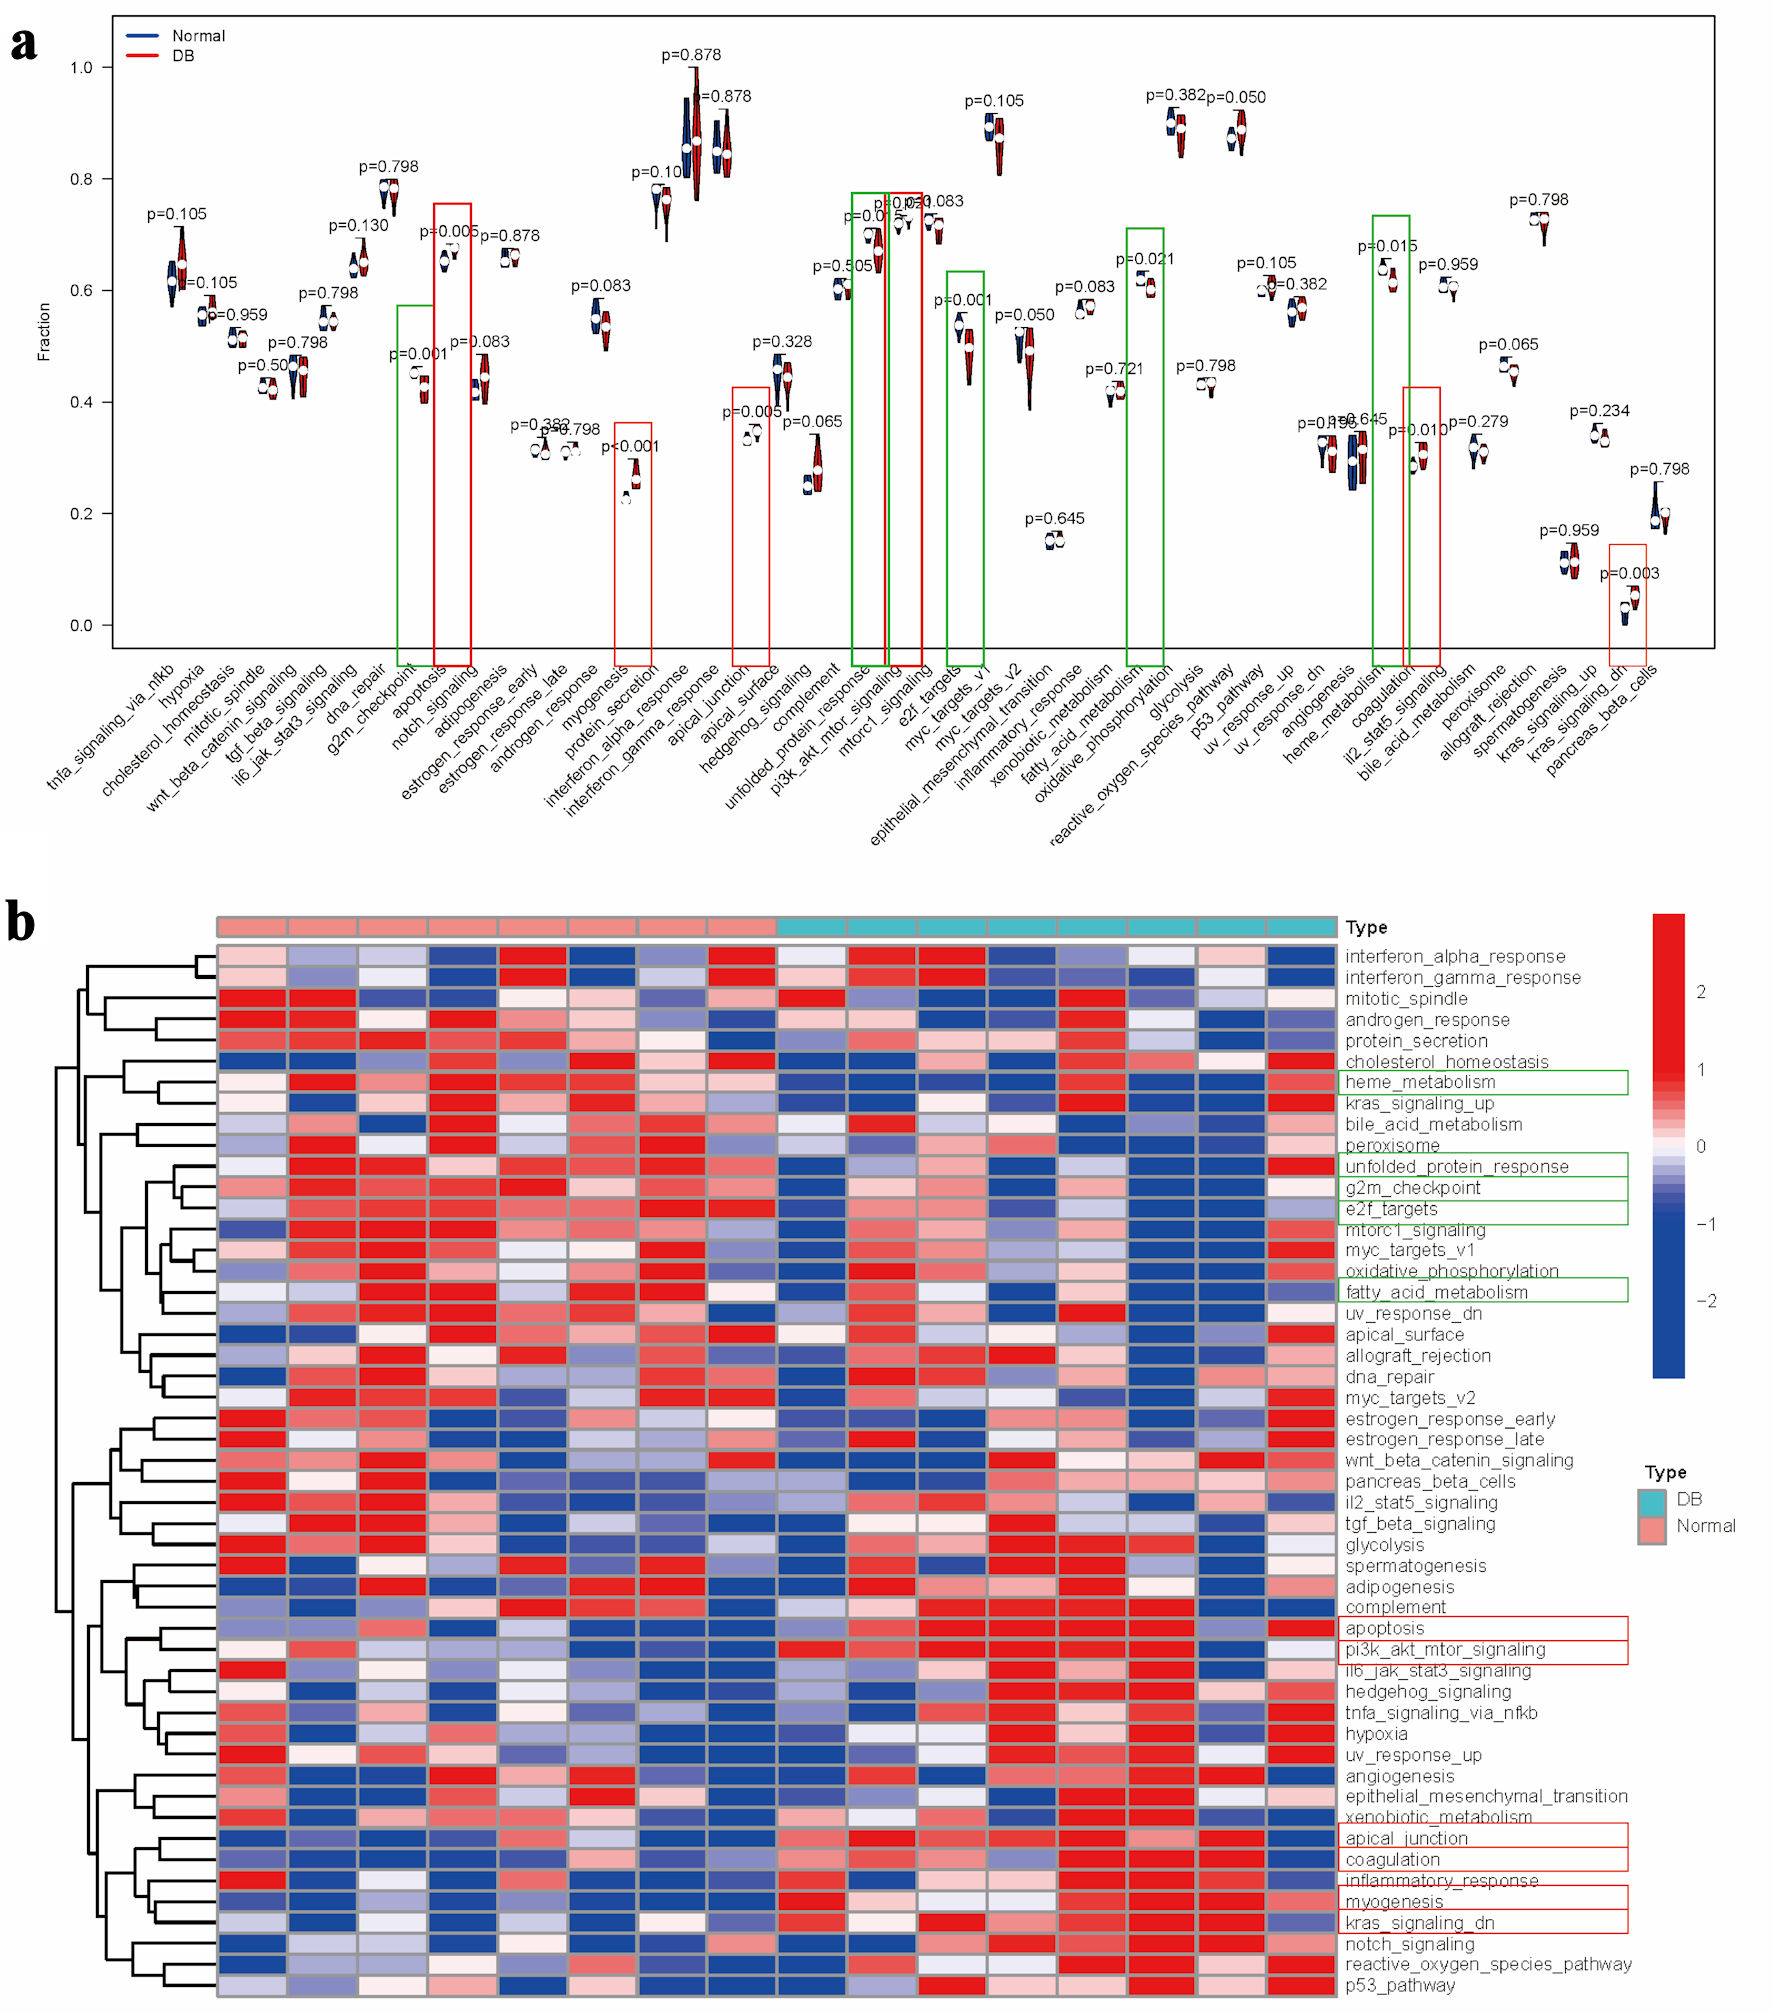
↓ Figure 2. Pathway enrichment analysis in
diabetes. (a) Comparative analysis of pathway enrichment scores between experimental groups. (b)
Clustered heatmap visualization of pathway enrichment scores. Note: Items with the significant
upregulation were marked with red rectangle, while items with the significant downregulation were marked
with green rectangle.
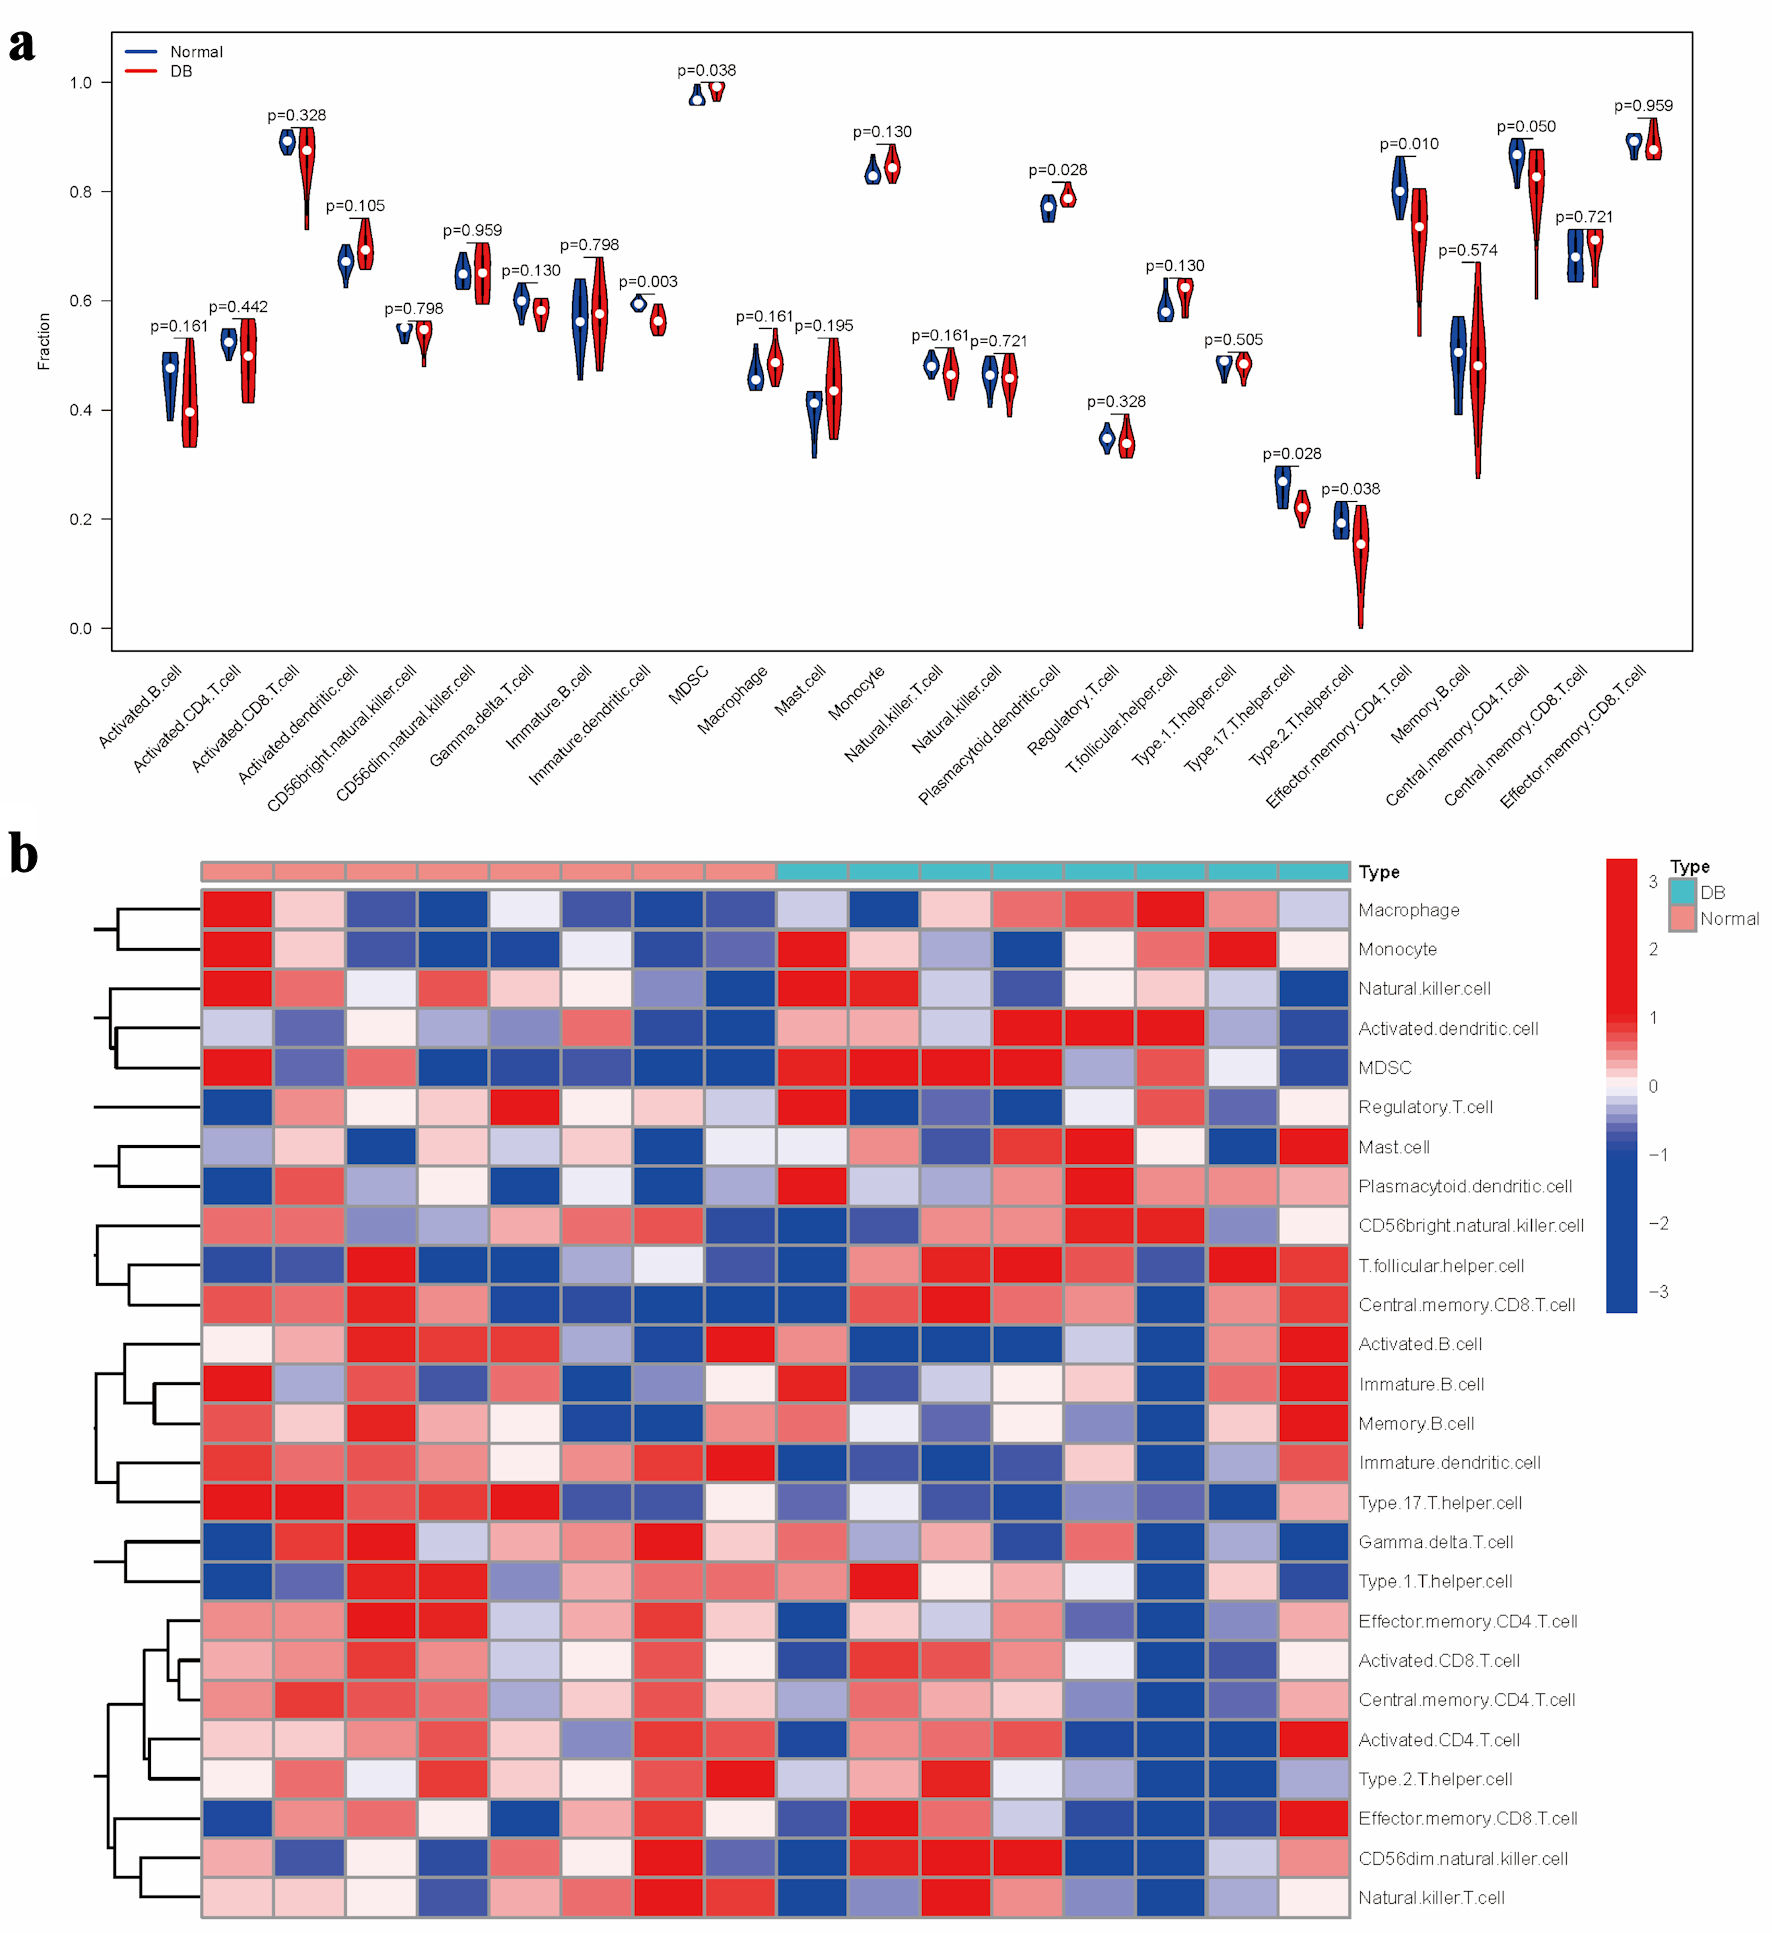
↓ Figure 3. Evaluation of immune cell
distribution patterns in diabetic conditions. (a) Comparative analysis of immune cell enrichment metrics
across experimental groups. (b) Heatmap illustrating group-specific variations in immune cell activation
levels.
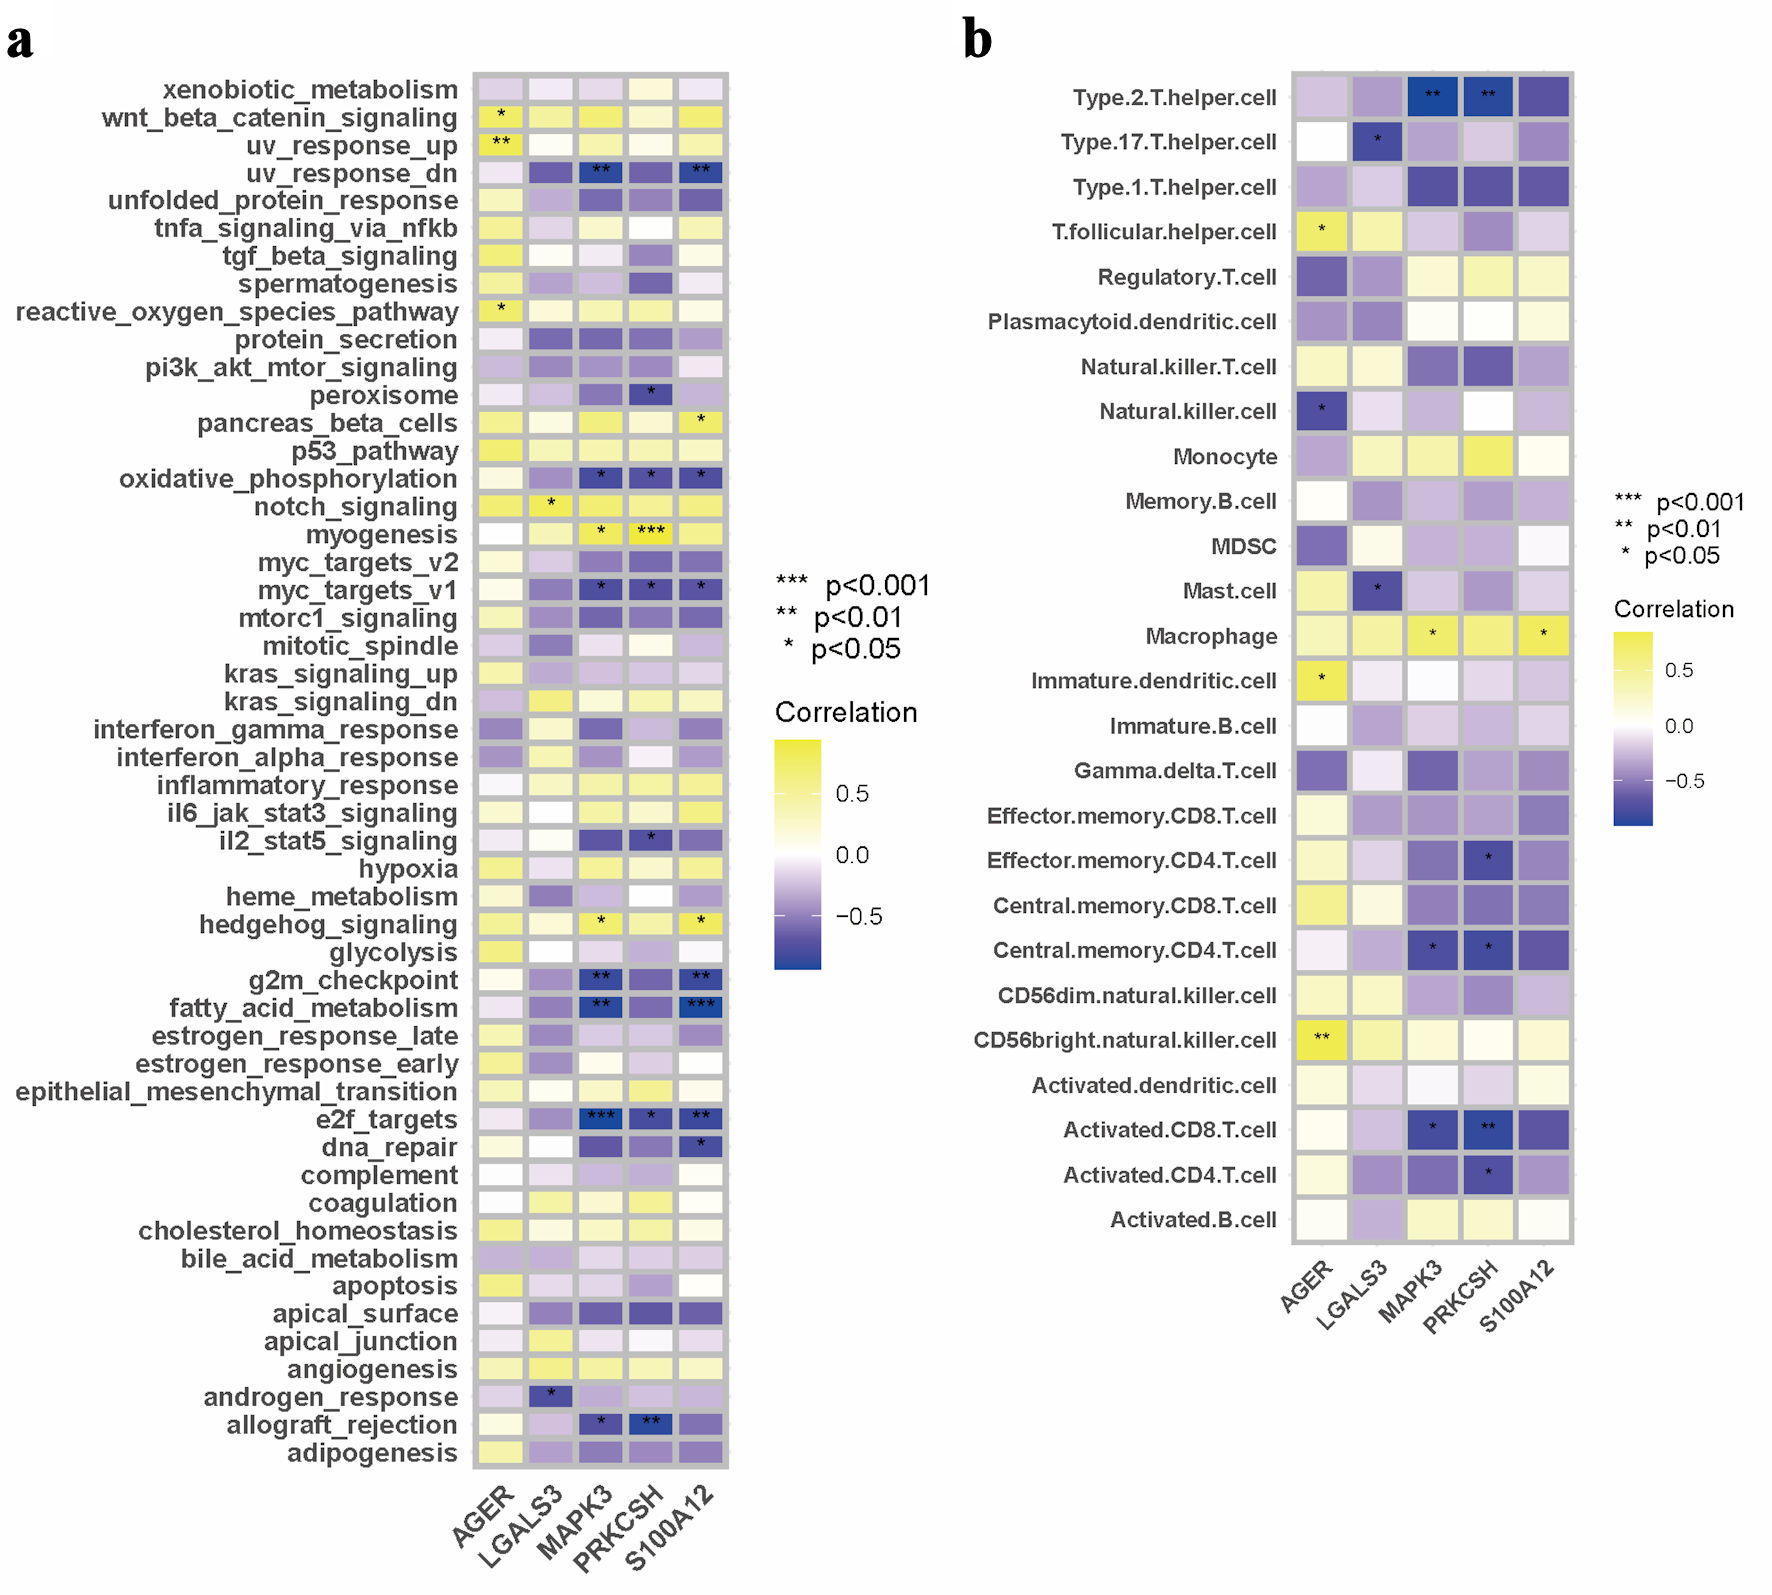
↓ Figure 4. Interconnection analysis of
biological pathways, immune cell populations, and gene expression characteristics. (a) A
pathway–gene expression correlation network mapping. (b) An interaction matrix between immune
cell composition and gene expression.
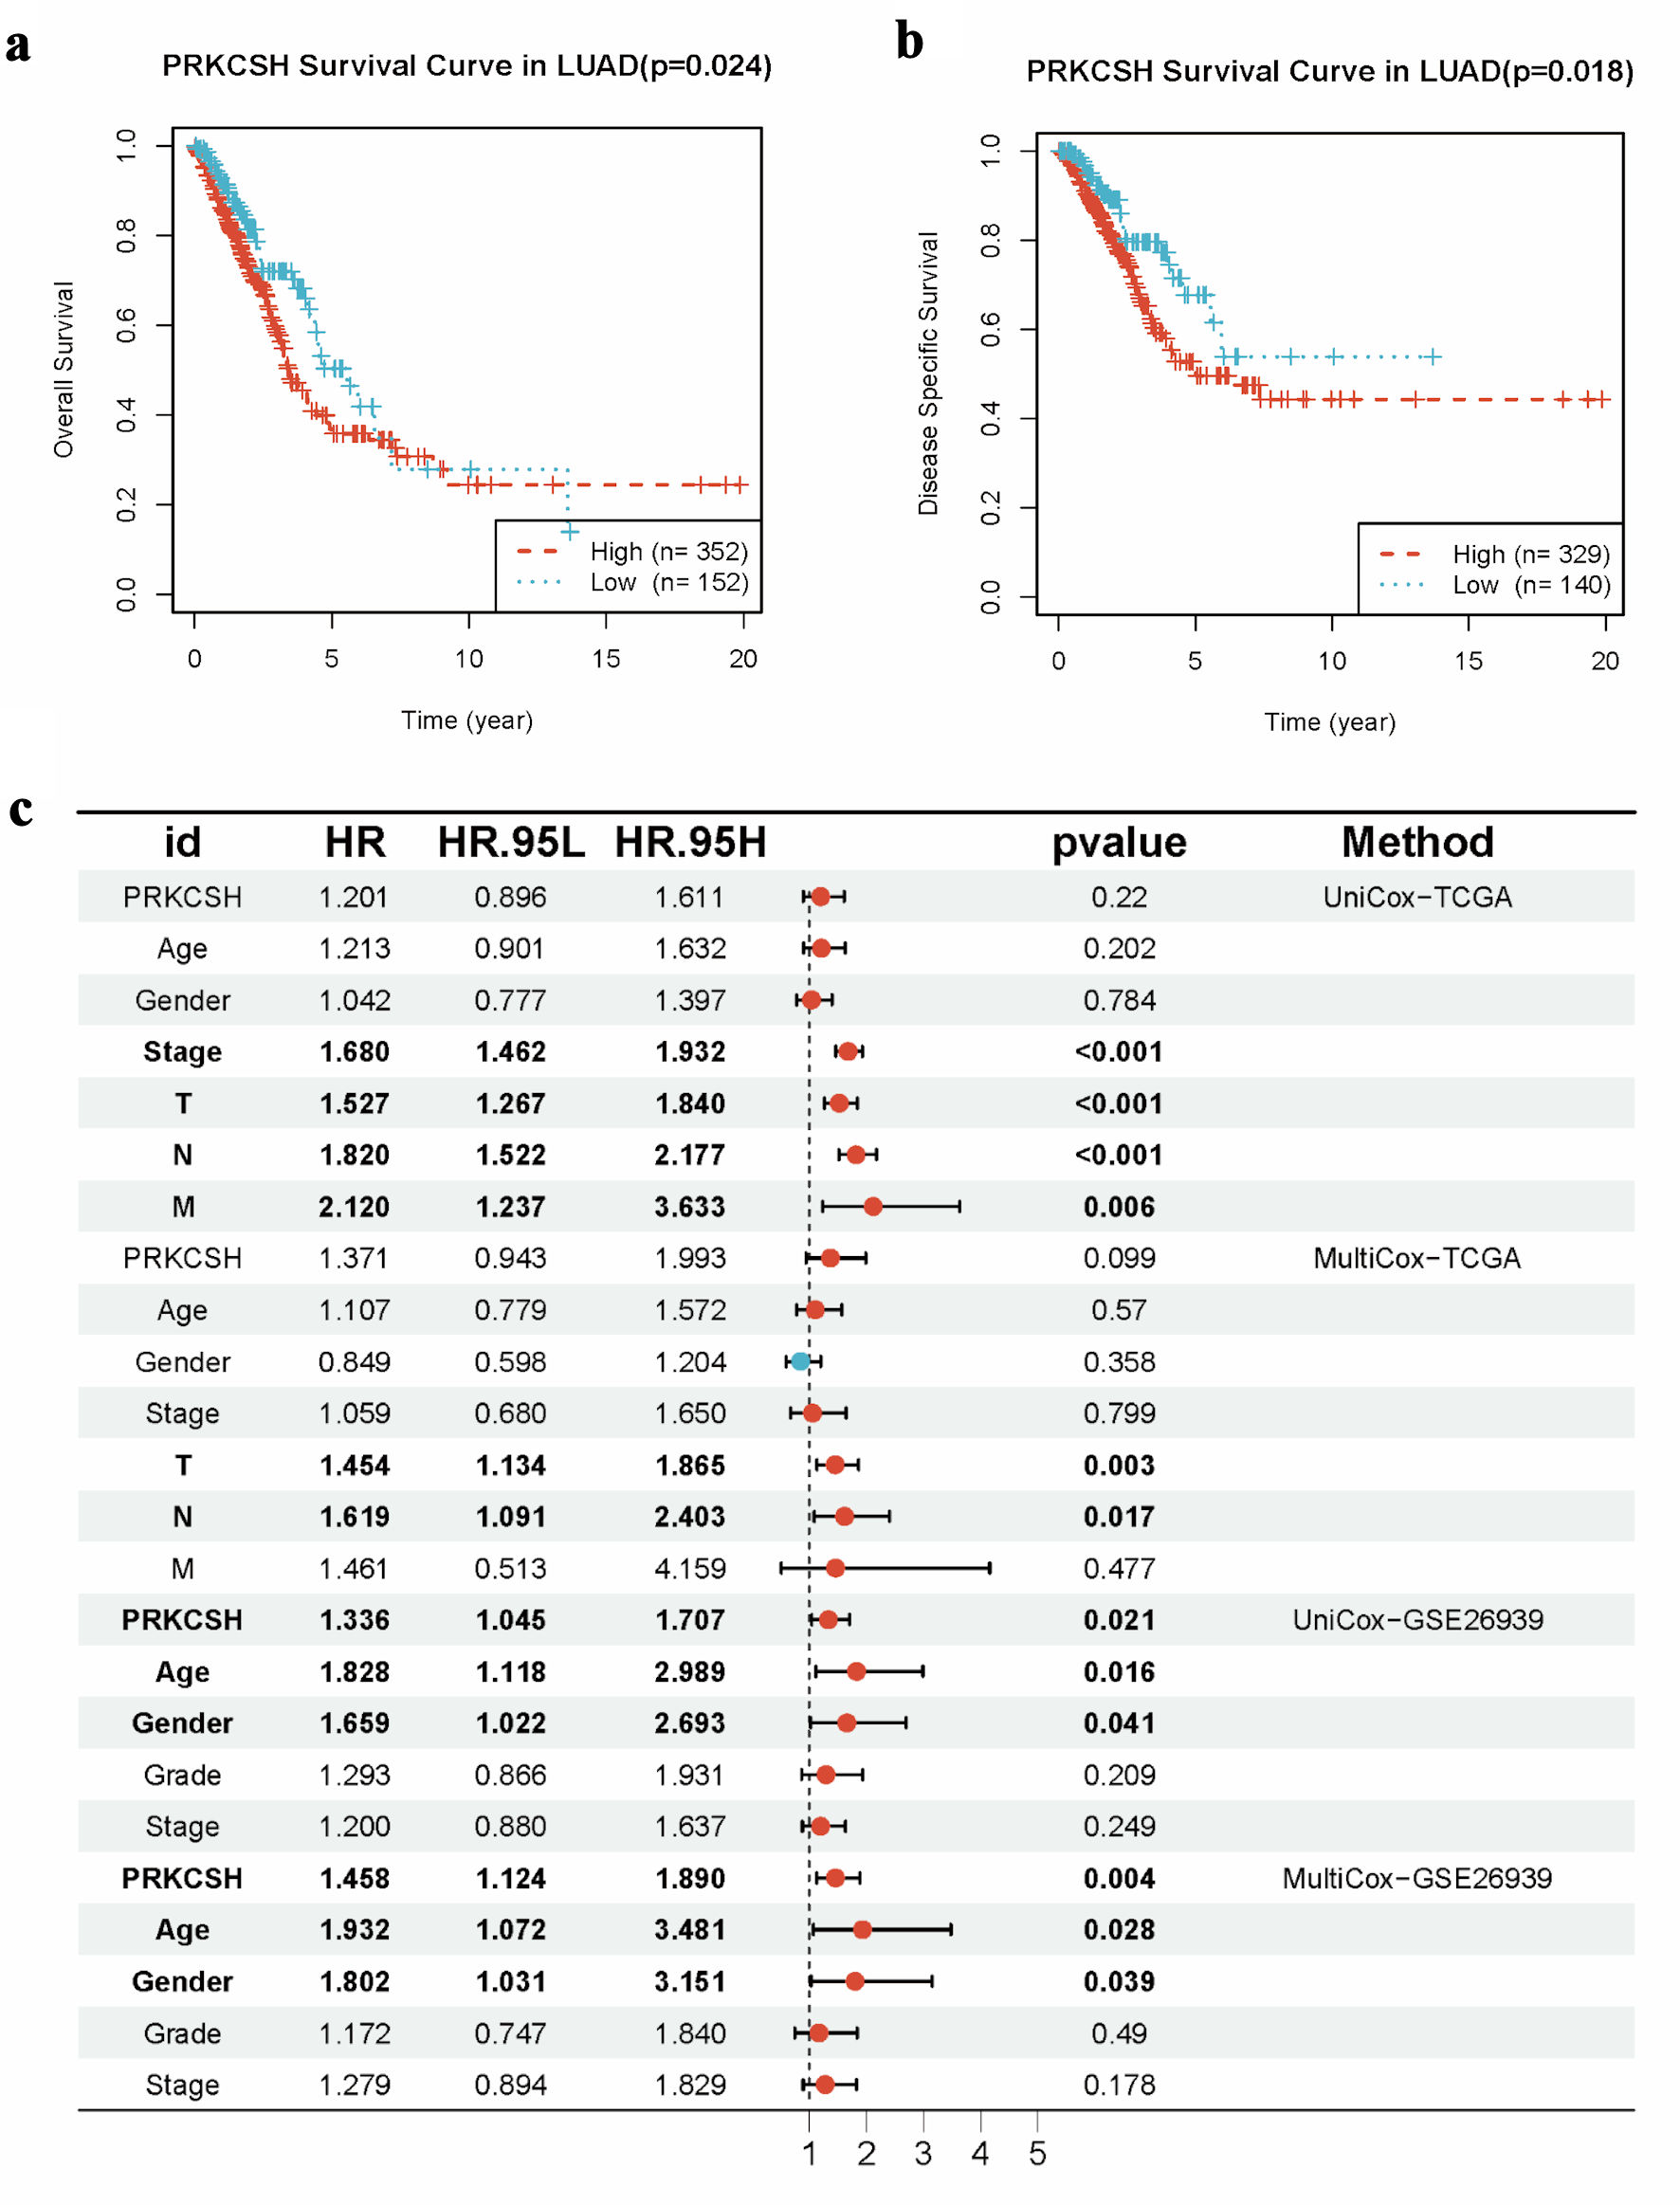
↓ Figure 5. Prognostic significance of PRKCSH
expression in LUAD cases. (a) Kaplan–Meier curves indicated reduced overall survival in LUAD
patients with elevated PRKCSH expression. (b) Disease-specific survival analysis reveals poorer outcomes
in cohorts with high PRKCSH expression. (c) Multivariate Cox regression models identify PRKCSH as an
independent prognostic indicator within the TCGA-LUAD and GSE26939 cohorts. PRKCSH: protein kinase C
substrate 80K-H; LUAD: lung adenocarcinoma; TCGA: The Cancer Genome Atlas; HR: hazard ratio.
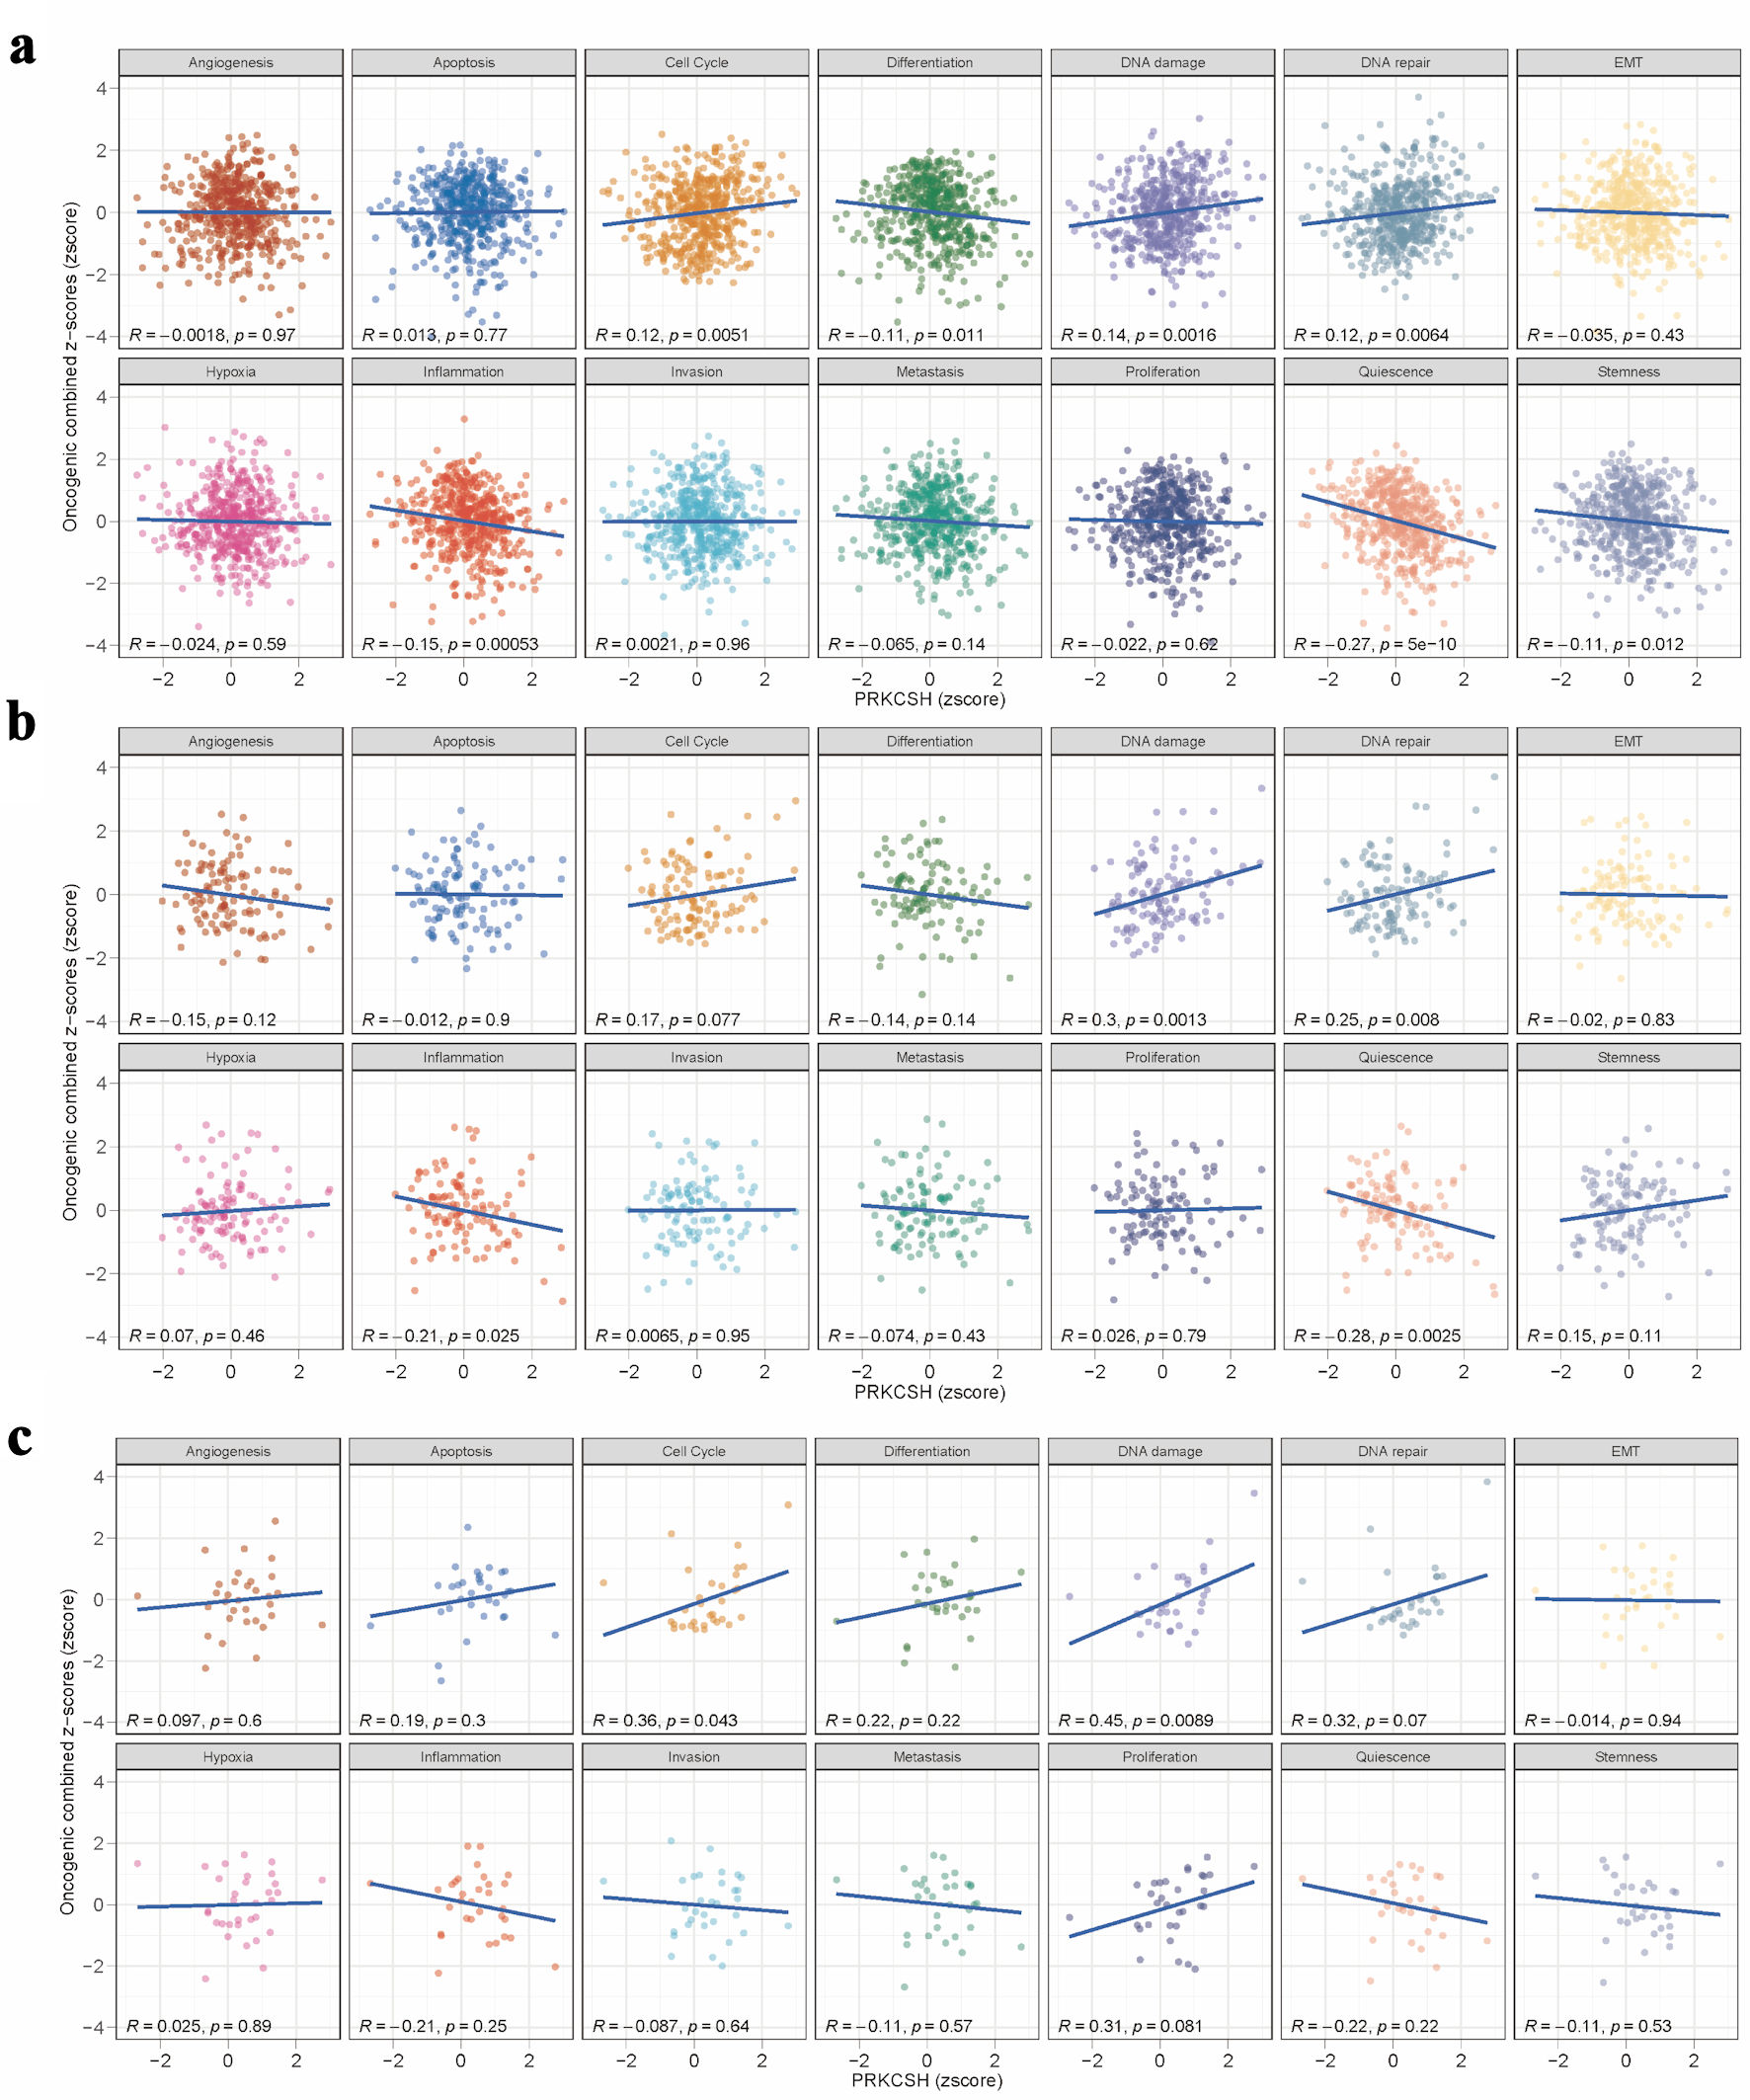
↓ Figure 6. Pathway association studies of
PRKCSH expression patterns. (a–c) Significant correlations between PRKCSH levels and key
oncogenic processes, including cell cycle regulation, genomic stability mechanisms, cellular
differentiation, inflammatory responses, and stem cell characteristics, across the TCGA-LUAD, GSE26939,
and GSE63459 datasets. PRKCSH: protein kinase C substrate 80K-H; LUAD: lung adenocarcinoma; TCGA: The
Cancer Genome Atlas.
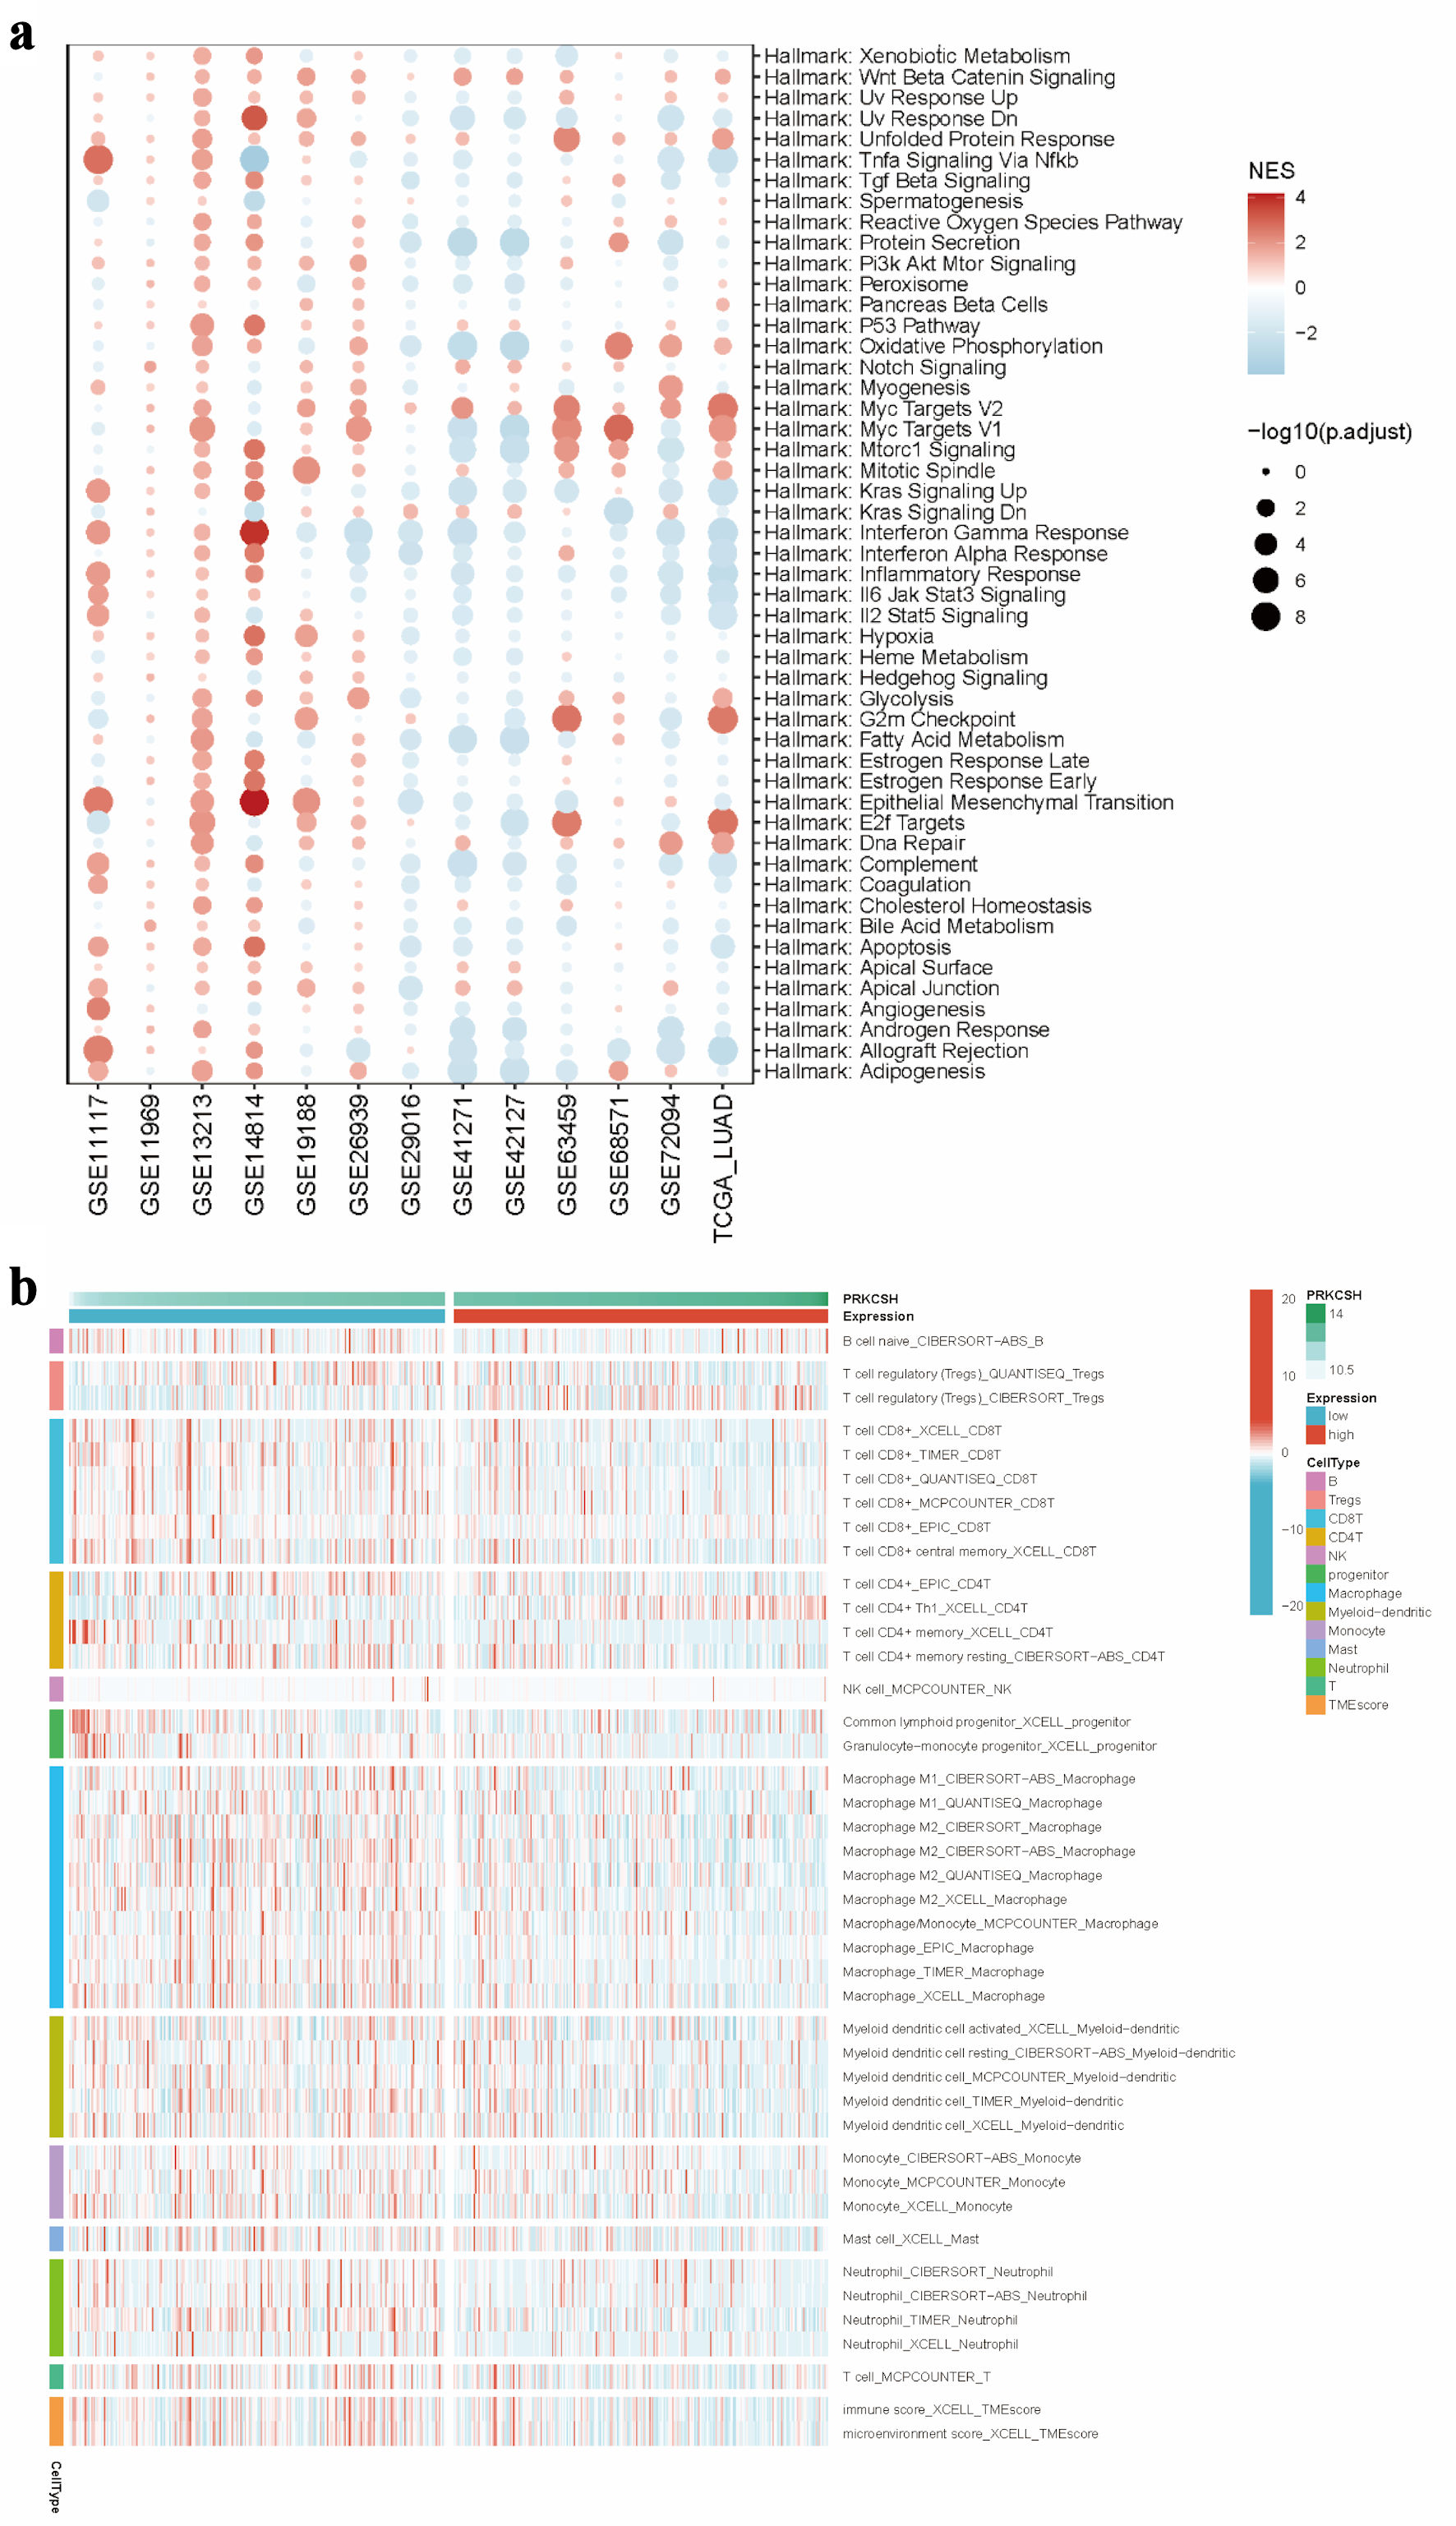
↓ Figure 7. Immune microenvironment in relation
to PRKCSH expression in LUAD. (a) GSEA pathway enrichment analysis using data from the TCGA-LUAD
dataset. (b) Comparative immune cell infiltration patterns between subgroups with high and low PRKCSH
expressions. PRKCSH: protein kinase C substrate 80K-H; LUAD: lung adenocarcinoma; GSEA: Gene Set
Enrichment Analysis; TCGA: The Cancer Genome Atlas.
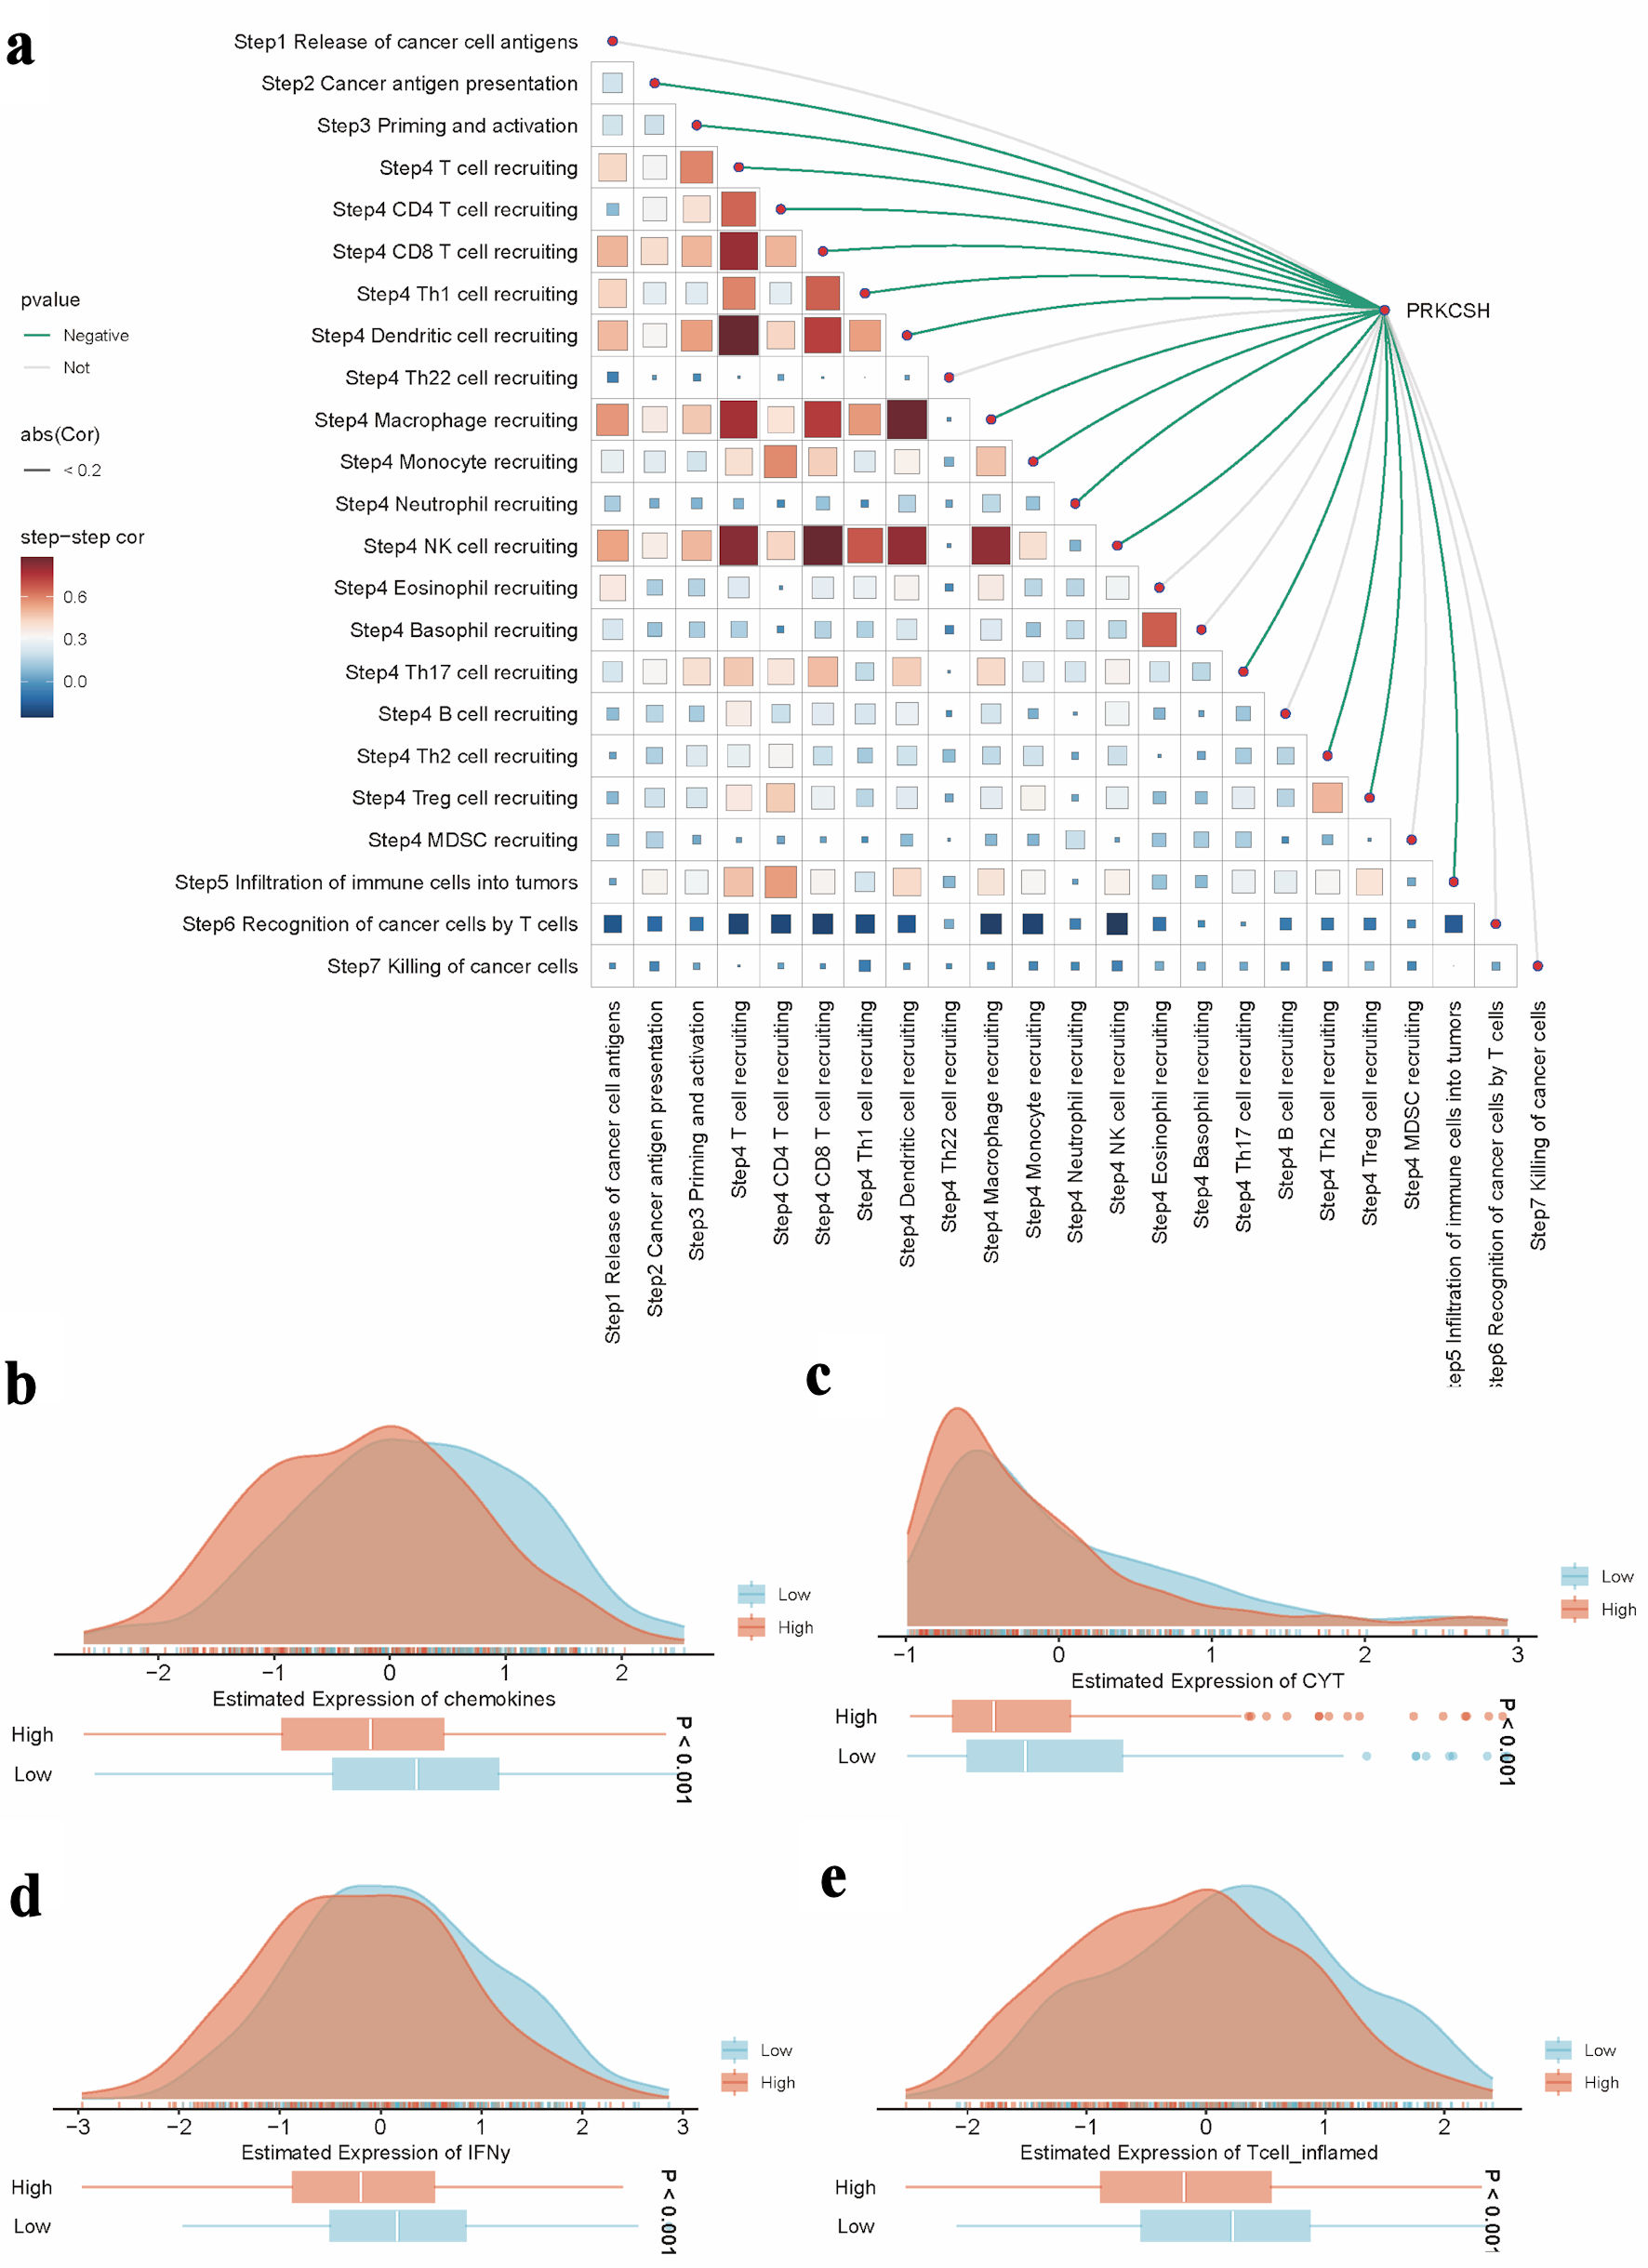
↓ Figure 8. Role of PRKCSH in tumor immune
regulation within LUAD. (a) The spearman correlation between the TIP score and the expression level of
the PRKCSH gene in the TCGA-LUAD cohort. (b–e) Pathway activity comparisons related to
chemokine signaling, cytotoxic potential (CYT), interferon-γ response, and inflammatory T-cell
activation across different PRKCSH expression subgroups. TIP: tracking tumor immunophenotype; PRKCSH:
protein kinase C substrate 80K-H; LUAD: lung adenocarcinoma; GSEA: Gene Set Enrichment Analysis; TCGA:
The Cancer Genome Atlas; CYT: cytotoxic T-cell responses.
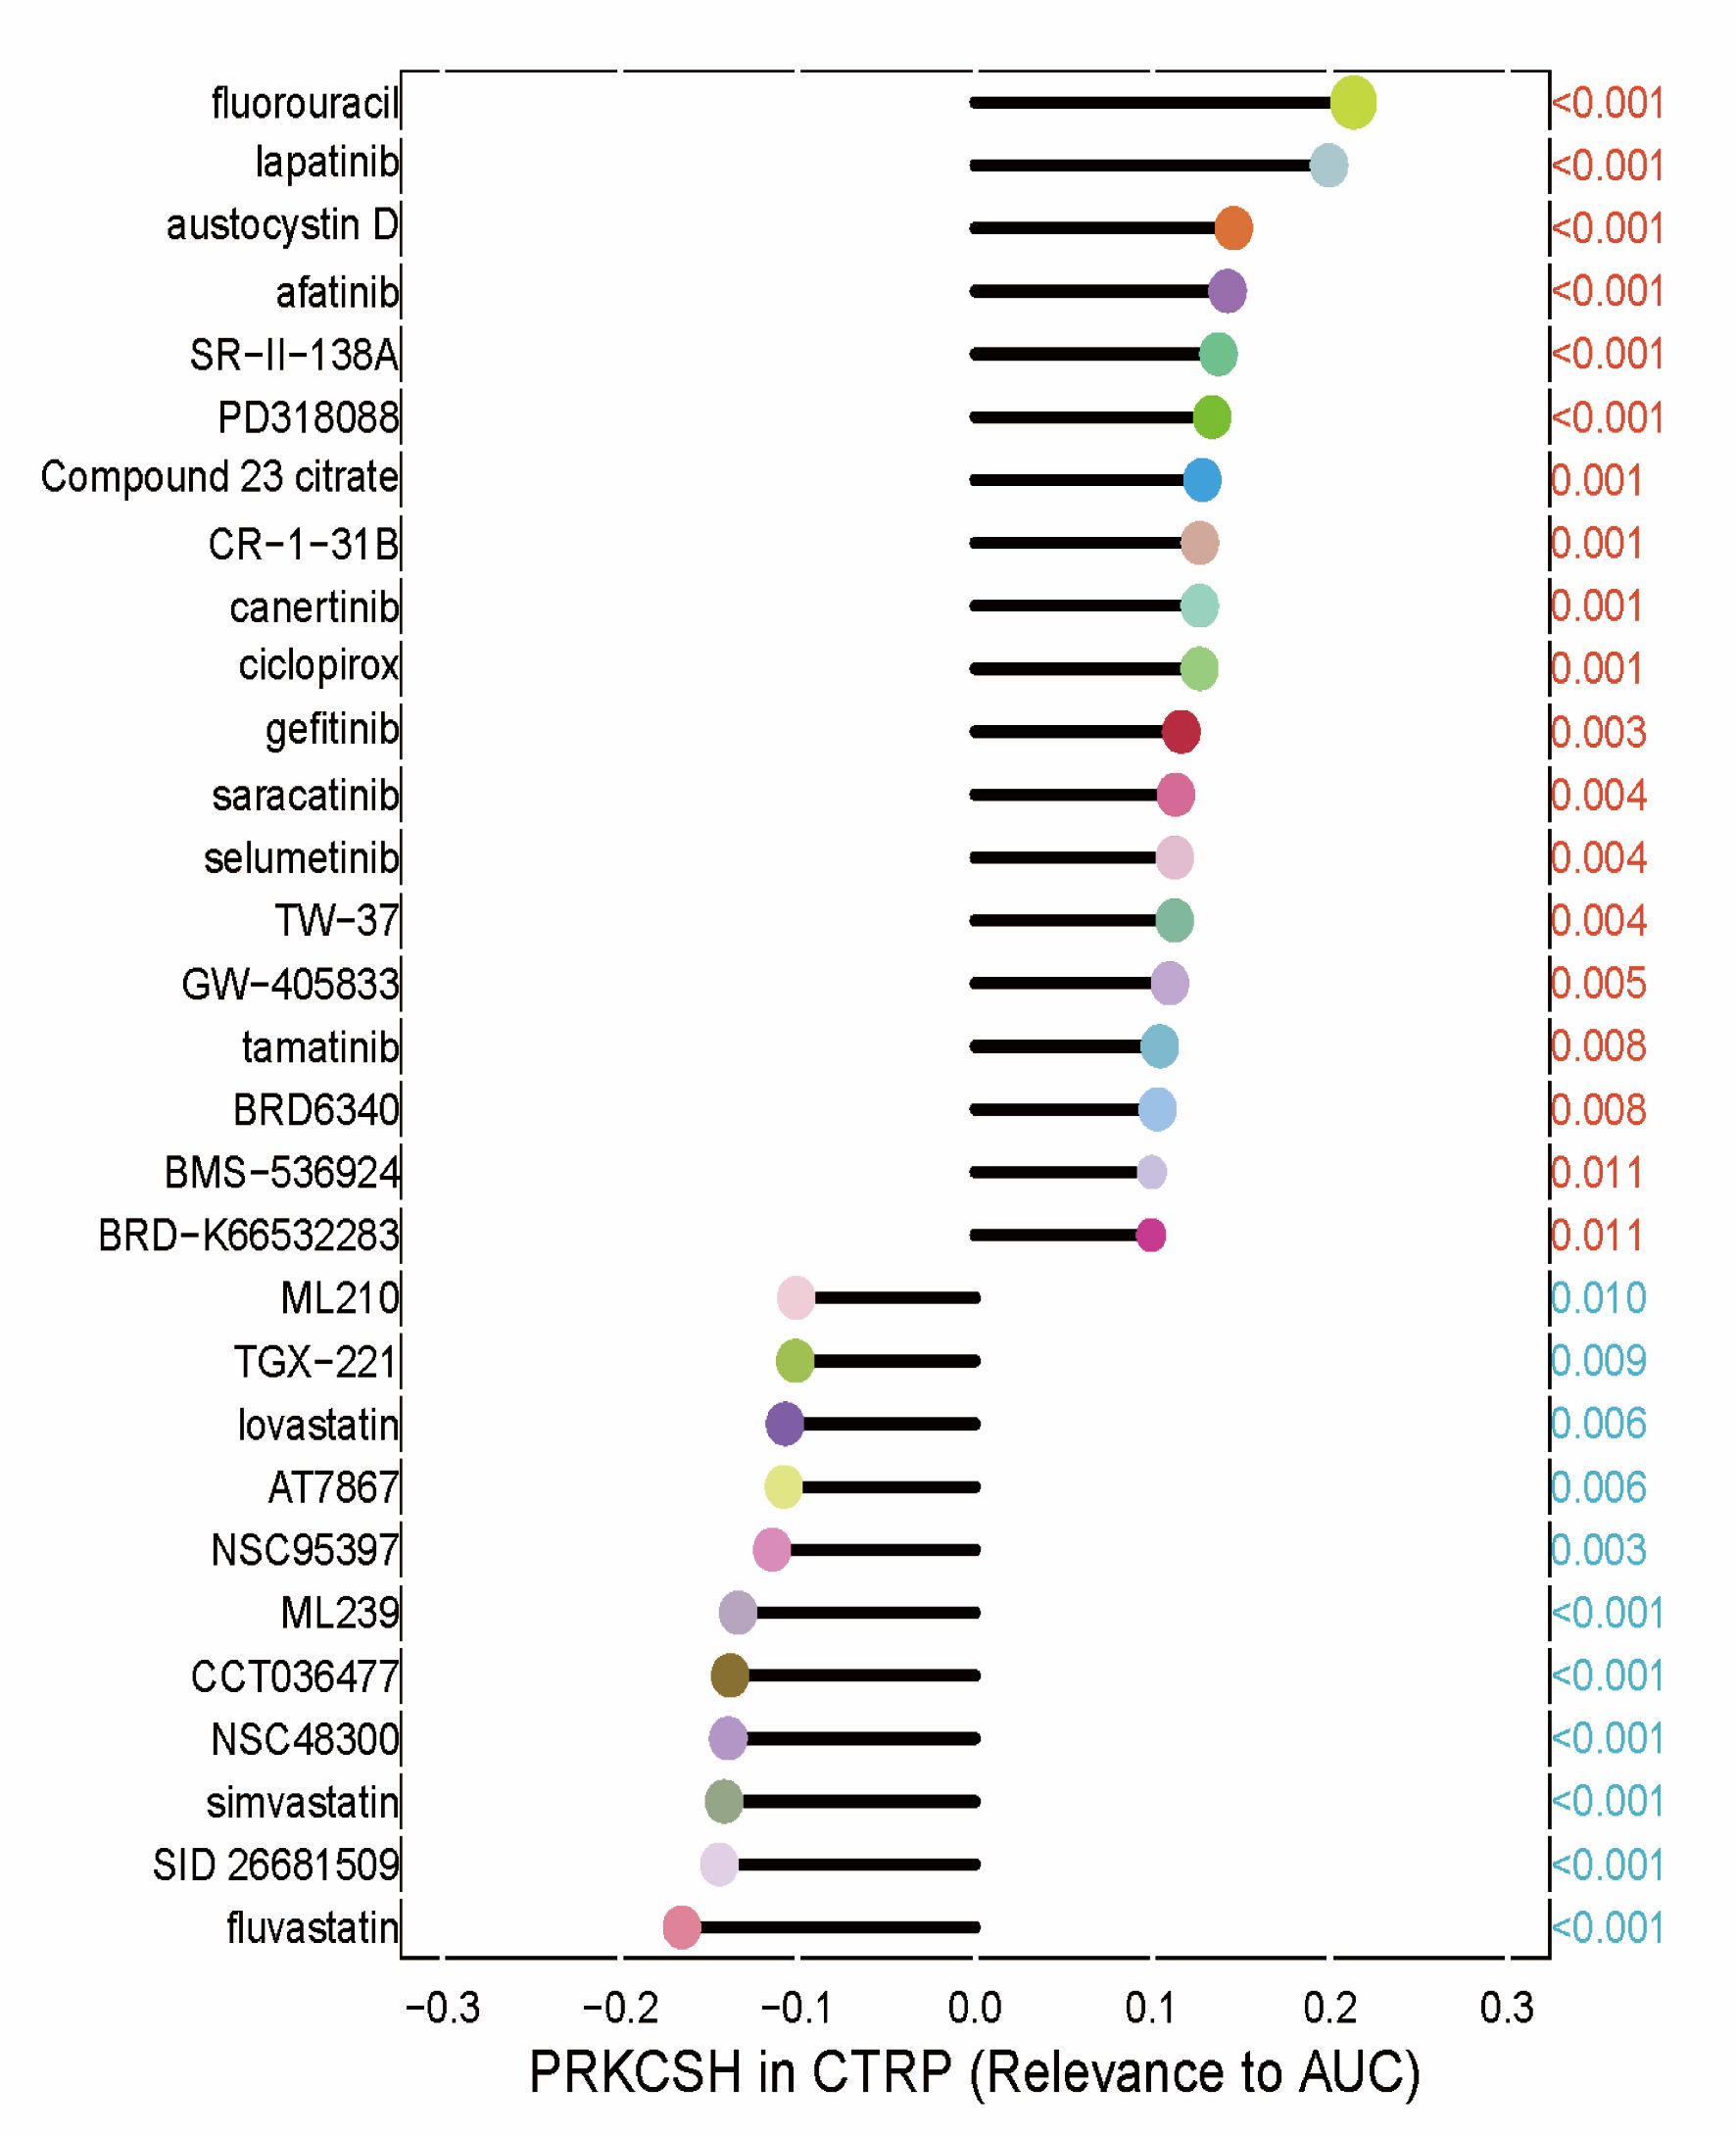
↓ Figure 9. Therapeutic sensitivity correlations
between PRKCSH expression and the half-maximal inhibitory concentration (IC50) values of
pharmacological agents from the GDSC1 database. Each drug was represented by a different color, with the
P value indicated in red if positively associated with the gene and in blue otherwise. The correlation
coefficient was represented by the length of the bars in the lollipop plot. PRKCSH: protein kinase C
substrate 80K-H; AUC: area under the curve.
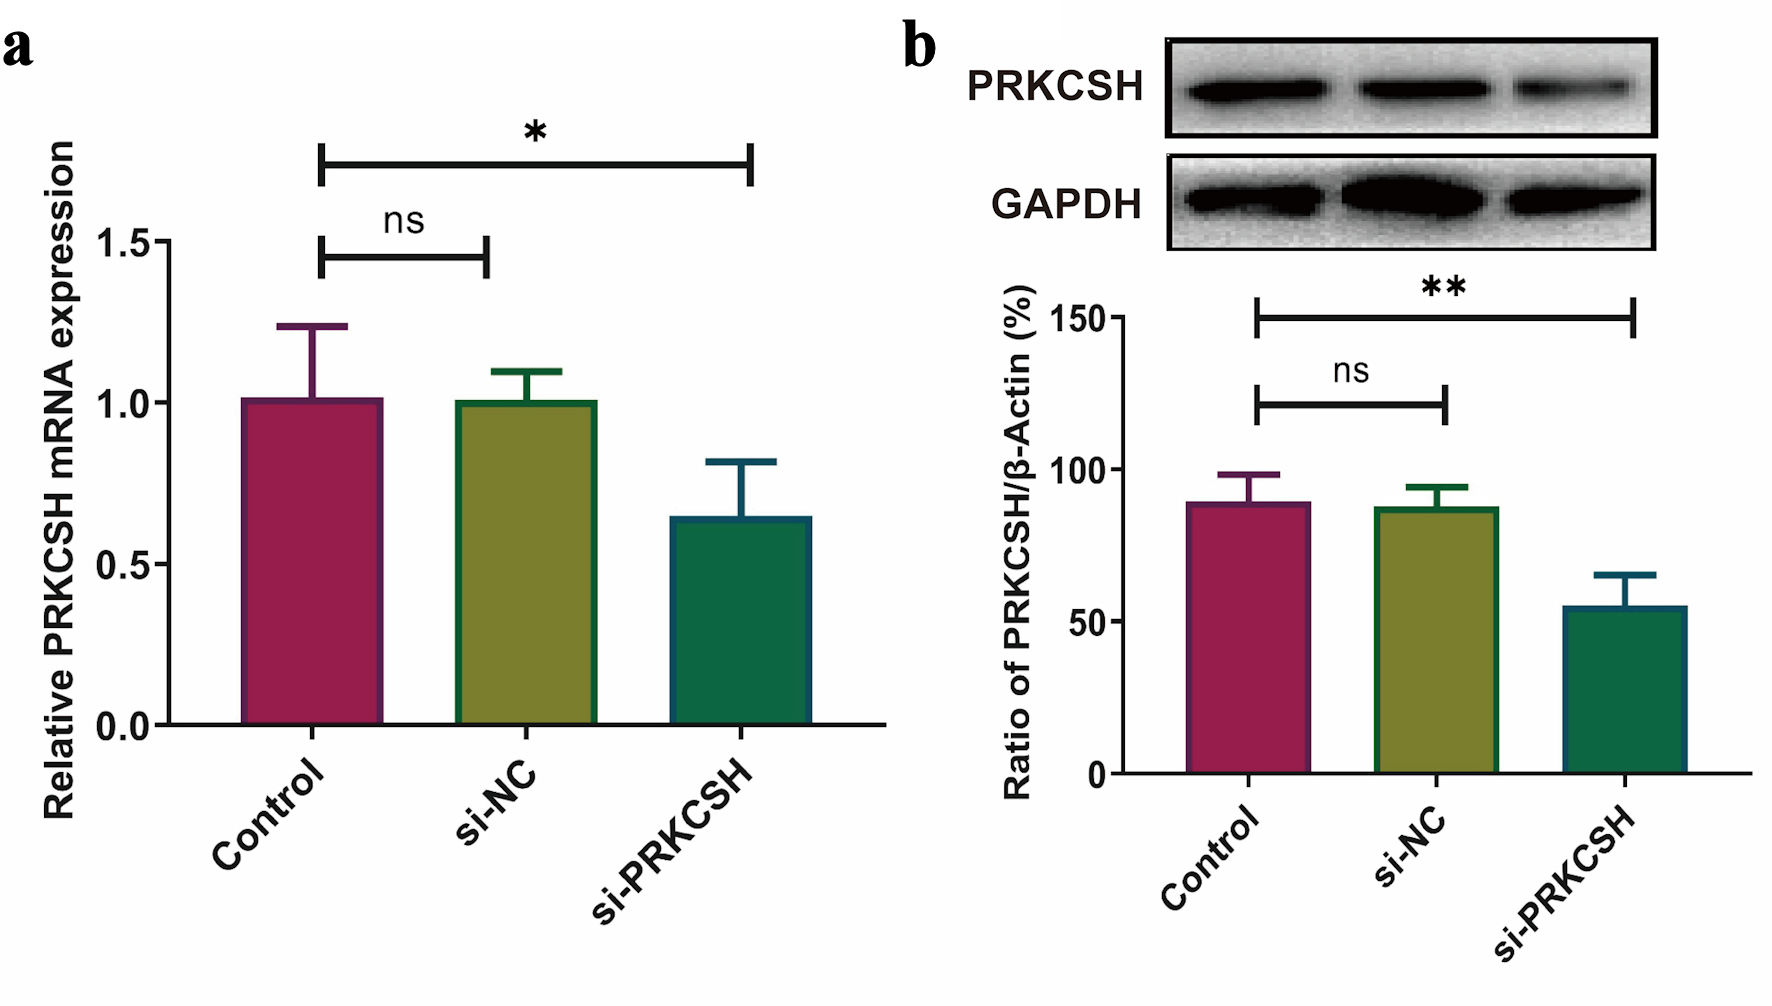
↓ Figure 10. PRKCSH suppression in A549 cell
models. (a) Quantitative analysis of mRNA expression using RT-qPCR, with normalization to GAPDH.
(b) Protein level assessment via Western blotting, employing GAPDH as an internal control. RT-qPCR:
real-time quantitative polymerase chain reaction; mRNA: messenger RNA; GAPDH: glyceraldehyde-3-phosphate
dehydrogenase; PRKCSH: protein kinase C substrate 80K-H.
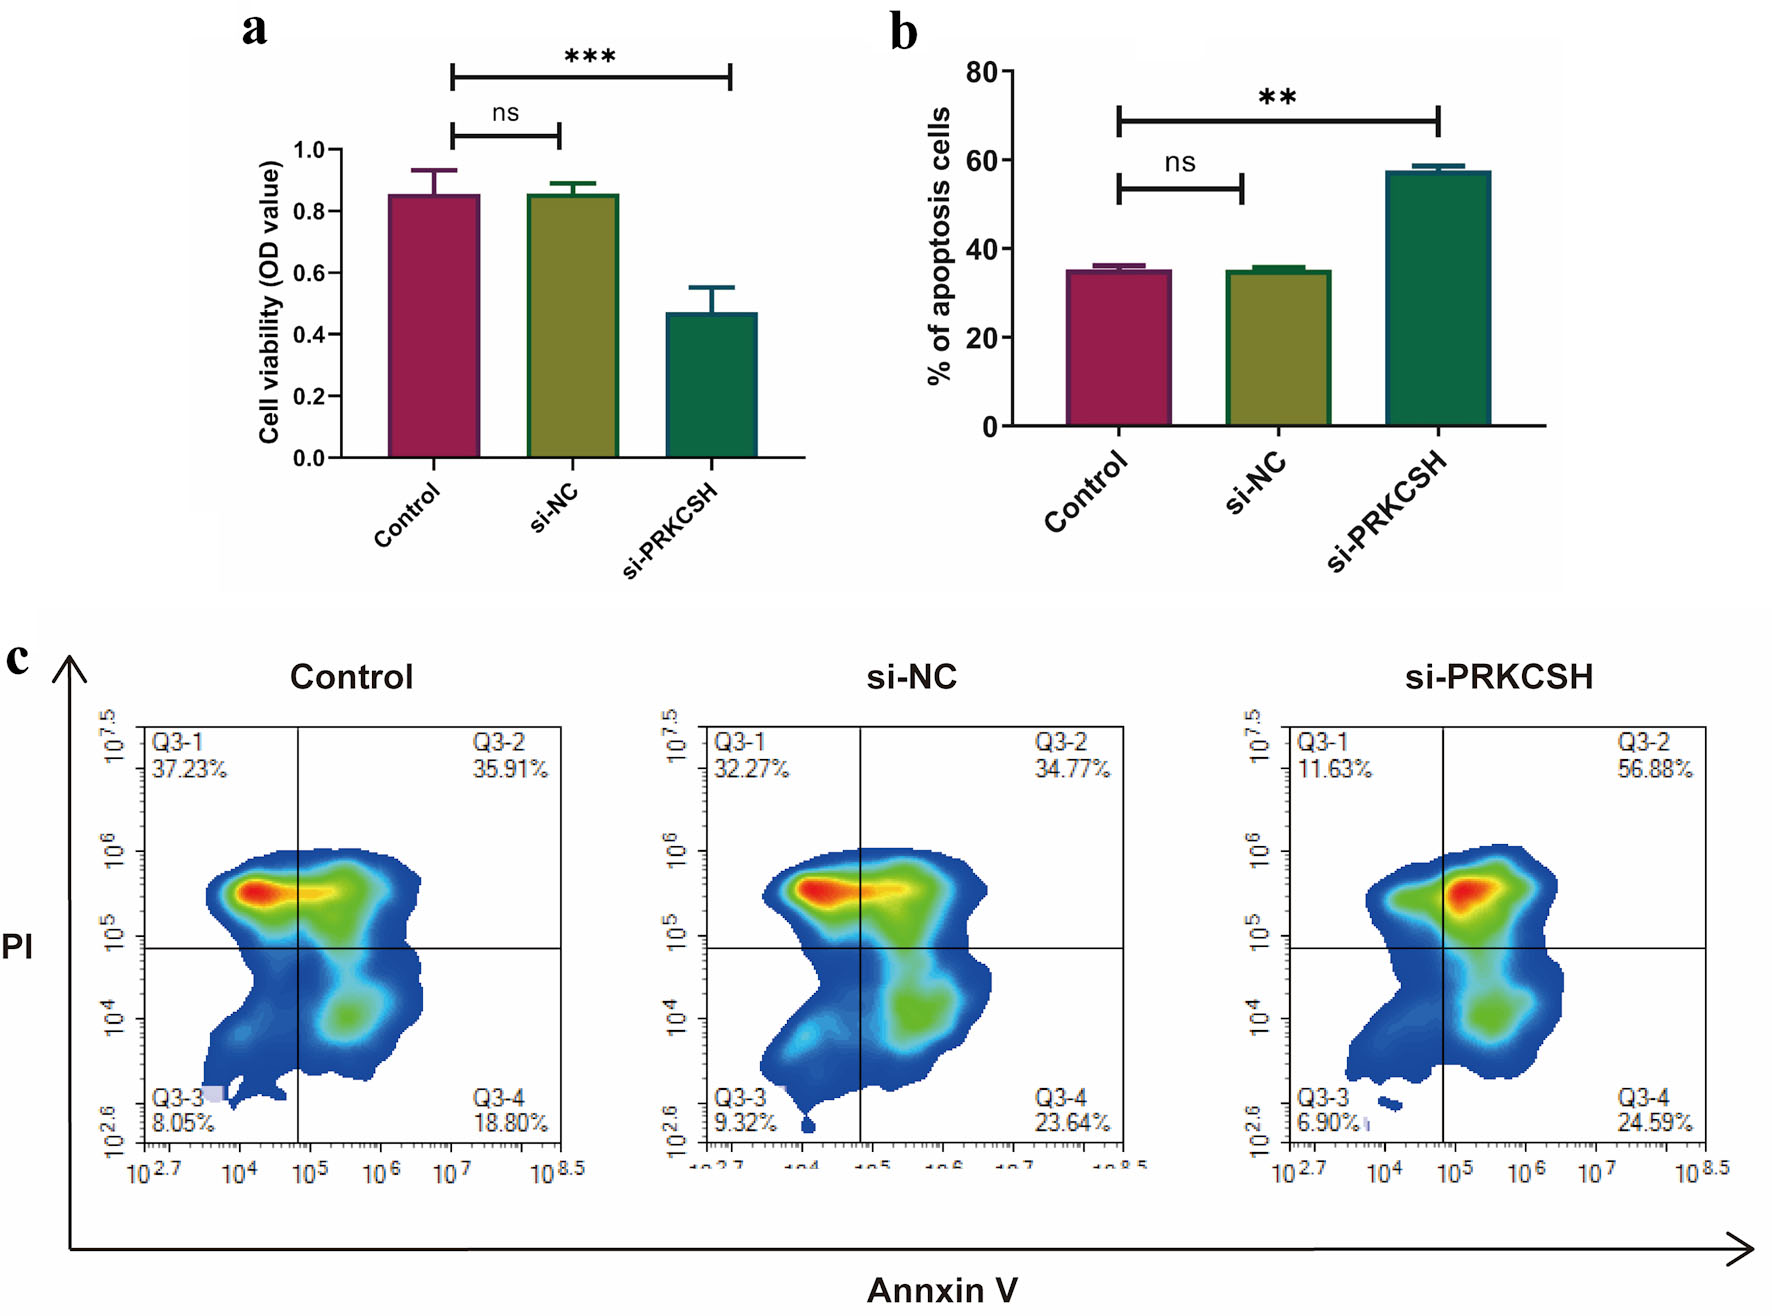
↓ Figure 11. Effects of PRKCSH silencing on the
dynamics of A549 cells. (a) Cell proliferation evaluation using MTT assays. (b, c) Apoptotic response
quantification through flow cytometric analysis.