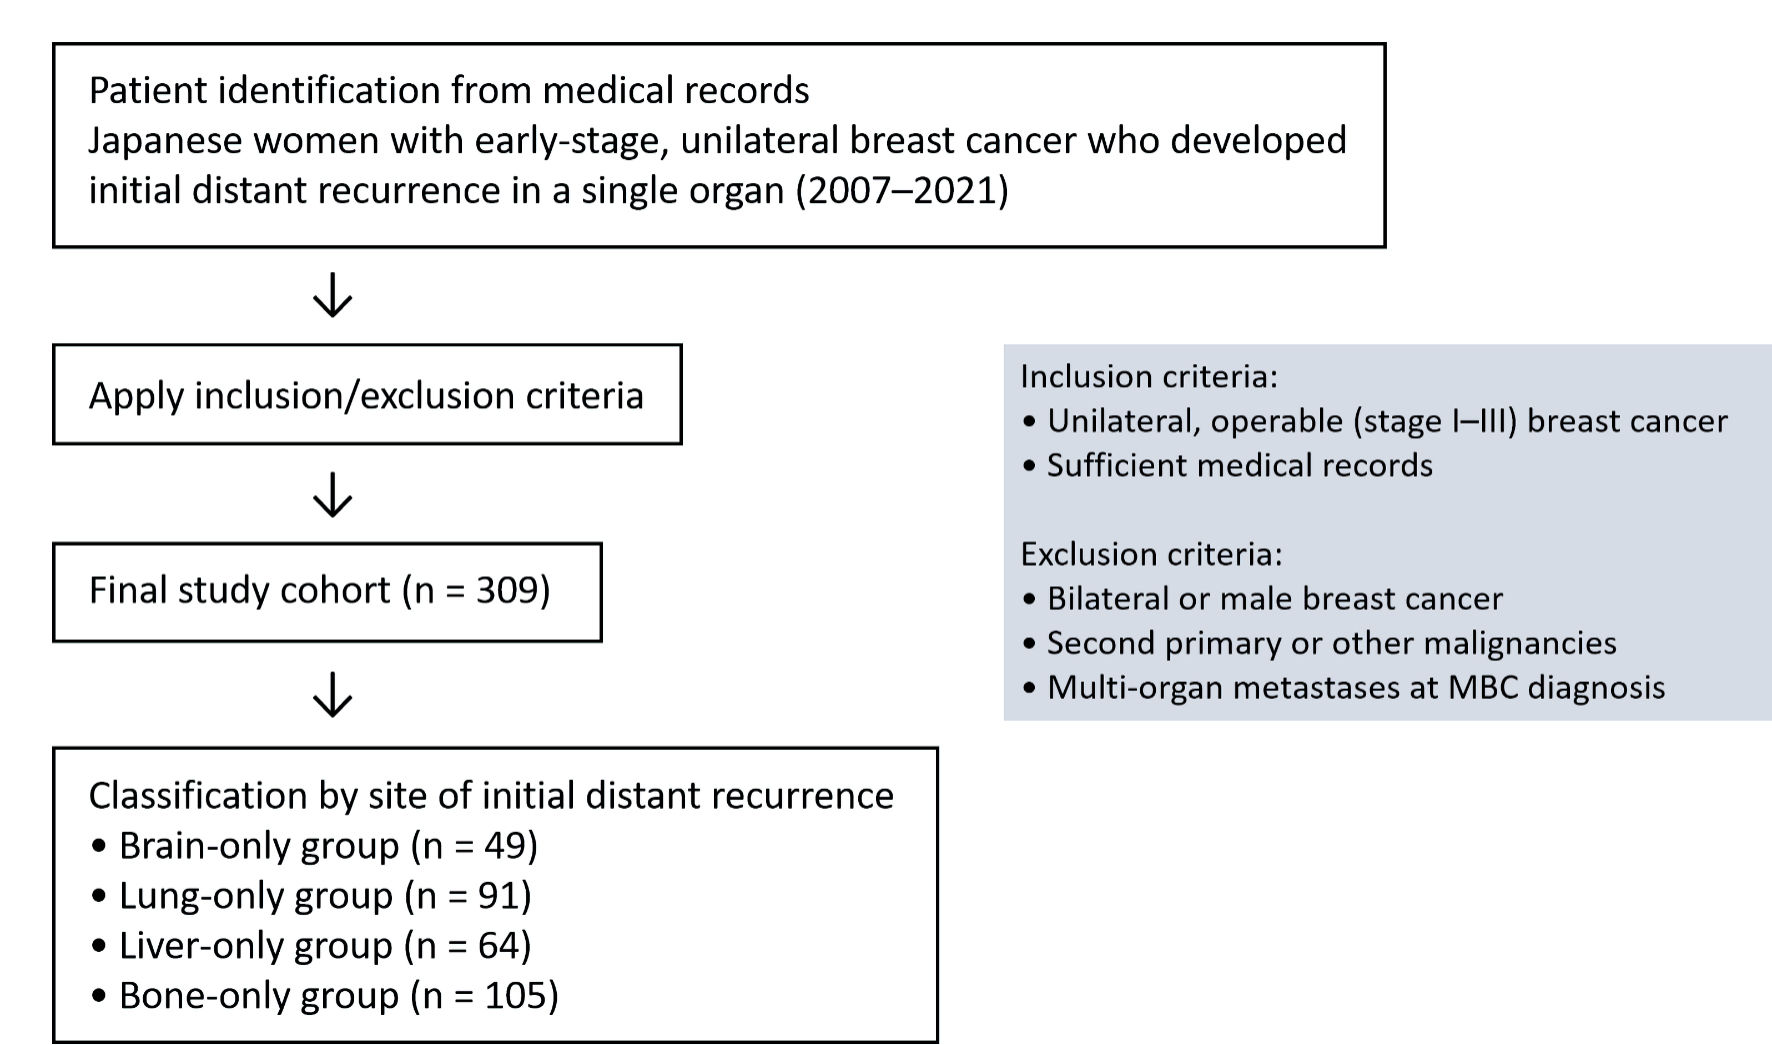
↓ Figure 1. Flow diagram of study design. A flow
diagram of the study design, including inclusion and exclusion criteria, is shown. MBC: metastatic
breast cancer.
| World Journal of Oncology, ISSN 1920-4531 print, 1920-454X online, Open Access |
| Article copyright, the authors; Journal compilation copyright, World J Oncol and Elmer Press Inc |
| Journal website https://wjon.elmerpub.com |
Original Article
Volume 17, Number 1, February 2026, pages 52-62
Organ-Specific Clinicopathological Features That Are Associated With Post-Relapse Survival of Metastatic Breast Cancer in Japanese Women: A Multicenter Cohort Study
Figures
Tables
| Baseline factors | All (n = 309) | Brain-only (n = 49) | Lung-only (n = 91) | Liver-only (n = 64) | Bone-only (n = 105) | P value |
|---|---|---|---|---|---|---|
| PBC: primary breast cancer; MBC: metastatic breast cancer; HER2: human epidermal growth factor receptor 2; DMFS, distant metastasis free survival. | ||||||
| Age at PBC diagnosis (years), median (range) | 58 (21 - 89) | 58 (27 - 84) | 59 (21 - 89) | 56 (30 - 86) | 58 (31 - 77) | 0.575 |
| Age at MBC diagnosis (years), median (range) | 61 (29 - 90) | 59 (29 - 84) | 62 (29 - 90) | 59 (34 - 87) | 61 (35 - 81) | 0.728 |
| Histological type | ||||||
| Invasive ductal carcinoma | 266 (86%) | 45 (92%) | 76 (84%) | 58 (91%) | 87 (83%) | 0.276 |
| Others | 43 (14%) | 4 (8%) | 15 (16%) | 6 (9%) | 18 (17%) | |
| Clinical disease stage of PBC | ||||||
| Stage I | 54 (17%) | 4 (8%) | 16 (18%) | 13 (20%) | 21 (20%) | 0.288 |
| Stage II/III | 255 (83%) | 45 (92%) | 75 (82%) | 51 (80%) | 84 (80%) | |
| Pathological disease stage of PBC | ||||||
| Stage 0/I | 67 (21%) | 20 (40%) | 19 (21%) | 11 (17%) | 17 (16%) | 0.004 |
| Stage II/III | 242 (78%) | 29 (60%) | 72 (79%) | 53 (83%) | 88 (84%) | |
| Nuclear grade | ||||||
| Grade 1/2 | 141 (65%) | 11 (48%) | 33 (53%) | 30 (59%) | 67 (83%) | < 0.001 |
| Grade 3 | 76 (35%) | 12 (52%) | 29 (47%) | 21 (41%) | 14 (17%) | |
| Unknown | 92 | 26 | 29 | 13 | 24 | |
| Ki67 labeling index | ||||||
| Low (≤ 20%) | 62 (27%) | 8 (24%) | 9 (12%) | 20 (41%) | 25 (35%) | 0.002 |
| High (> 20%) | 165 (73%) | 26 (76%) | 64 (88%) | 29 (59%) | 46 (65%) | |
| Unknown | 82 | 15 | 18 | 15 | 34 | |
| Molecular subtypes | ||||||
| Luminal | 181 (59%) | 14 (29%) | 47 (52%) | 39 (61%) | 81 (77%) | < 0.001 |
| Luminal-HER2 | 32 (10%) | 7 (14%) | 7 (8%) | 11 (17%) | 7 (7%) | |
| HER2-enriched | 30 (10%) | 13 (27%) | 11 (12%) | 3 (5%) | 3 (3%) | |
| Triple-negative | 66 (21%) | 15 (31%) | 26 (29%) | 11 (17%) | 14 (13%) | |
| Adjuvant chemotherapy for PBC | ||||||
| Yes | 219 (71%) | 42 (86%) | 55 (60%) | 46 (72%) | 76 (72%) | 0.017 |
| Neoadjuvant | 143 | 32 | 37 | 34 | 40 | |
| Adjuvant | 76 | 10 | 18 | 12 | 36 | |
| No | 90 (29%) | 7 (14%) | 36 (40%) | 18 (28%) | 29 (28%) | |
| DMFS (months), median (range) | 29.4 (1 - 198) | 13.5 (1 - 198) | 34.4 (1 - 172) | 26.1 (2 - 134) | 37.0 (2 - 167) | 0.004 |
| Primary trigger for MBC diagnosis | ||||||
| Subjective symptoms | 123 (42%) | 44 (96%) | 13 (15%) | 14 (23%) | 52 (51%) | < 0.001 |
| Regular surveillance | 172 (58%) | 2 (4%) | 75 (85%) | 46 (77%) | 49 (49%) | |
| Unknown | 14 | 3 | 3 | 4 | 4 | |
| Clinicopathological factors | N | Univariate analysis | Multivariable analysis | ||||
|---|---|---|---|---|---|---|---|
| HR | 95% CI | P value | HR | 95% CI | P value | ||
| HR: hazard ratio; 95% CI: 95% confidence interval; MBC: metastatic breast cancer; HER2: human epidermal growth factor receptor 2. | |||||||
| Age at MBC diagnosis | 309 | 1.01 | 1.00 - 1.03 | 0.020 | 1.03 | 1.01 - 1.04 | < 0.001 |
| Menopausal status at MBC diagnosis | |||||||
| Premenopausal | 78 | Reference | |||||
| Postmenopausal | 231 | 1.07 | 0.75 - 1.52 | 0.719 | |||
| Histological type | |||||||
| Invasive ductal carcinoma | 266 | Reference | |||||
| Others | 43 | 1.29 | 0.86 - 1.94 | 0.213 | |||
| Nuclear grade | |||||||
| Grade 1/2 | 141 | Reference | |||||
| Grade 3 | 76 | 2.27 | 1.56 - 3.31 | < 0.001 | |||
| Ki67 labeling index | |||||||
| Low (≤ 20%) | 62 | Reference | Reference | ||||
| High (> 20%) | 165 | 1.28 | 0.86 - 1.92 | 0.224 | 1.35 | 0.86 - 2.11 | 0.189 |
| Molecular subtypes | |||||||
| Luminal | 181 | Reference | Reference | ||||
| Luminal-HER2 | 32 | 1.44 | 0.89 - 2.32 | 0.134 | 1.36 | 0.72 - 2.58 | 0.349 |
| HER2-enriched | 30 | 1.18 | 0.69 - 2.01 | 0.545 | 0.74 | 0.37 - 1.49 | 0.398 |
| Triple-negative | 66 | 2.82 | 2.00 - 3.97 | < 0.001 | 3.05 | 1.96 - 4.74 | < 0.001 |
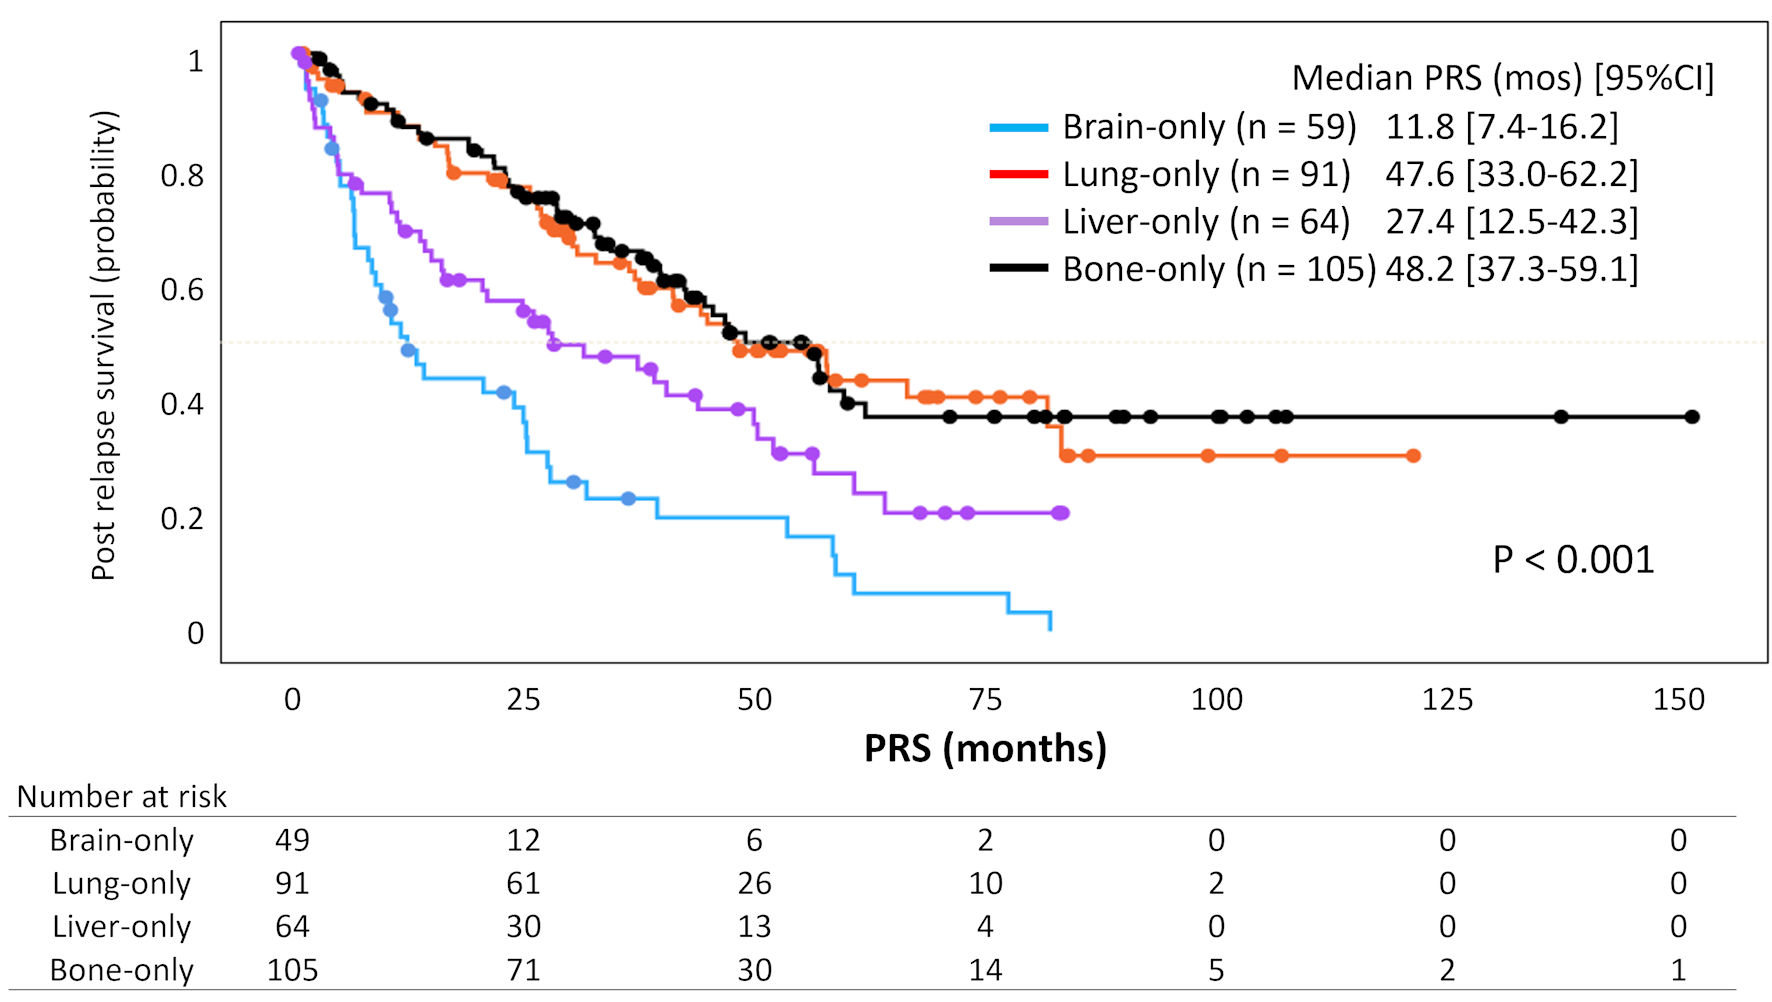
| Organs of initial distant recurrence | |||||||
| Bones | 105 | Reference | Reference | ||||
| Lungs | 91 | 1.07 | 0.72 - 1.60 | 0.741 | 1.55 | 0.90 - 2.66 | 0.111 |
| Liver | 64 | 1.86 | 1.23 - 2.81 | 0.003 | 2.78 | 1.54 - 5.03 | < 0.001 |
| Brain | 49 | 3.48 | 2.29 - 5.29 | < 0.001 | 2.89 | 1.60 - 5.22 | < 0.001 |
| Primary trigger for MBC diagnosis | |||||||
| Regular surveillance | 172 | Reference | Reference | ||||
| Subjective symptoms | 123 | 2.17 | 1.59 - 2.95 | < 0.001 | 2.13 | 1.30 - 3.51 | 0.003 |
| Clinicopathological factors | Brain-only | Lung-only | Liver-only | Bone-only | ||||||||||||
|---|---|---|---|---|---|---|---|---|---|---|---|---|---|---|---|---|
| N | HR | 95% CI | P value | N | HR | 95% CI | P value | N | HR | 95% CI | P value | N | HR | 95% CI | P value | |
| HR: hazard ratio; 95% CI: 95% confidence interval; MBC: metastatic breast cancer; HER2: human epidermal growth factor receptor 2; NA: not available. | ||||||||||||||||
| Age at MBC diagnosis | 49 | 1.02 | 0.99 - 1.05 | 0.139 | 91 | 1.03 | 1.00 - 1.05 | 0.033 | 64 | 1.01 | 0.98 - 1.03 | 0.652 | 105 | 1.02 | 0.99 - 1.04 | 0.154 |
| Histological type | ||||||||||||||||
| Invasive ductal carcinoma | 45 | Reference | 76 | Reference | 58 | Reference | 87 | Reference | ||||||||
| Others | 4 | 0.60 | 0.18 - 1.96 | 0.396 | 15 | 0.99 | 0.44 - 2.21 | 0.971 | 6 | 1.73 | 0.67 - 4.46 | 0.254 | 18 | 2.30 | 1.22 - 4.33 | 0.010 |
| Nuclear grade | ||||||||||||||||
| Grade 1/2 | 11 | Reference | 33 | Reference | 30 | Reference | 67 | Reference | ||||||||
| Grade 3 | 12 | 2.58 | 0.95 - 7.05 | 0.064 | 29 | 2.79 | 1.27 - 6.13 | 0.011 | 21 | 1.87 | 0.92 - 3.79 | 0.084 | 14 | 1.62 | 0.73 - 3.62 | 0.238 |
| Ki67 labeling index | ||||||||||||||||
| Low (≤ 20%) | 9 | Reference | 9 | Reference | 20 | Reference | 25 | Reference | ||||||||
| High (> 20%) | 25 | 1.11 | 0.47 - 2.63 | 0.811 | 64 | 2.35 | 0.72 - 7.67 | 0.158 | 29 | 1.87 | 0.85 - 4.10 | 0.119 | 46 | 0.85 | 0.41 - 1.74 | 0.655 |
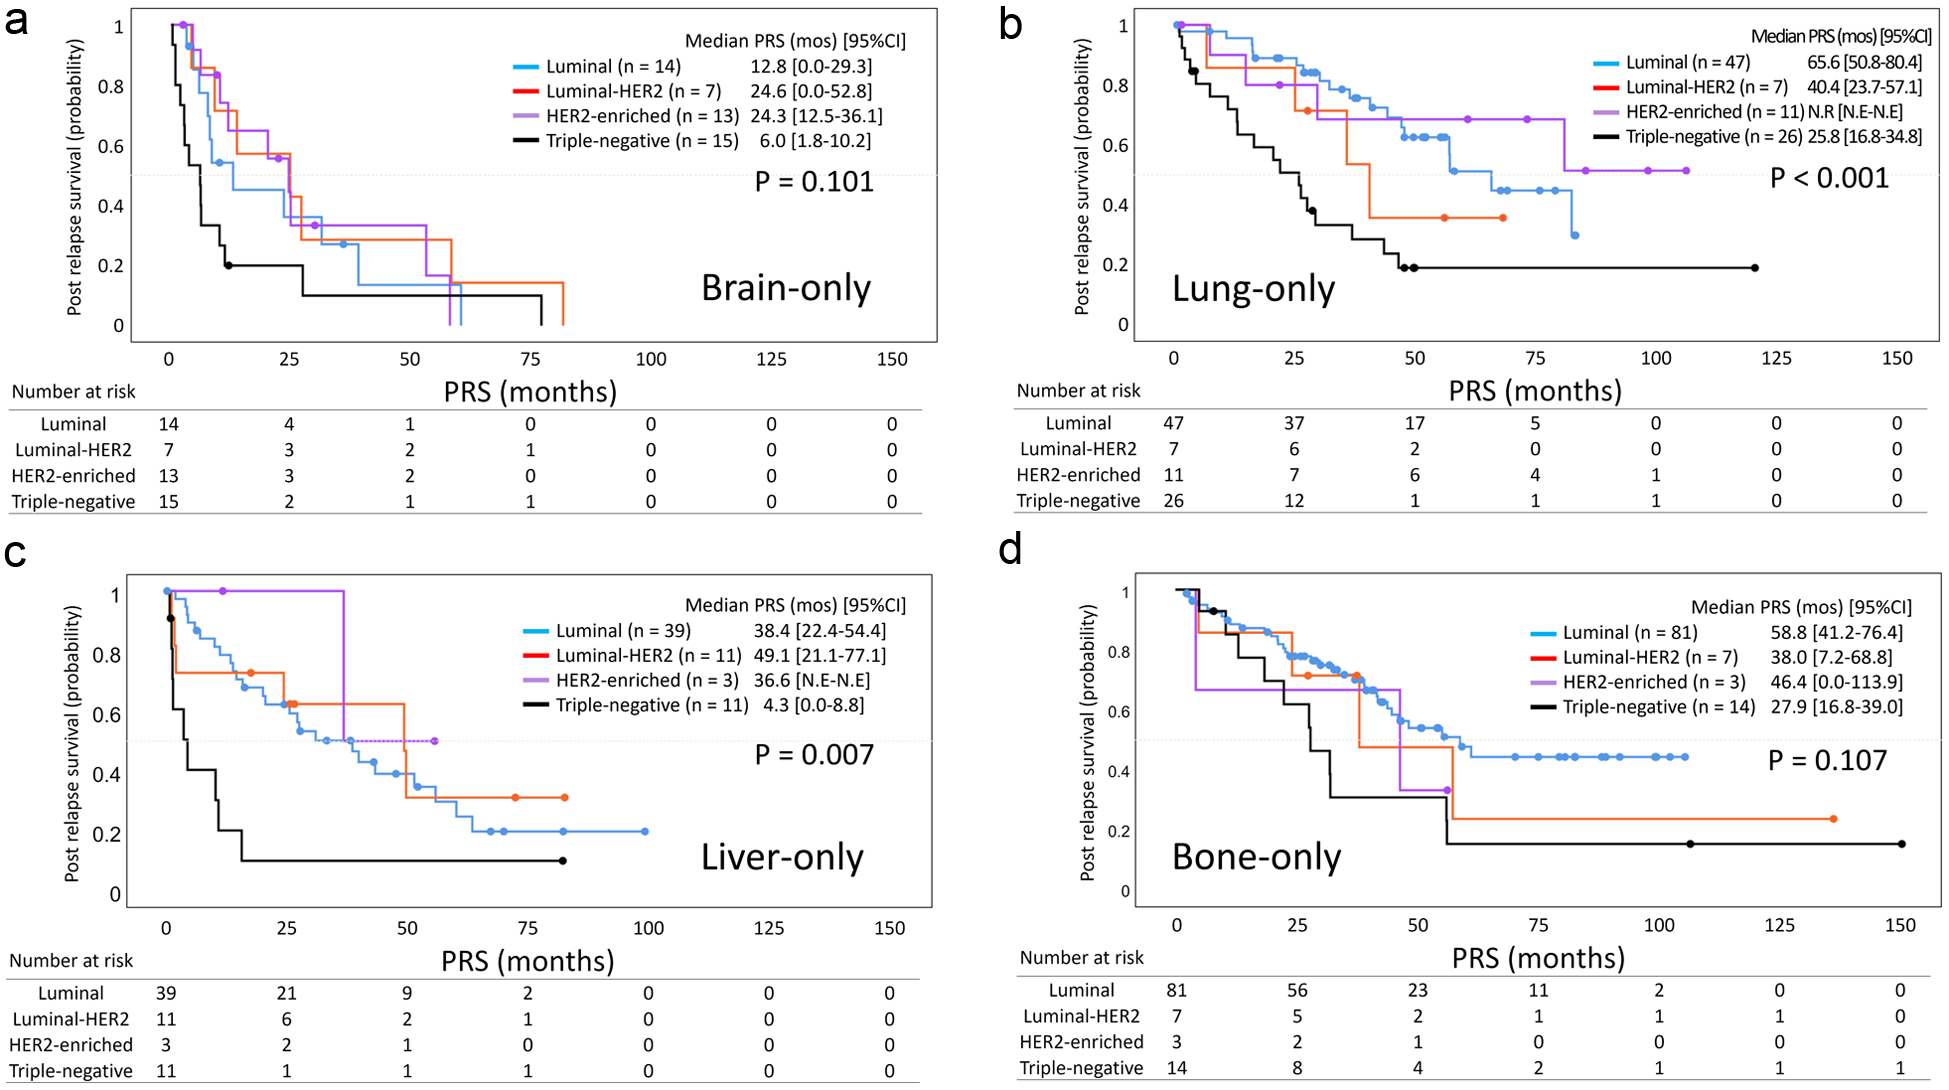
| Molecular subtypes | ||||||||||||||||
| Luminal | 14 | Reference | 47 | Reference | 39 | Reference | 81 | Reference | ||||||||
| Luminal - HER2 | 7 | 0.69 | 0.25 - 1.90 | 0.476 | 7 | 1.77 | 0.60 - 5.24 | 0.304 | 11 | 0.86 | 0.35 - 2.10 | 0.738 | 7 | 1.42 | 0.50 - 4.02 | 0.507 |
| HER2 - enriched | 13 | 0.82 | 0.34 - 1.98 | 0.654 | 11 | 0.77 | 0.26 - 2.32 | 0.642 | 3 | 0.48 | 0.06 - 3.52 | 0.467 | 3 | 1.58 | 0.38 - 6.62 | 0.531 |
| Triple - negative | 15 | 1.87 | 0.84 - 4.18 | 0.126 | 26 | 3.37 | 1.75 - 6.48 | < 0.001 | 11 | 3.19 | 1.46 - 6.94 | 0.004 | 14 | 2.29 | 1.15 - 4.54 | 0.018 |
| Primary trigger for MBC diagnosis | ||||||||||||||||
| Regular surveillance | 2 | Reference | 75 | Reference | 46 | Reference | 49 | Reference | ||||||||
| Subjective symptoms | 44 | 1.30 | 0.31 - 5.48 | 0.721 | 13 | 5.04 | 2.32 - 10.98 | < 0.001 | 14 | 3.34 | 1.53 - 7.27 | 0.002 | 52 | 1.37 | 0.77 - 2.45 | 0.290 |
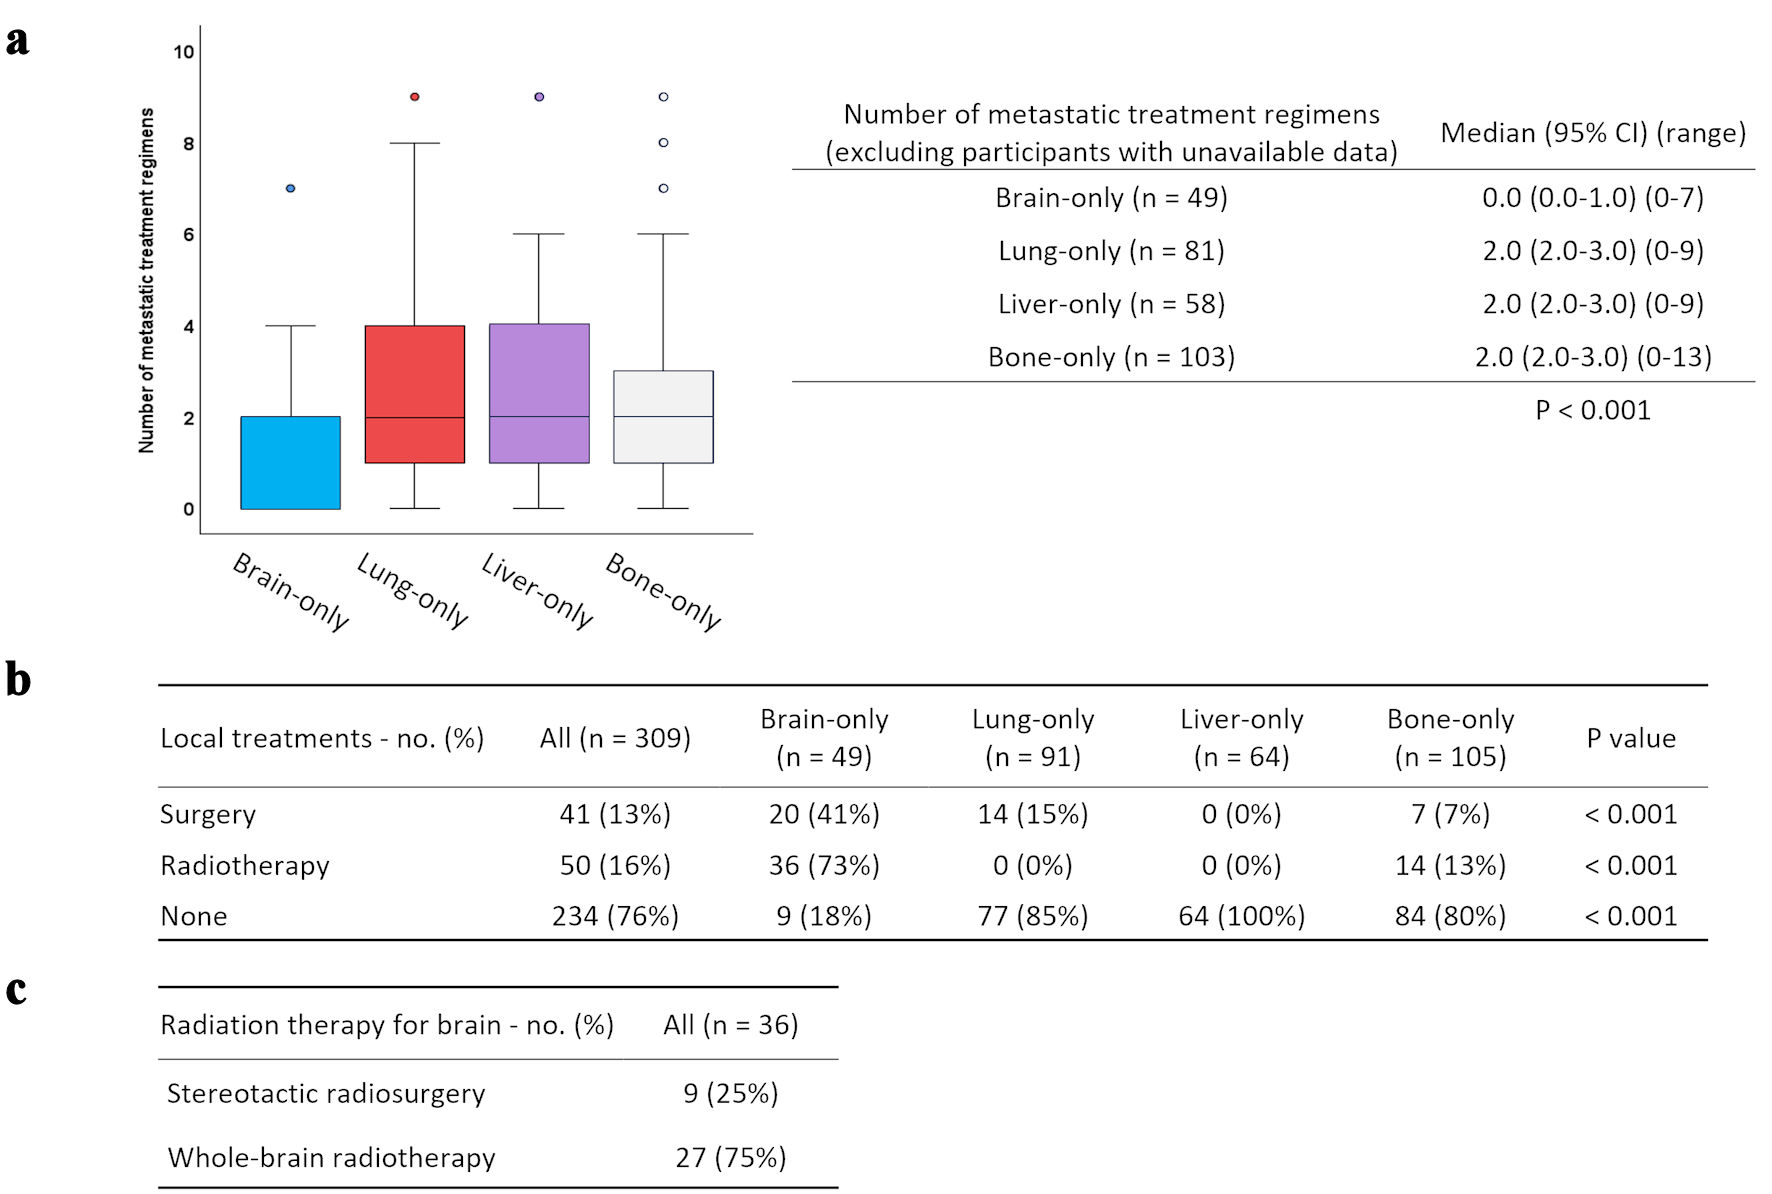
| Local treatment for initial MBC | ||||||||||||||||
| Yes | 40 | Reference | 14 | Reference | 0 | Reference | 21 | Reference | ||||||||
| No | 9 | 2.16 | 0.98 - 4.78 | 0.057 | 77 | 2.95 | 1.05 - 8.27 | 0.039 | 64 | NA | NA | NA | 84 | 0.45 | 0.25 - 0.83 | 0.011 |