Figures
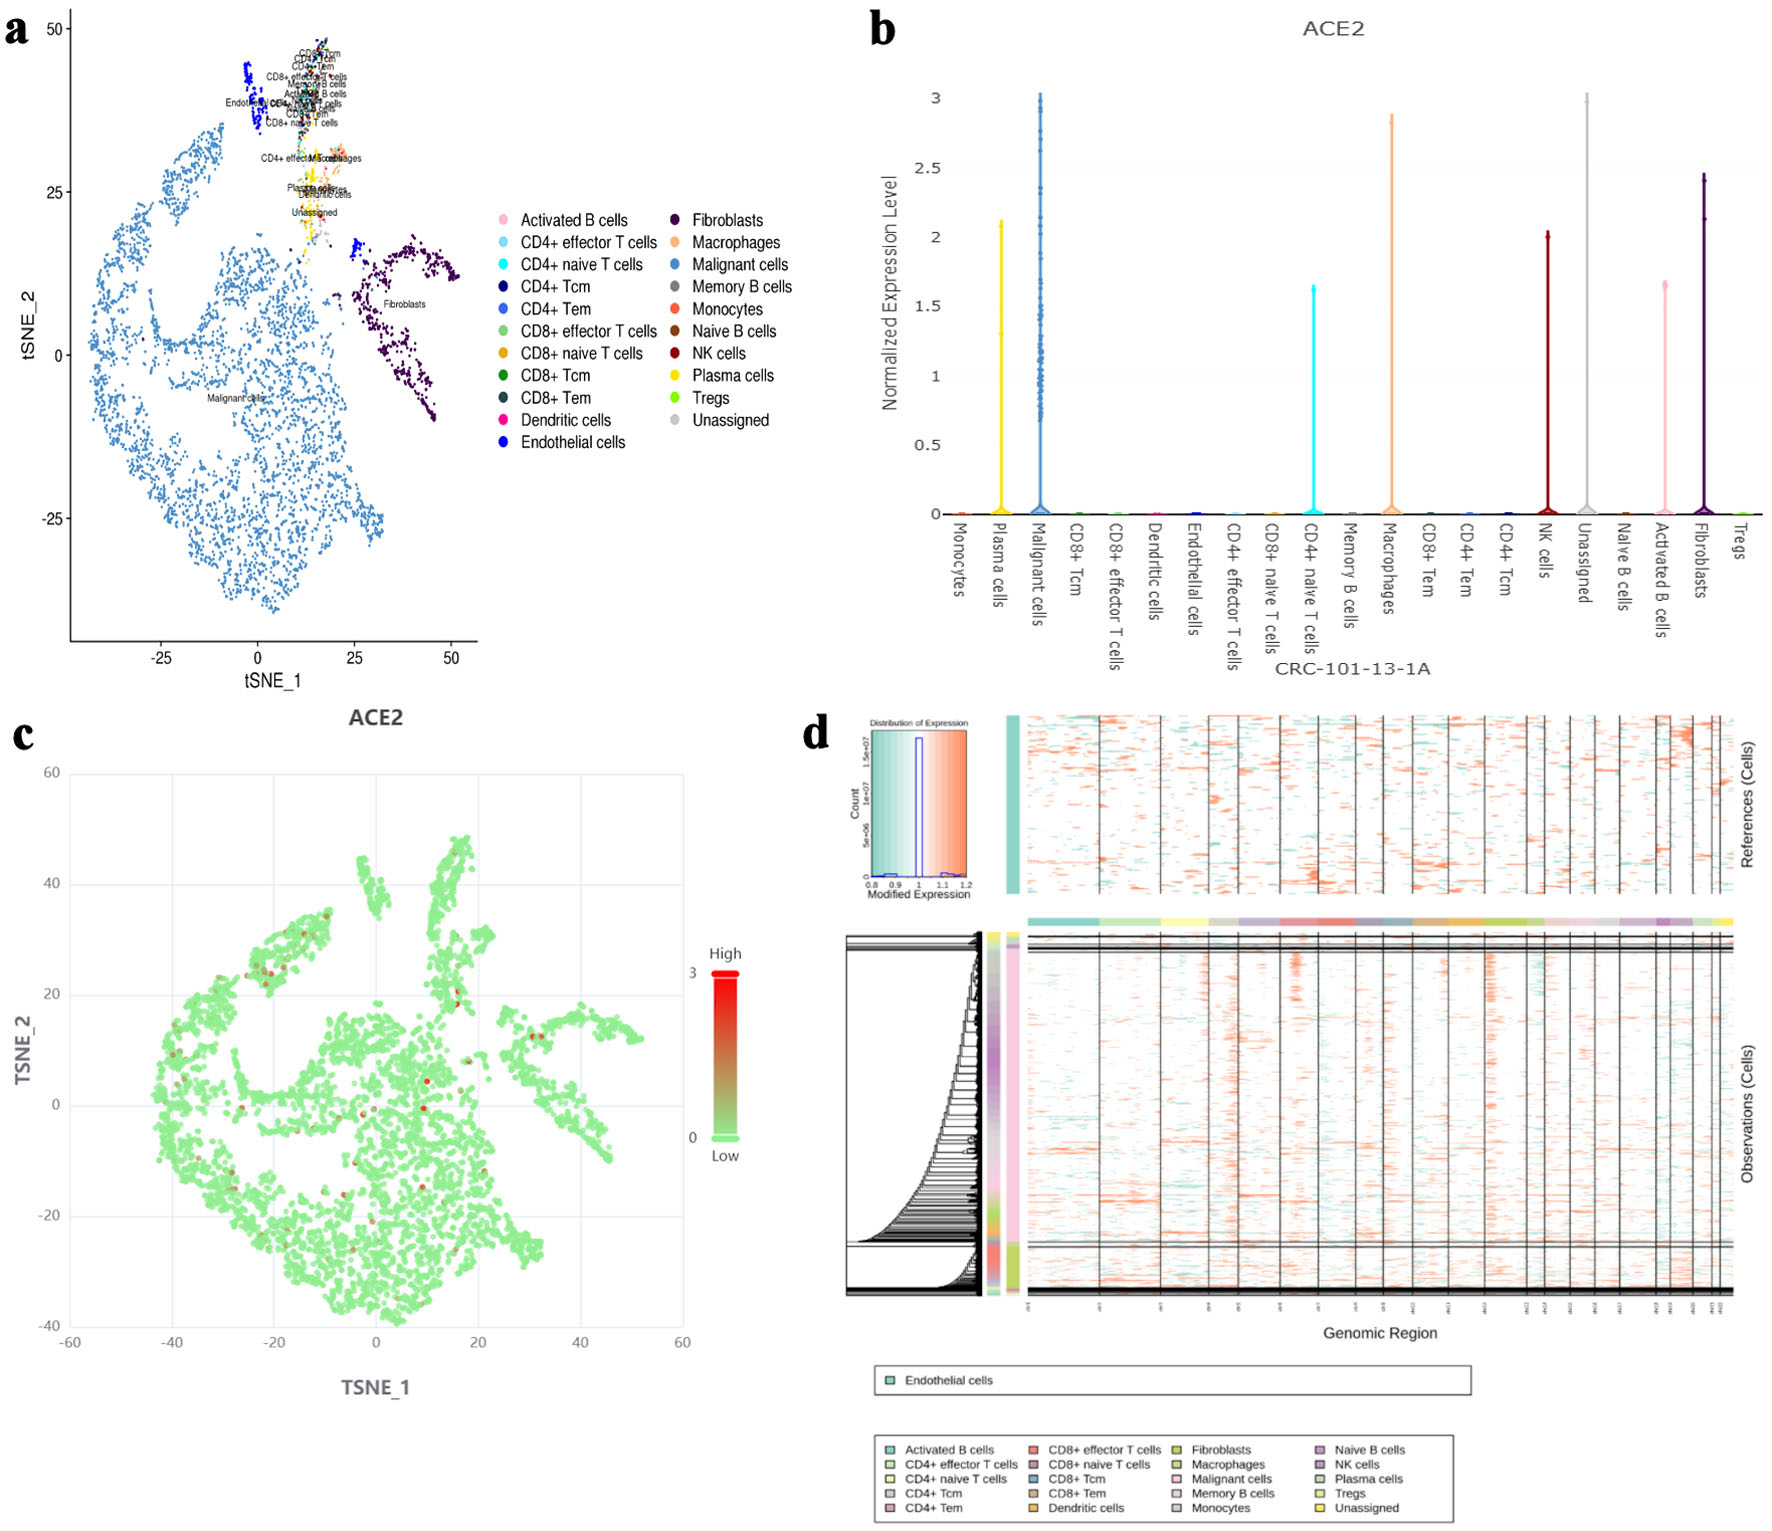
↓ Figure 1. The expression level of ACE2 protein
in different cell types based on single-cell RNA sequencing. (a) t-SNE plot showing the distribution of
various cell types (activated B cells, fibroblasts, CD4+ naive T cells, macrophages,
CD4+ effector T cells, malignant cells, memory B cells, monocytes, naive B cells, plasma
cells, Tregs, unassigned) in the dataset. (b) Bar chart representing the normalized expression level of
ACE2 protein across different cell types. (c) t-SNE plot highlighting ACE2 expression levels, with red
dots indicating higher expression and green dots indicating lower expression. (d) InferCNV analysis for
malignancy assessment, with a color gradient indicating expression levels and malignancy likelihood.
ACE2: angiotensin-converting enzyme 2; t-SNE: t-distributed stochastic neighbor embedding; Tregs:
regulatory T cells; CRC: colorectal cancer; NK: natural killer.
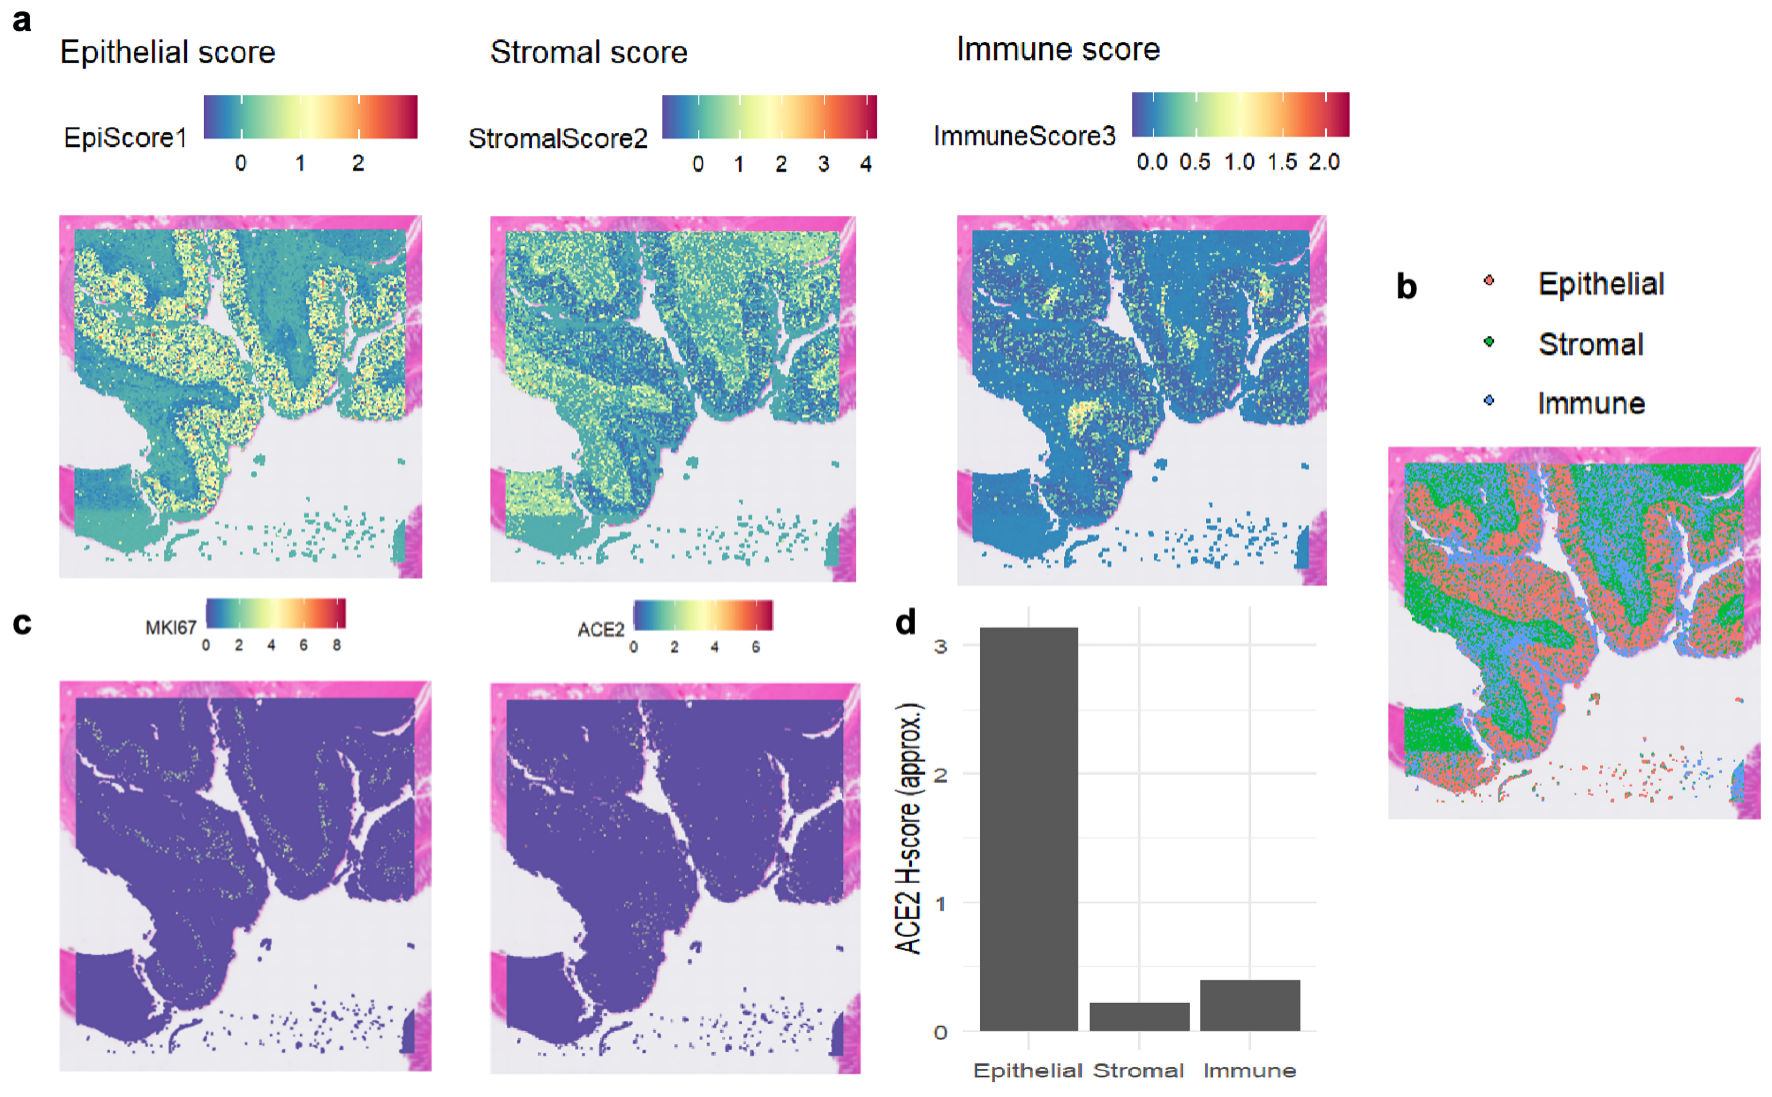
↓ Figure 2. The expression levels of MKI67 and
ACE2 proteins in colon tissue based on spatial transcriptomics. (a) Heat maps depicting regional scores
of epithelial cells, stromal cells, and immune cells, illustrating the distribution of each
component’s score. (b) Spatial distribution of epithelial cells, stromal cells, and immune cells,
with different colors labeling the locations of the three cell components. (c) Heat maps showing the
spatial distribution of MKI67 and ACE2 gene expression, where colors correspond to gene
expression levels. (d) Bar chart of ACE2 H-scores in epithelial, stromal, and immune cells, comparing
ACE2 expression levels across the three cell components. ACE2: angiotensin-converting enzyme 2; MKI67:
marker of proliferation Ki-67.
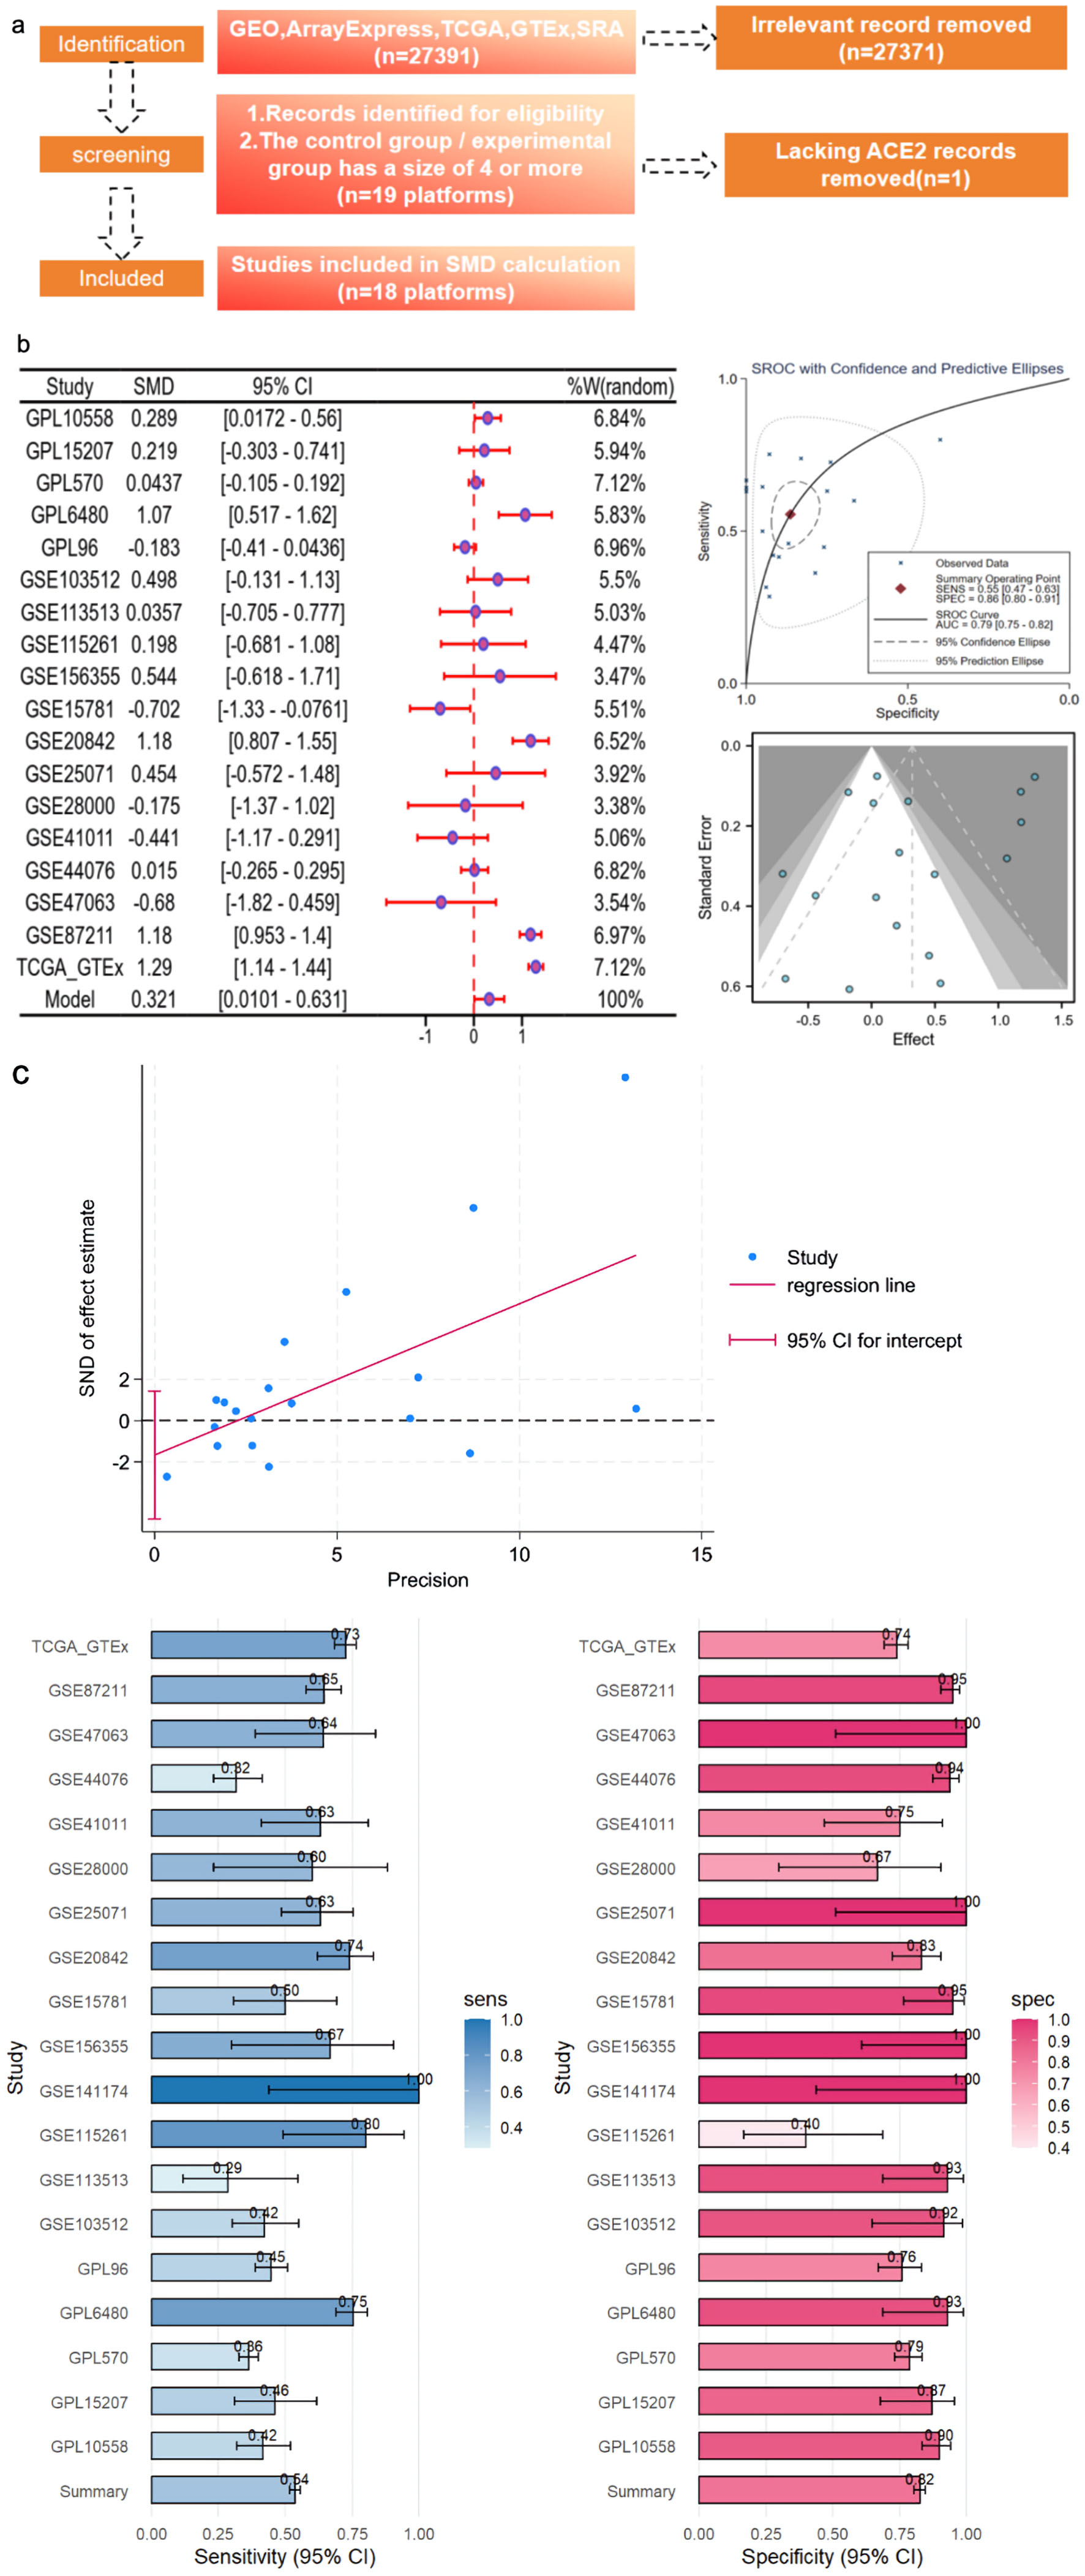
↓ Figure 3. CRC ACE2 mRNA samples were obtained
from a multicenter high-throughput dataset, including 2,275 CRC samples and 1,269 non-CRC colorectal
samples. (a) Flow plot. (b) ACE2 expression in bulk mRNA data. (c) Egger’s test: detection of
publication bias (P = 0.027); sensitivity and specificity analysis. ACE2: angiotensin-converting enzyme
2; AUC: area under the curve; CRC: colorectal cancer; GEO: Gene Expression Omnibus; TCGA: The Cancer
Genome Atlas; SMD: standardized mean difference; SROC: summary receiver operating characteristic; CI:
confidence interval; GTEx: Genotype Expression.
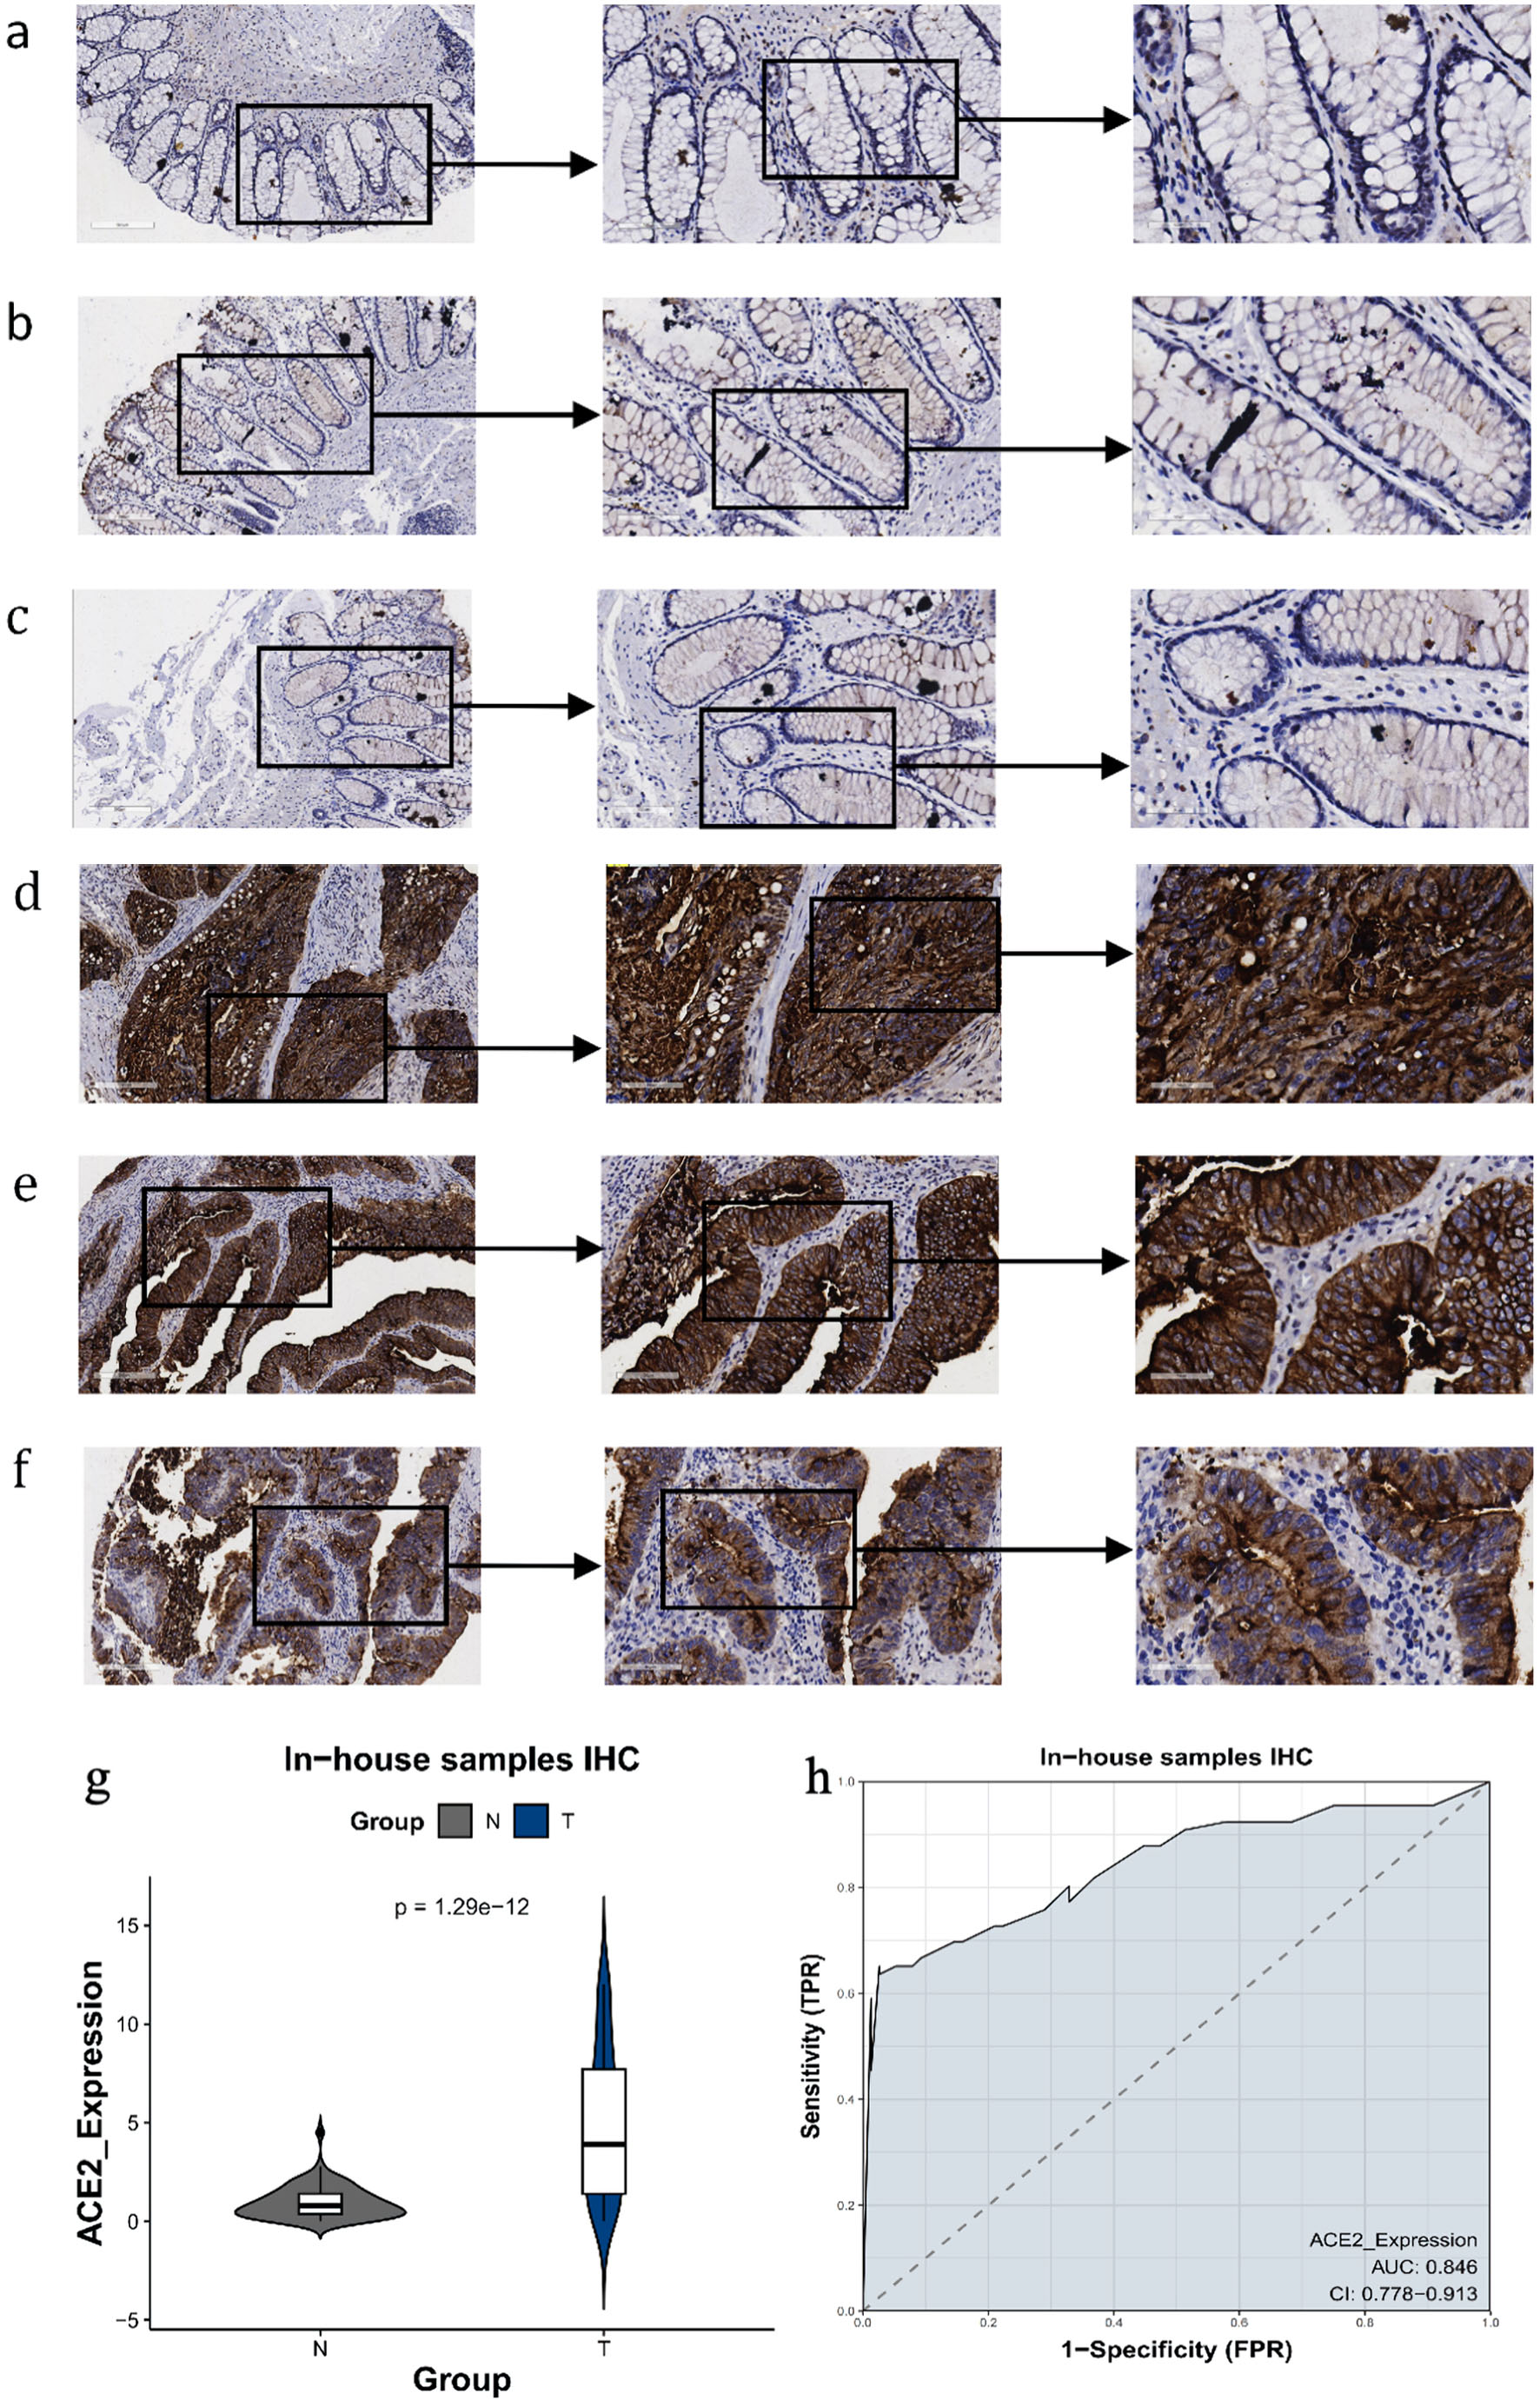
↓ Figure 4. The expression level of ACE2 protein
in CRC and peritumor colon tissues based on IHC. (a-c) Representative images of ACE2 protein expression
in peritumor colon tissues. (d-f) Representative images of ACE2 protein expression in CRC tissues. In
panels (a-f), the magnifications of the three images of each panel are 100, 200, and 400 respectively.
(g) ACE2 protein expression (P = 1.29 × 10⁻¹²). (h) Receiver operating characteristic
(ROC) curve with area under the curve (AUC) of ACE2 protein expression in CRC tissues. ACE2:
angiotensin-converting enzyme 2; CRC: colorectal cancer; IHC: immunohistochemistry; TPR: true positive
rate; FPR: false positive rate.
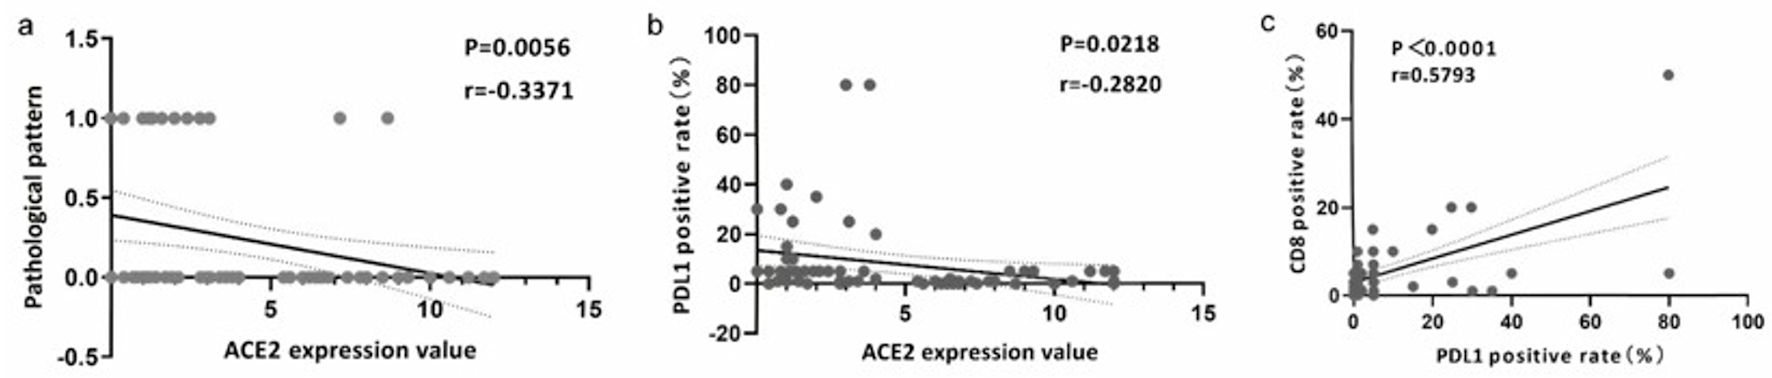
↓ Figure 5. The expression of ACE2 was associated
with CD8 and PD-L1. (a) Correlation analysis of ACE2 expression value and pathological pattern. (b)
Correlation analysis of ACE2 expression value and PD-L1 positive rate (%). (c) Correlation analysis of
PD-L1 and CD8 positive rate (%). ACE2: angiotensin-converting enzyme 2; PD-L1: programmed death ligand
1.
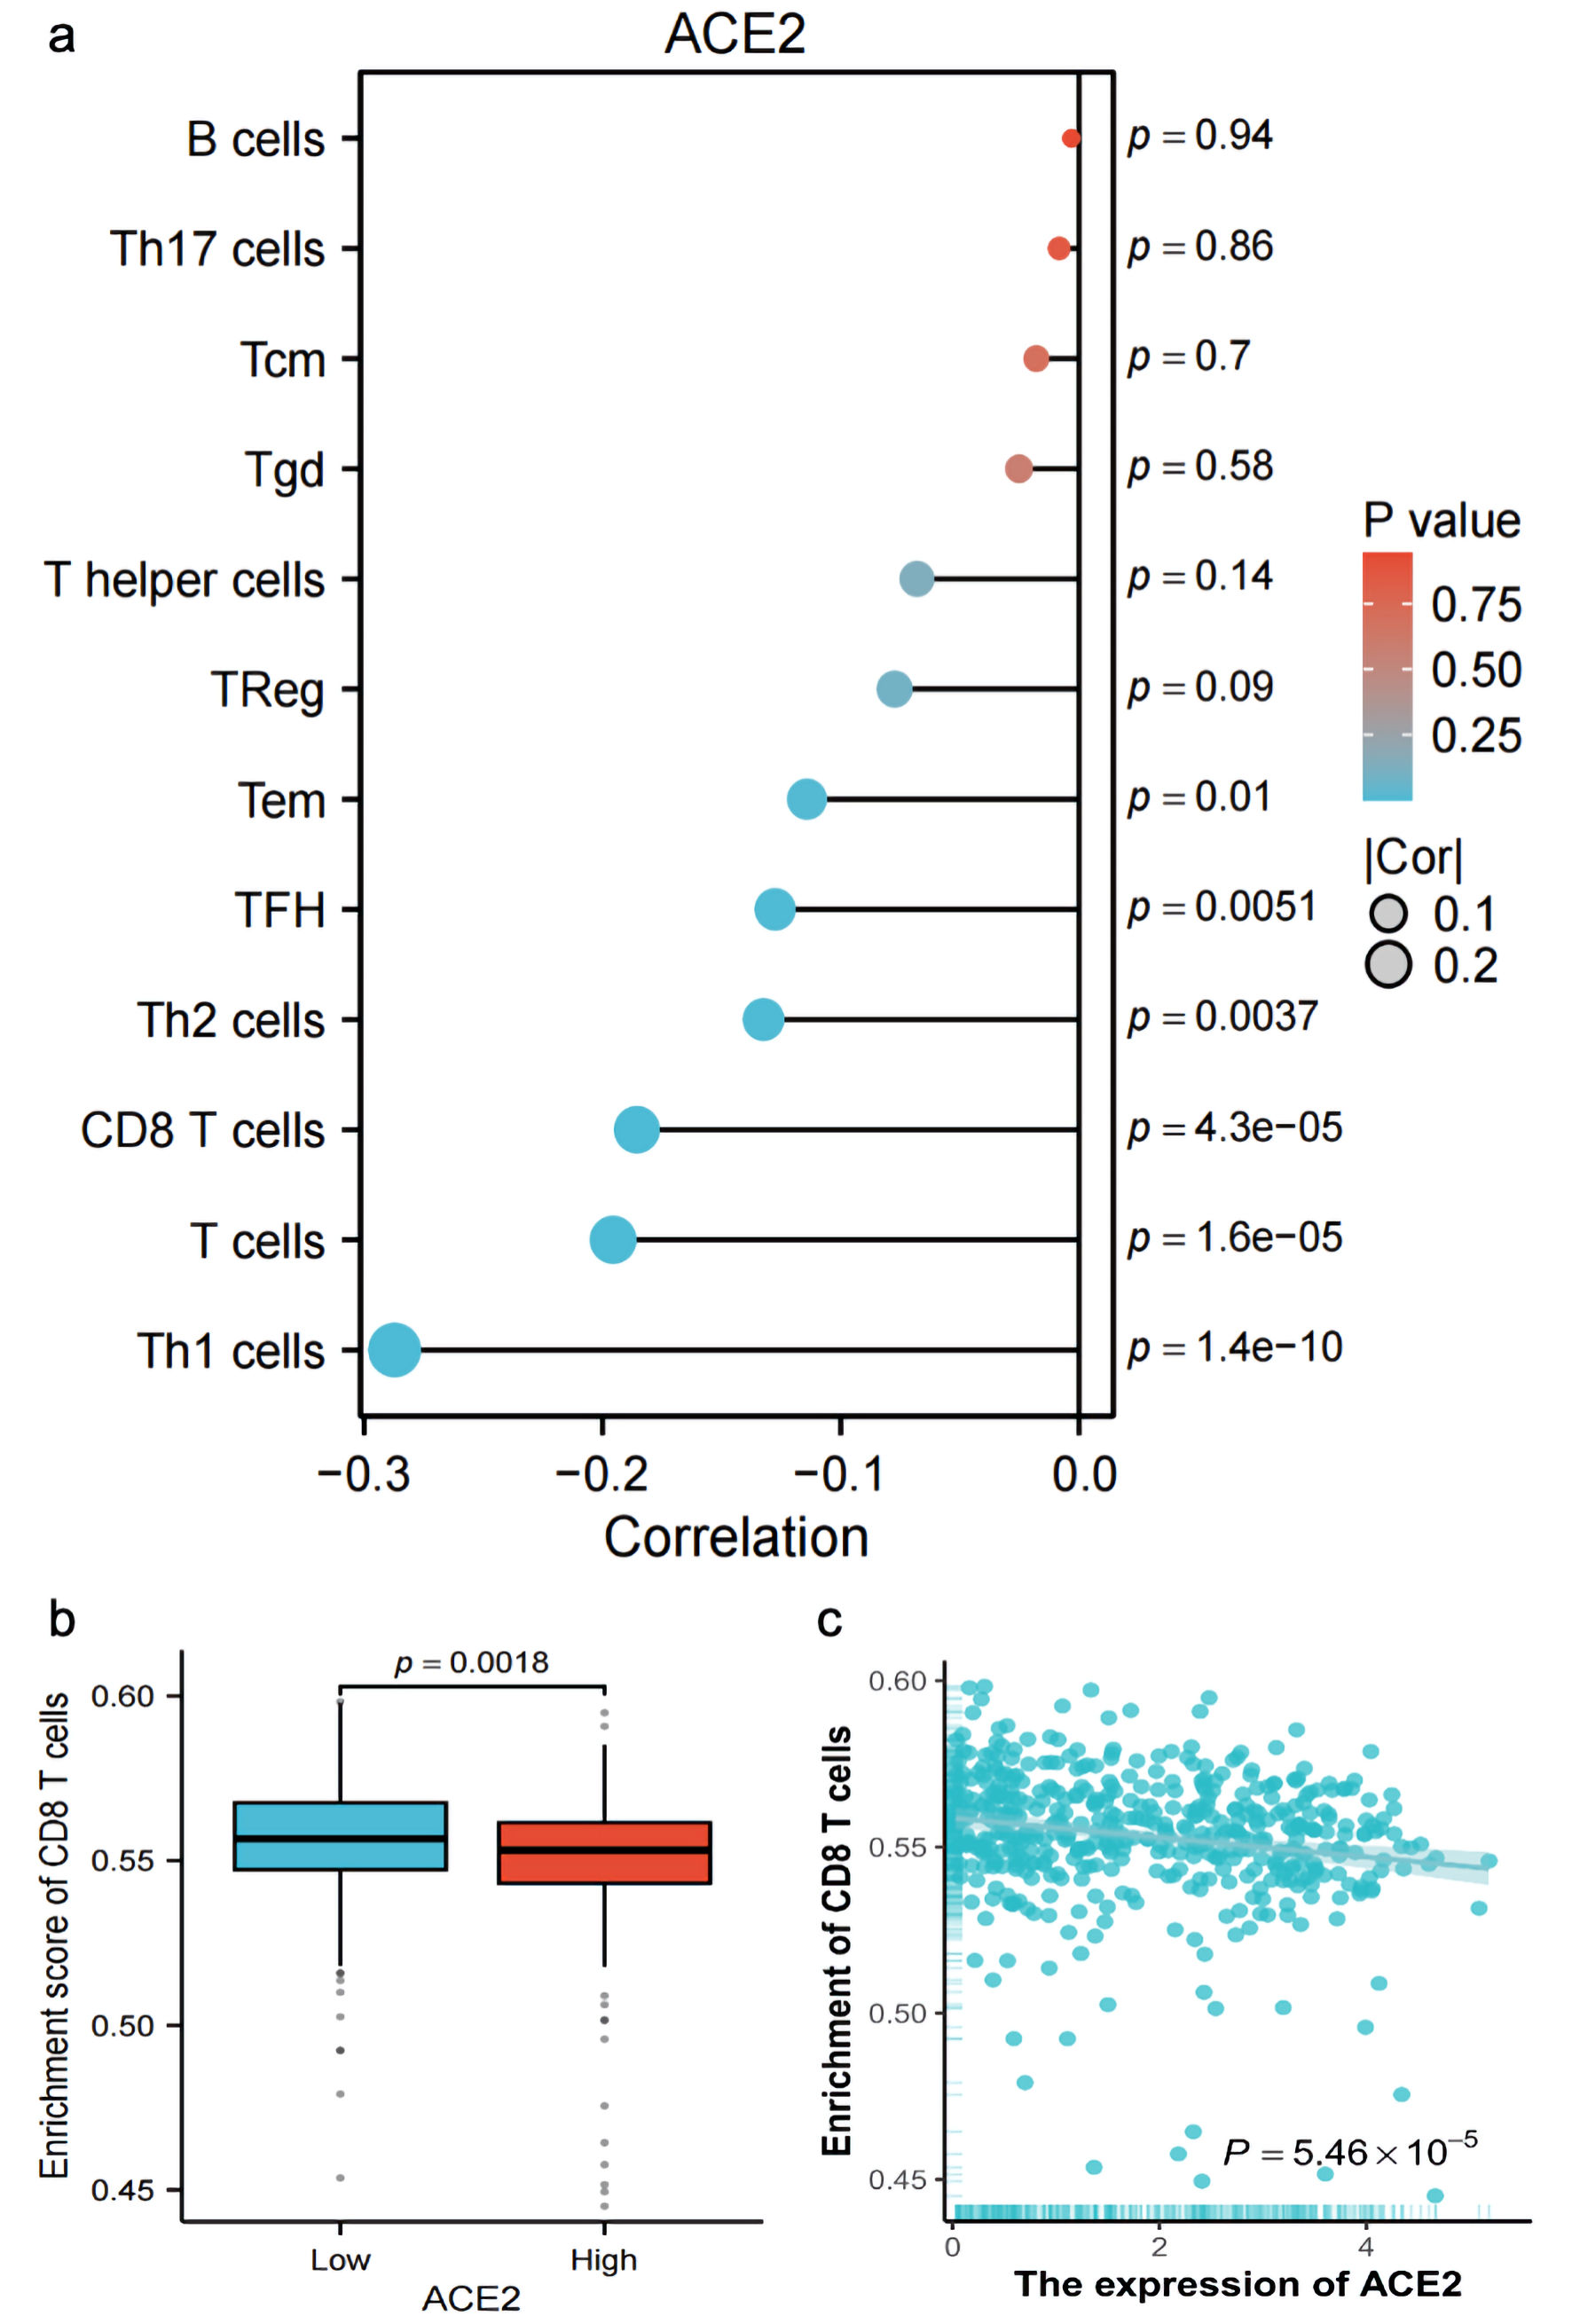
↓ Figure 6. Correlation and enrichment analysis
of ACE2 expression with immune cell types and CD8 T cell activity. (a) Bar plot showing the correlation
(R) and P value of ACE2 expression with various immune cell types (Th1 cells, T cells, CD8 T cells, Th2
cells, TFH, Tem, Treg, T helper cells, Tgd, Tcm, Th17 cells, B cells), with color indicating P value
significance. (b) Box plot comparing the enrichment score of CD8 T cells between low and high ACE2
expression groups (P = 0.0018). (c) Scatter plot showing the relationship between ACE2 expression
(Log2(TPM + 1)) and CD8 T-cell enrichment score, with Spearman correlation (R = -0.186, P =
5.46 × 10⁻⁵). ACE2: angiotensin-converting enzyme 2; Tcm: T central memory; Tem: T
effector memory; TFH: T follicular helper; Tgd: T gamma delta; Th1: T helper 1; Th17: T helper 17; Th2:
T helper 2; Tregs: regulatory T cells; TPM: transcripts per million.
Tables
↓ Table 1. The Datasets Used in the Research
|
Study |
Non-CRC |
CRC
|
| CRC: colorectal cancer; TCGA: The Cancer Genome Atlas; GTEx: Genotype Expression. |
| GPL10558 |
129 |
89 |
| GPL15207 |
23 |
37 |
| GPL570 |
239 |
645 |
| GPL6480 |
14 |
206 |
| GPL96 |
104 |
268 |
| GSE103512 |
12 |
57 |
| GSE113513 |
14 |
14 |
| GSE115261 |
10 |
10 |
| GSE141174 |
3 |
3 |
| GSE156355 |
6 |
6 |
| GSE15781 |
20 |
22 |
| GSE20842 |
65 |
65 |
| GSE25071 |
4 |
46 |
| GSE28000 |
6 |
5 |
| GSE41011 |
12 |
19 |
| GSE44076 |
98 |
98 |
| GSE47063 |
4 |
14 |
| GSE87211 |
160 |
203 |
| TCGA_GTEx |
349 |
471 |
↓ Table 2. The Relationships of ACE2 Expression With the Clinicopathologic
Parameters by Interpretation of the Immunohistochemistry
| Clinicopathological features |
ACE2 expression |
| N
|
Mean
|
SD
|
P
(t) |
t/F
|
| BRAF: B-Raf proto-oncogene, serine/threonine kinase; KRAS: Kirsten rat
sarcoma viral oncogene homolog; NRAS: neuroblastoma RAS viral oncogene homolog; ACE2:
angiotensin-converting enzyme 2; SD: standard deviation; P (t): P value from t-test; t/F:
t-statistic/F-statistic. |
| Tissue |
|
|
|
|
|
| Non-cancer |
75 |
0.973 |
0.803 |
< 0.001 |
-8.262 |
| Cancer |
66 |
4.917 |
3.804 |
|
|
| Gender |
|
|
|
|
|
| Male |
34 |
4.069 |
3.756 |
0.547 |
-0.675 |
| Female |
32 |
5.244 |
3.886 |
|
|
| Age |
|
|
|
|
|
| < 60 years |
16 |
3.769 |
3.685 |
0.594 |
-1.322 |
| ≥ 60 years |
46 |
5.235 |
3.865 |
|
|
| Tumor stage |
|
|
|
|
|
| T1 - T2 |
7 |
5.629 |
4.129 |
0.924 |
0.521 |
| T3 - T4 |
59 |
4.832 |
3.792 |
|
|
| Node stage |
|
|
|
|
|
| N0 |
42 |
5.224 |
3.773 |
0.993 |
0.866 |
| N1 - N2 |
24 |
4.379 |
3.877 |
|
|
| Metastasis stage |
|
|
|
|
|
| M0 |
62 |
5.024 |
3.719 |
0.441 |
0.903 |
| M1 |
4 |
3.25 |
5.318 |
|
|
| Pathological stage |
|
|
|
|
|
| Stage I - II |
56 |
5.155 |
3.805 |
0.527 |
1.211 |
| Stage III - IV |
10 |
3.58 |
3.699 |
|
|
| Pathological type |
|
|
|
|
|
| Tubular |
52 |
5.577 |
3.832 |
0.008 |
3.603 |
| Mucinous |
14 |
2.464 |
2.548 |
|
|
| Vascular invasion |
|
|
|
|
|
| No |
59 |
4.59 |
3.689 |
0.395 |
-2.078 |
| Yes |
7 |
7.671 |
3.907 |
|
|
| Neurological invasion |
|
|
|
|
|
| No |
59 |
4.649 |
3.848 |
0.033 |
-2.265 |
| Yes |
7 |
7.171 |
2.632 |
|
|
| Tumor nodule |
|
|
|
|
|
| Single |
58 |
4.978 |
3.846 |
0.824 |
0.171 |
| Multiple |
7 |
4.714 |
3.917 |
|
|
| Tumor size (cm) |
|
|
|
|
|
| < 5 |
32 |
5.216 |
3.567 |
0.374 |
0.617 |
| ≥ 5 |
34 |
4.635 |
4.047 |
|
|
| BRAF mutation (V600E) |
|
|
|
|
|
| No |
61 |
5.095 |
3.846 |
0.066 |
1.339 |
| Yes |
5 |
2.74 |
2.599 |
|
|
| KRAS mutation |
|
|
|
|
|
| No |
44 |
4.739 |
3.919 |
0.522 |
-0.535 |
| Yes |
22 |
5.273 |
3.623 |
|
|
| NRAS mutation (G12C/D/S) |
|
|
|
|
|
| No |
63 |
4.881 |
3.801 |
0.938 |
-0.347 |
| Yes |
3 |
5.667 |
4.623 |
|
|
| NRAS mutation (Q61R/L/H/K) |
|
|
|
|
|
| No |
62 |
5.094 |
3.837 |
0.04 |
2.785 |
| Yes |
4 |
2.175 |
1.855 |
|
|