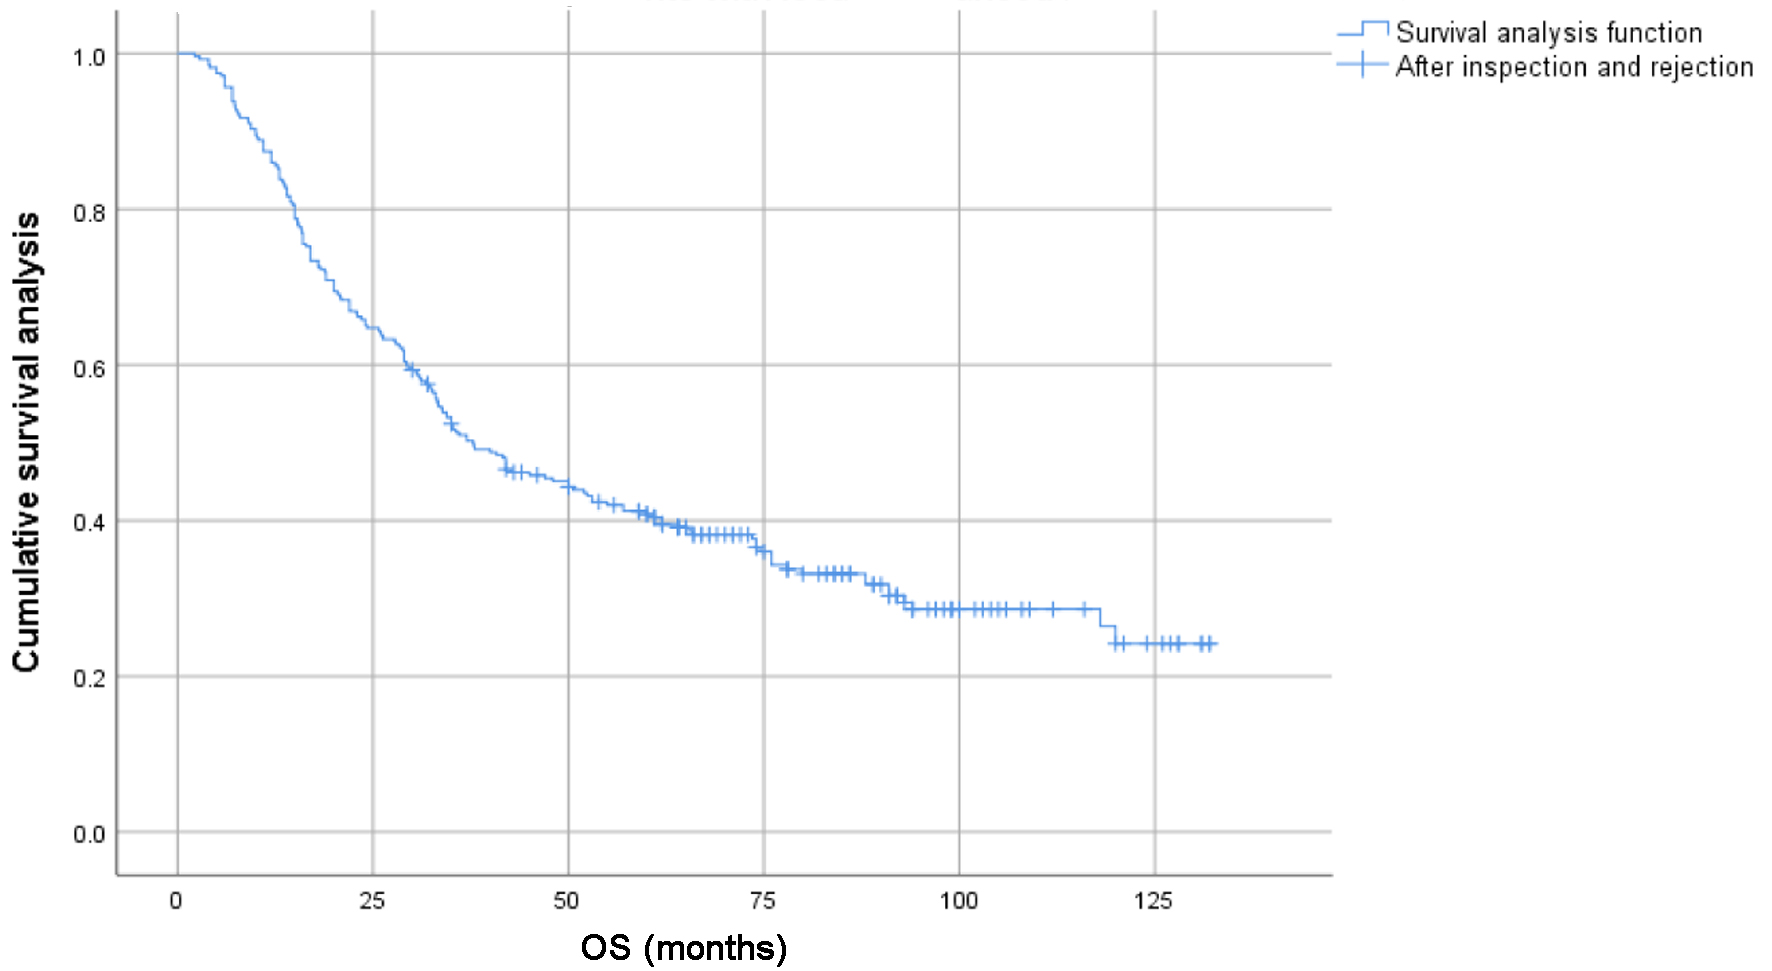
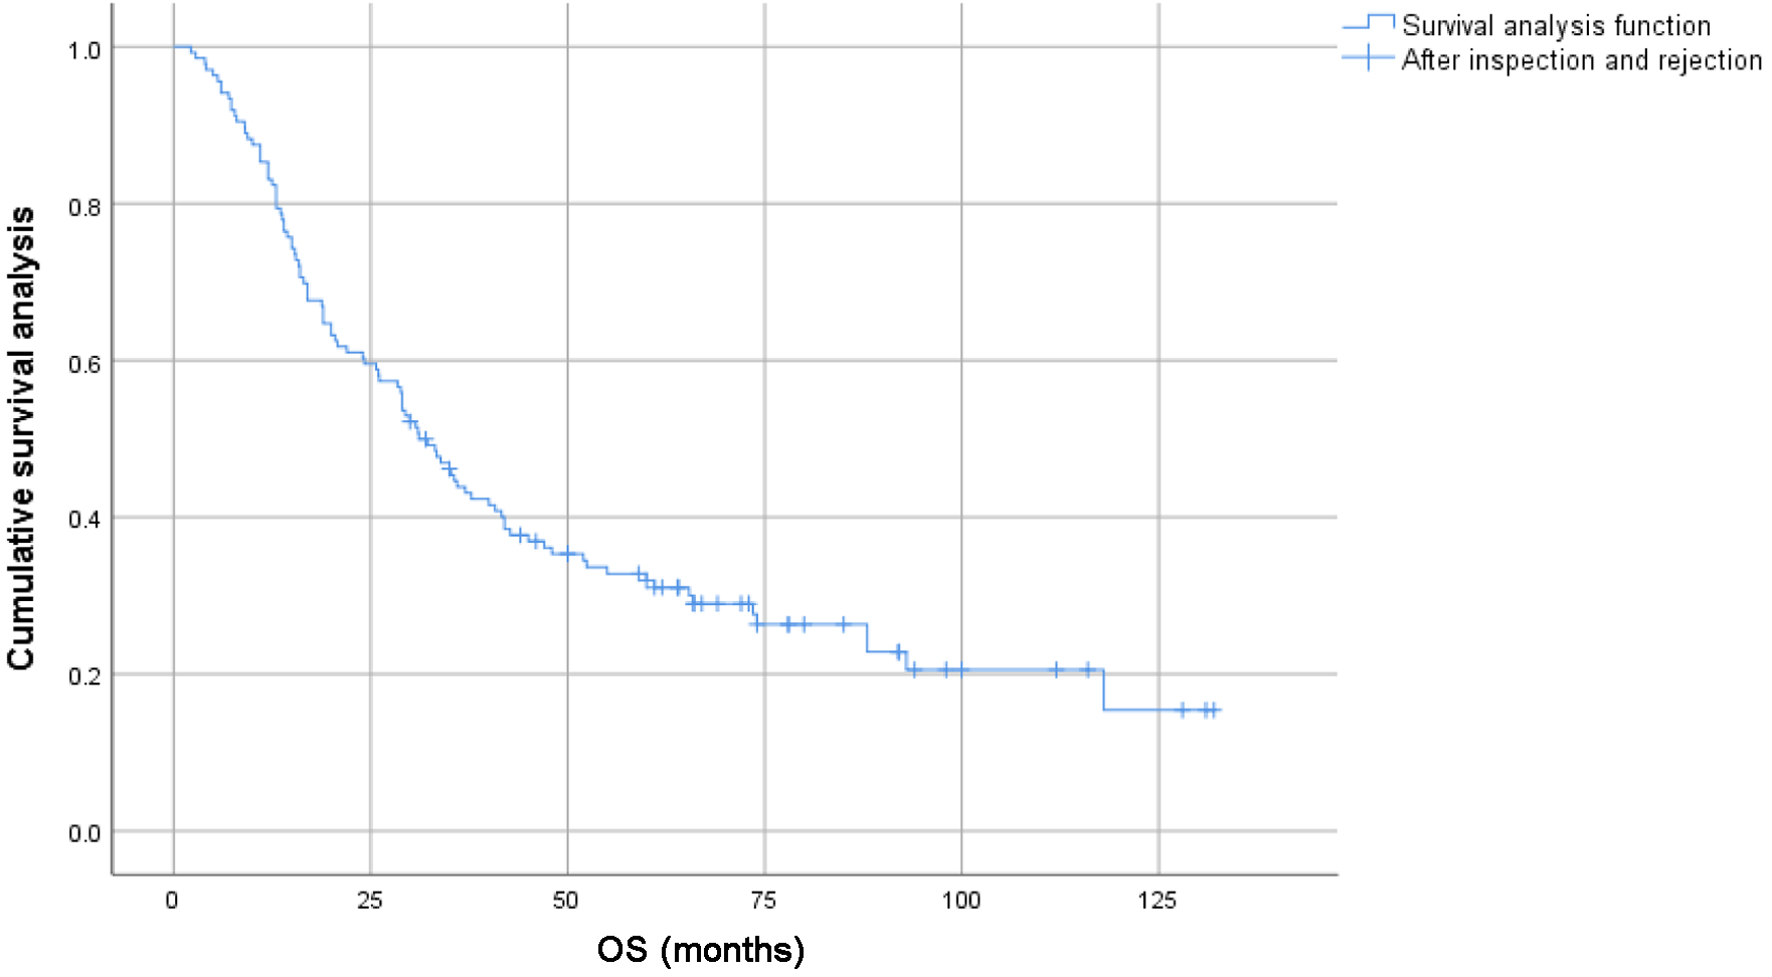
↓ Figure 1. Survival curves of 278 patients with
locally advanced lung squamous cell carcinoma.
| World Journal of Oncology, ISSN 1920-4531 print, 1920-454X online, Open Access |
| Article copyright, the authors; Journal compilation copyright, World J Oncol and Elmer Press Inc |
| Journal website https://wjon.elmerpub.com |
Original Article
Volume 17, Number 1, February 2026, pages 106-115
Survival Analysis and Treatment Strategies for Locally Advanced Lung Squamous Cell Carcinoma in Elderly Patients
Figures
Tables
| Factor | Group | Case, n (%) |
|---|---|---|
| Gender | Male | 255 (91.7%) |
| Female | 23 (8.3%) | |
| Age | < 65 years | 136 (48.9%) |
| ≥ 65 years | 142 (51.1%) | |
| Location | Central | 204 (73.3%) |
| Peripheral | 74 (26.7%) | |
| N stage | N0 | 21 (7.5%) |
| N1 | 7 (2.5%) | |
| N2 | 165 (59.4%) | |
| N3 | 85 (30.6%) | |
| T stage | T1b | 1 (0.3%) |
| T1c | 28 (10.1%) | |
| T2a | 15 (5.4%) | |
| T2b | 66 (23.7%) | |
| T3 | 58 (20.9%) | |
| T4 | 110 (39.6%) | |
| TNM stage | IIIa | 106 (38.1%) |
| IIIb | 121 (43.5%) | |
| IIIc | 51 (18.4%) | |
| Differentiation | Medium/high low | 186 (66.9%) |
| Adenocarcinoma | 87 (31.3%) | |
| Squamous | 5 (1.8%) |
| Factor | Group | Case, n | OS (%) | P value | ||
|---|---|---|---|---|---|---|
| 3 years | 5 years | 10 years | ||||
| OS: overall survival; PD: progressive disease; PR: partial response; SD: stable disease. | ||||||
| Smoke | No | 55 | 67.3 | 55.9 | 33.0 | 0.012 |
| Yes | 223 | 47.0 | 37.0 | 21.1 | ||
| Age | < 65 years | 141 | 57.4 | 48.8 | 31.5 | 0.004 |
| ≥ 65 years | 137 | 44.3 | 32.3 | 15.6 | ||
| Location | Central | 204 | 45.0 | 35.7 | 19.4 | 0.001 |
| Peripheral | 74 | 67.6 | 55.0 | 36.2 | ||
| Chemotherapy | No | 64 | 45.0 | 33.0 | 19.9 | 0.026 |
| Yes | 214 | 52.8 | 42.9 | 25.2 | ||
| Radiation pneumonitis | No | 194 | 51.9 | 45.3 | 29.1 | 0.041 |
| Yes | 84 | 48,8 | 30.7 | 14.7 | ||
| Short-term effects | PR | 158 | 60.6 | 50.5 | 31.8 | |
| SD | 82 | 47.6 | 37.8 | 20.5 | < 0.001 | |
| PD | 38 | 21.1 | 7.9 | 0 | ||
| PFS1 subgroup | < 12 ms | 98 | 34.7 | 25.4 | 8.4 | < 0.001 |
| ≥ 12 ms | 180 | 62.1 | 49.2 | 34.1 | ||
| HR (95.0% CI) | P value | |
|---|---|---|
| CI: confidence interval; HR: hazard ratio; CR: complete response; PD: progressive disease; PFS: progression-free survival; PR: partial response; SD: stable disease. | ||
| Age | < 0.001 | |
| < 65 years | 1 (ref) | |
| ≥ 65 years | 0.50 (0.371 - 0.674) | |
| Location | ||
| Central | 1 (ref) | 0.002 |
| Peripheral | 1.74 (1.226 - 2.483) | |
| Radiation pneumonitis | 0.048 | |
| No | 1 (ref) | |
| Yes | 0.736 (0.543 - 0.997) | |
| PFS1 subgroup | < 0.001 | |
| CR + PR | 1 (ref) | |
| SD + PD | 0.53 (0.396 - 0.709) | |
| PFS1 subgroup | < 0.001 | |
| < 12 ms | 1 (ref) | |
| ≥ 12 ms | 2.70 (2.006 - 3.649) | |
| Factor | Group | Case, n | PFS1 (%) | P value | ||
|---|---|---|---|---|---|---|
| 3 years | 5 years | 10 years | ||||
| CR: complete response; PD: progressive disease; PFS: progression-free survival; PR: partial response; SD: stable disease. | ||||||
| Smoke | No | 55 | 40.0 | 33.9 | 23.7 | 0.005 |
| Yes | 223 | 25.9 | 18.7 | 4.1 | ||
| Alcohol | No | 153 | 35.3 | 26.7 | 14.9 | 0.001 |
| Yes | 125 | 20.3 | 15.6 | 1.5 | ||
| Location | Central | 204 | 24.3 | 16.9 | 5.1 | 0.001 |
| Peripheral | 74 | 41.9 | 35.0 | 16.7 | ||
| Actual completed dose of radiotherapy | < 60 Gy | 81 | 24.6 | 20.3 | 3.9 | 0.017 |
| ≥ 60 Gy | 197 | 30.4 | 22.6 | 9.9 | ||
| Radiation pneumonitis | No | 194 | 31.4 | 24.4 | 9.4 | 0.045 |
| Yes | 84 | 22,6 | 16.2 | 5.5 | ||
| Stratification of first-line treatment efficacy | CR + PR | 158 | 60.0 | 50.5 | 31.8 | |
| SD + PD | 120 | 39.2 | 29.2 | 15.1 | < 0.001 | |
| HR (95.0% CI) | P value | |
|---|---|---|
| CI: confidence interval; CR: complete response; HR: hazard ratio; PD: progressive disease; PFS: progression-free survival; PR: partial response; SD: stable disease. | ||
| Radiotherapy efficacy | 0.044 | |
| CR + PR | 1 (ref) | |
| SD + PD | 0.756 (0.576 - 0.992) | |
| Actual completed dose of radiotherapy | 0.020 | |
| < 60 Gy | 1 (ref) | |
| ≥ 60 Gy | 1.388 (1.053 - 1.829) | |