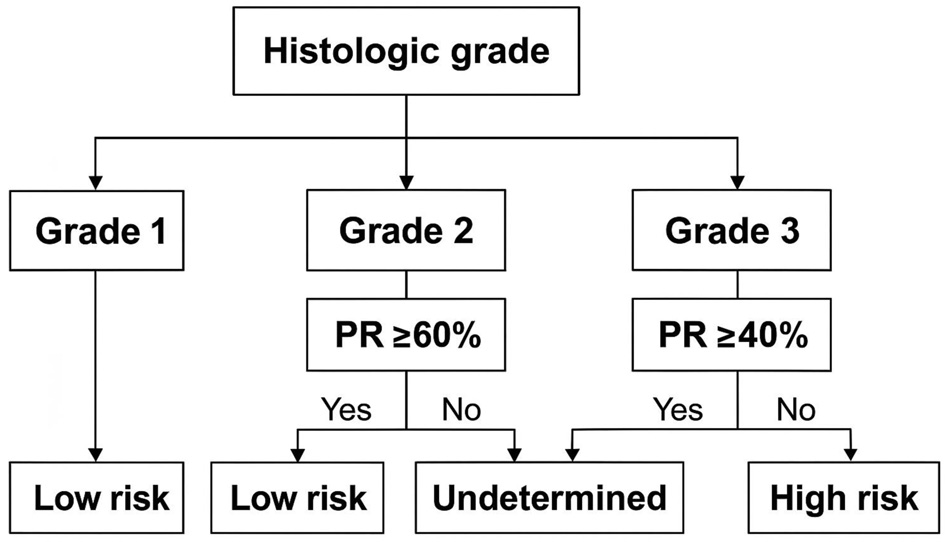
↓ Figure 1. Proposed PR% and grade in relation to
RS. PR: progesterone receptor; RS: recurrence score.
| World Journal of Oncology, ISSN 1920-4531 print, 1920-454X online, Open Access |
| Article copyright, the authors; Journal compilation copyright, World J Oncol and Elmer Press Inc |
| Journal website https://wjon.elmerpub.com |
Original Article
Volume 16, Number 6, December 2025, pages 555-564
A Simplified Novel Algorithm to Predict the 21-Gene Recurrence Score
Figures
Tables
| Feature | N (%) |
|---|---|
| ER: estrogen receptor; FISH: fluorescence in situ hybridization; HER2: human epidermal growth factor receptor-2; ODx: Oncotype DX; PR: progesterone receptor; RS: recurrence score. | |
| ER (%) | |
| Positive | 528 (100%) |
| PR (%) | |
| Negative | 30 (5.7%) |
| Positive | 498 (94.3%) |
| HER2 | |
| Equivocal (FISH-negative) | 59 (11.2%) |
| Negative | 469 (88.8%) |
| HER2 score | |
| 0 | 263 (49.8%) |
| 1+ | 206 (39.0%) |
| 2+ (FISH negative) | 59 (11.2%) |
| ER (ODx value) | |
| Negative | 11 (2.1%) |
| Positive | 517 (97.9%) |
| PR (ODx value) | |
| Negative | 72 (13.6%) |
| Positive | 456 (86.4%) |
| HER2 (ODx value) | |
| Equivocal | 3 (0.6%) |
| Negative | 523 (99.0%) |
| Positive | 2 (0.4%) |
| Histological type | |
| Invasive ductal carcinoma | 438 (82.9%) |
| Invasive lobular carcinoma | 68 (12.9%) |
| Invasive mucinous carcinoma | 10 (1.9%) |
| Invasive tubular carcinoma | 7 (1.3%) |
| Invasive cribriform carcinoma | 1 (0.2%) |
| Invasive solid papillary carcinoma | 3 (0.6%) |
| Invasive breast carcinoma with apocrine features | 1 (0.2%) |
| Group | |
| Learning set | 377 (71.3%) |
| Validation set | 151 (28.7%) |
| Grade | |
| 1 | 99 (18.8%) |
| 2 | 323 (61.2%) |
| 3 | 106 (20.1%) |
| RS | |
| High | 96 (18.2%) |
| Low | 432 (81.8%) |
| Feature | Total, N (%) | Groups | P-value | |
|---|---|---|---|---|
| Learning set | Validation set | |||
| CI: confidence interval; ER: estrogen receptor; PR: progesterone receptor; RS: recurrence score; SD: standard deviation. | ||||
| Grade | 0.88 | |||
| 1 | 99 (19.2%) | 68 (18.0%) | 31 (20.5%) | |
| 2 | 323 (61.7%) | 231 (61.2%) | 92 (60.9%) | |
| 3 | 106 (19.0%) | 78 (20.7%) | 28 (18.5%) | |
| Actual RS | 0.54 | |||
| High | 96 (18.2%) | 72 (19.1%) | 24 (15.9%) | |
| Low | 432 (82.5%) | 305 (81.9%) | 127 (84.1%) | |
| Age (years) | 0.46 | |||
| Mean (95% CI) | 52.8 (51.9, 53.7) | 53.6 (52.1, 55.2) | ||
| Median (Min, Max) | 52.0 (21.0, 76.0) | 53.0 (24.0, 79.0) | ||
| SD | 10.3 | 11.4 | ||
| ER (%) | 0.34 | |||
| Mean (95% CI) | 89.8 (88.7 ,91.0) | 88.5 (86.5, 90.5) | ||
| Median (Min, Max) | 95.0 (1.0, 100) | 90.0 (5.0, 100) | ||
| SD | 13.7 | 15.0 | ||
| PR (%) | 0.87 | |||
| Mean (95% CI) | 66.4 (63.5, 69.3) | 67.6 (63.0, 72.2) | ||
| Median (Min, Max) | 85.0 (0.0, 100) | 90.0 (0.0, 100) | ||
| SD | 34.2 | 34.1 | ||
| Variable | Total | Actual RS | P-value | |
|---|---|---|---|---|
| High, N (%) | Low, N (%) | |||
| PR: progesterone receptor; RS: recurrence score; SD: standard deviation. | ||||
| Grade | ||||
| Grade 1 | 68 (18.7%) | 0 | 68 (22.9%) | 0.00 |
| Grade 2 | 231 (62.3%) | 25 (10.8%) | 206 (89.2%) | |
| Grade 3 | 78 (19.0%) | 47 (61.8%) | 31 (9.5%) | |
| PR%, mean (SD) | 33.7 (35.2) | 73.7 (29.5) | < 0.0001 | |
| Variable | PR cut-off (%) | Total | RS | P-value | |
|---|---|---|---|---|---|
| High | Low | ||||
| PR: progesterone receptor; ROC: receiver operating characteristics; RS: recurrence score. | |||||
| Learning set - all grade (PR cut-off ROC 50) | < 50 | 99 (26.4%) | 43 (63.2%) | 56 (18.2%) | 0.000 |
| ≥ 50 | 276 (73.6%) | 25 (36.8%) | 251 (81.8%) | ||
| Learning set - grade 2 (PR cut-off ROC 30) | < 30 | 58 (24.9%) | 22 (84.6%) | 36 (17.4%) | 0.000 |
| ≥ 30 | 175 (75.1%) | 4 (15.4%) | 171 (82.6%) | ||
| Learning set - grade 3 (PR cut-off ROC 70) | < 70 | 28 (39.4%) | 24 (57.1%) | 4 (13.8%) | 0.000 |
| ≥ 70 | 43 (60.6%) | 18 (42.9%) | 25 (86.2%) | ||
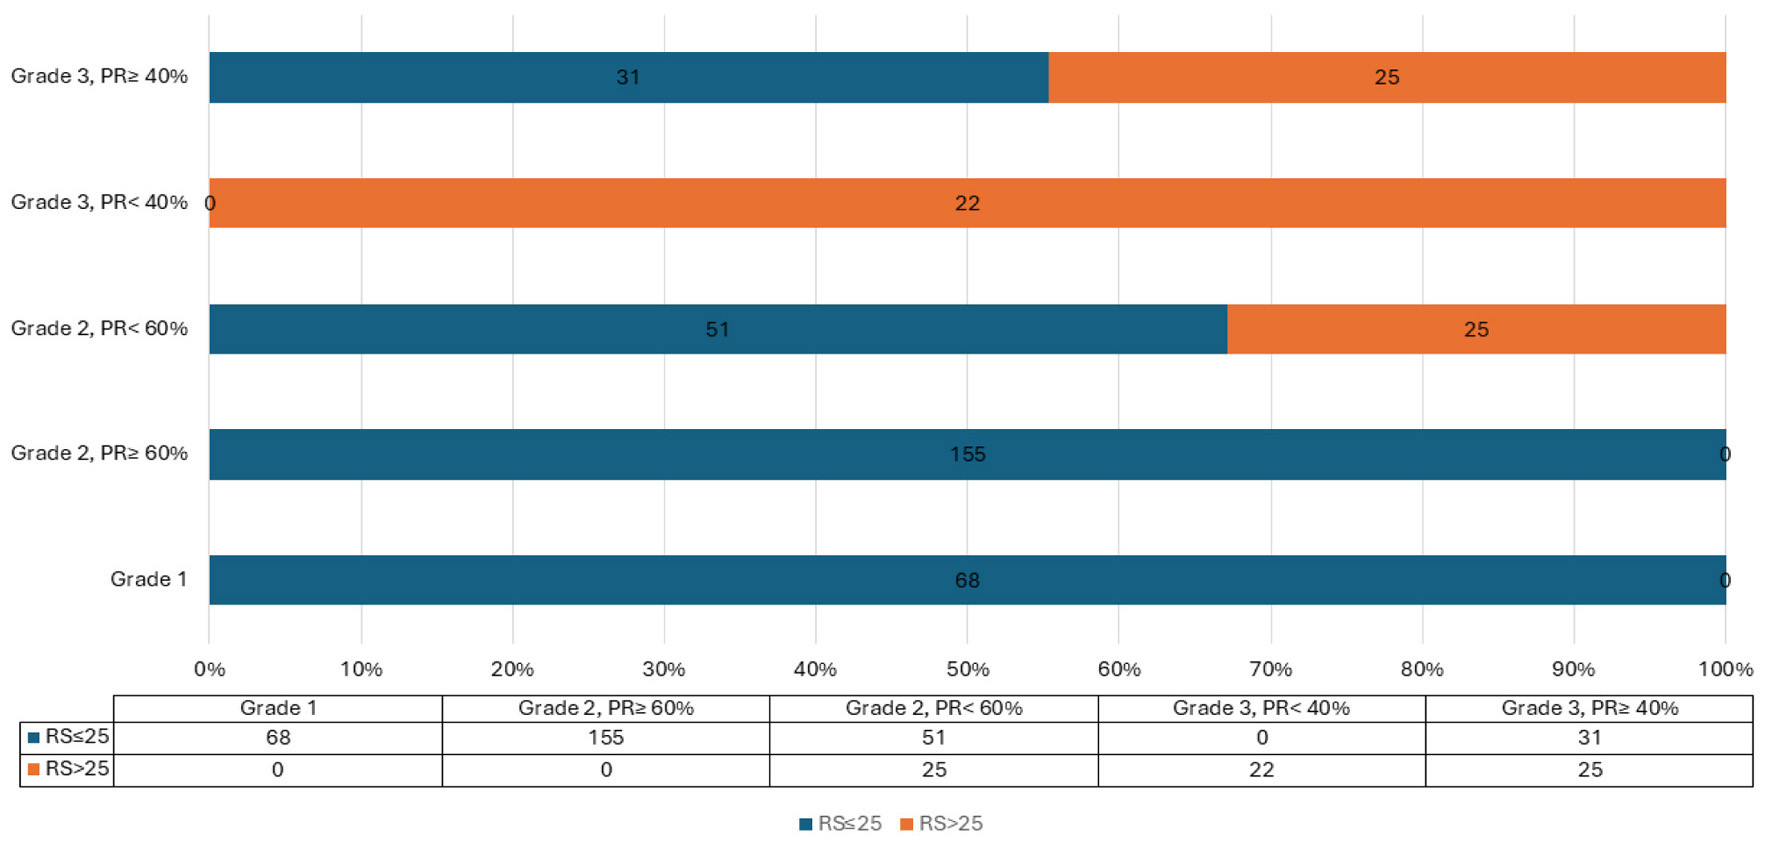
| Learning set - grade 2 (PR at 60) The sensitivity for this cut-off 60 = 100% The specificity for this cut-off 60 = 69.1% |
< 60 | 76 (35.6%) | 25 (100%) | 51 (27.5%) | 0.000 |
| ≥ 60 | 155 (64.4%) | 0 | 155 (72.5%) | ||
| Learning set - grade 3 (PR at 40) The sensitivity for this cut-off 40 = 100% The specificity for this cut-off 40 = 65% |
< 40 | 22 (23.9%) | 22 (40.5%) | 0 | 0.000 |
| ≥ 40 | 56 (76.1%) | 25 (59.5%) | 31 (100%) | ||