Figures
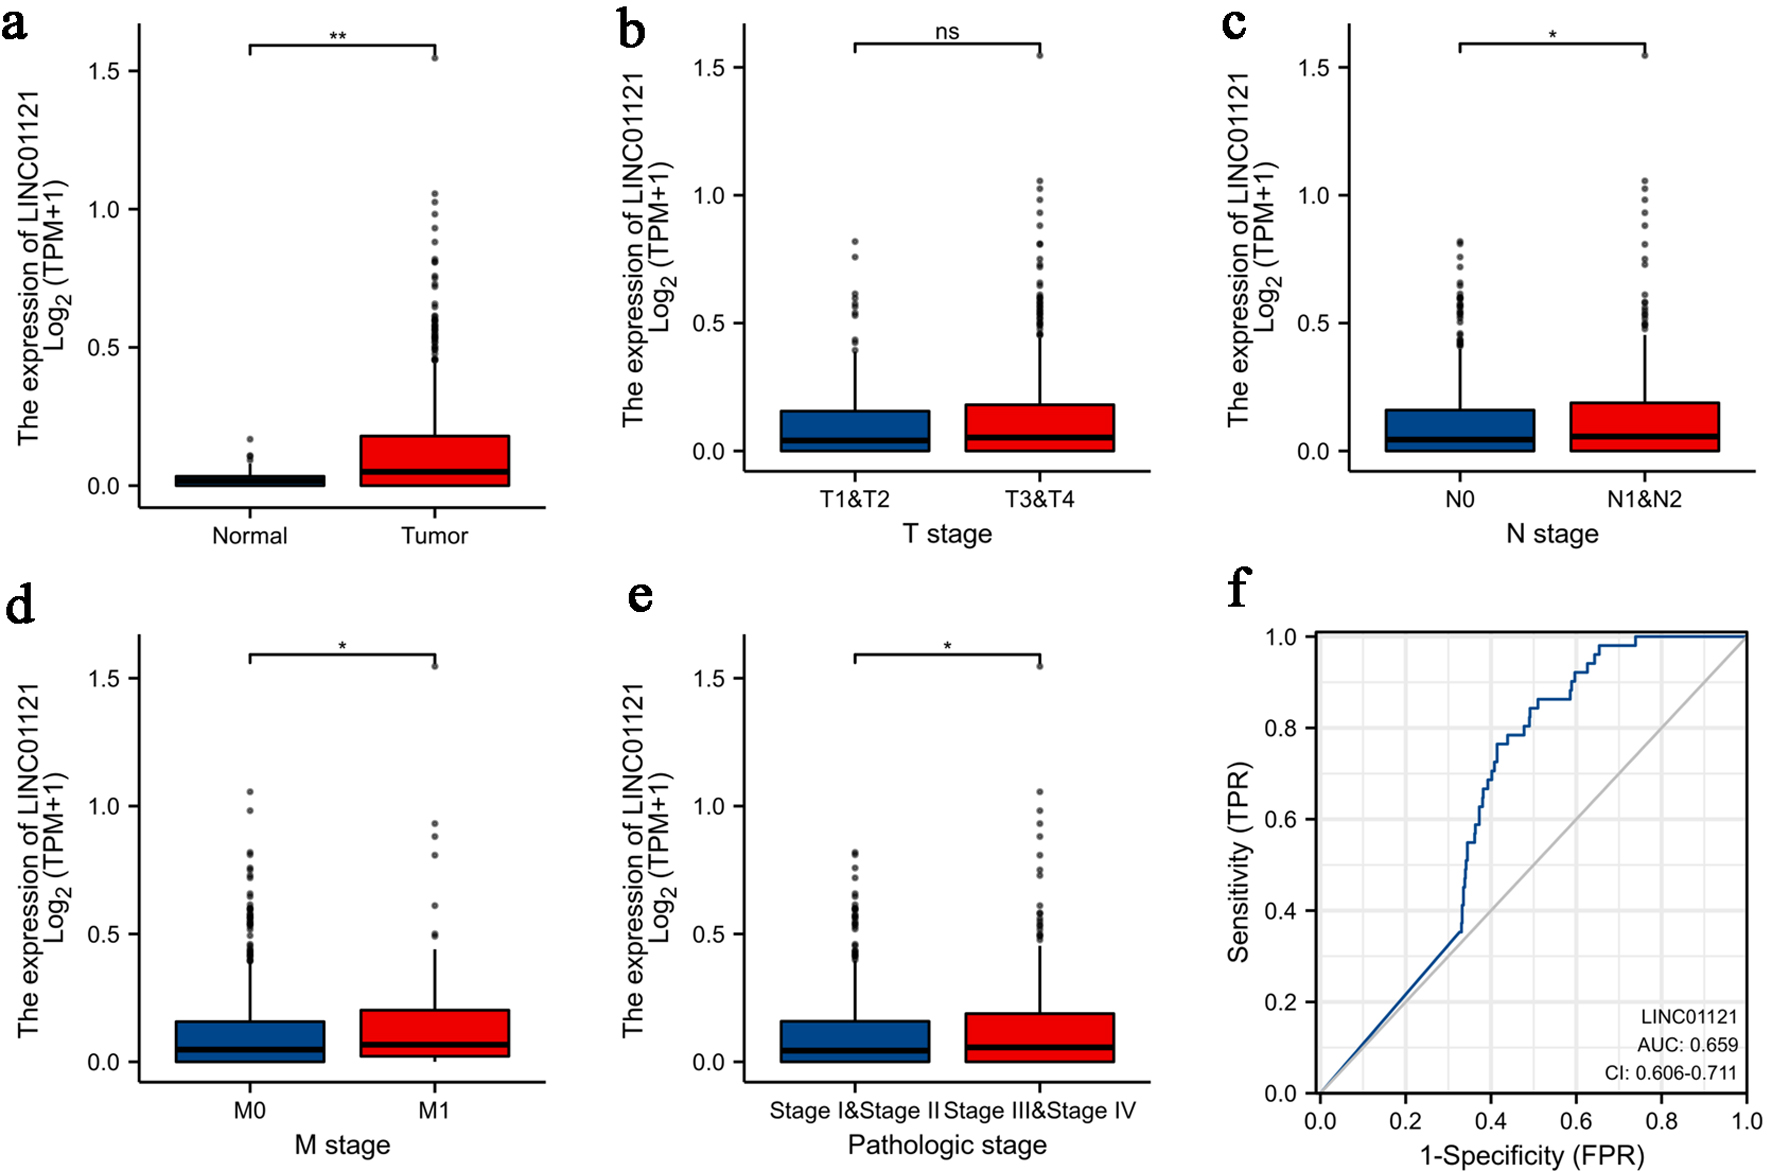
↓ Figure 1. Association of LINC01121 expression
with clinicopathologic characteristics: (a) expression level of LINC01121 in CRC samples and normal
tissues; (b) LINC01121 expression in T1-2 stage patients compared to T3-4 stage; (c) LINC01121
expression in lymphatic metastasis-positive patients compared to those without lymphatic metastasis; (d)
LINC01121 expression in M0 stage compared to M1 stage; (e) expression of LINC01121 in TNM stage I-II
compared to III-IV; (f) ROC curve of LINC01121. *P < 0.05, **P < 0.01, ***P < 0.001, ****P <
0.0001. CRC: colorectal cancer; ns: not significant; ROC: receiver operating characteristic.
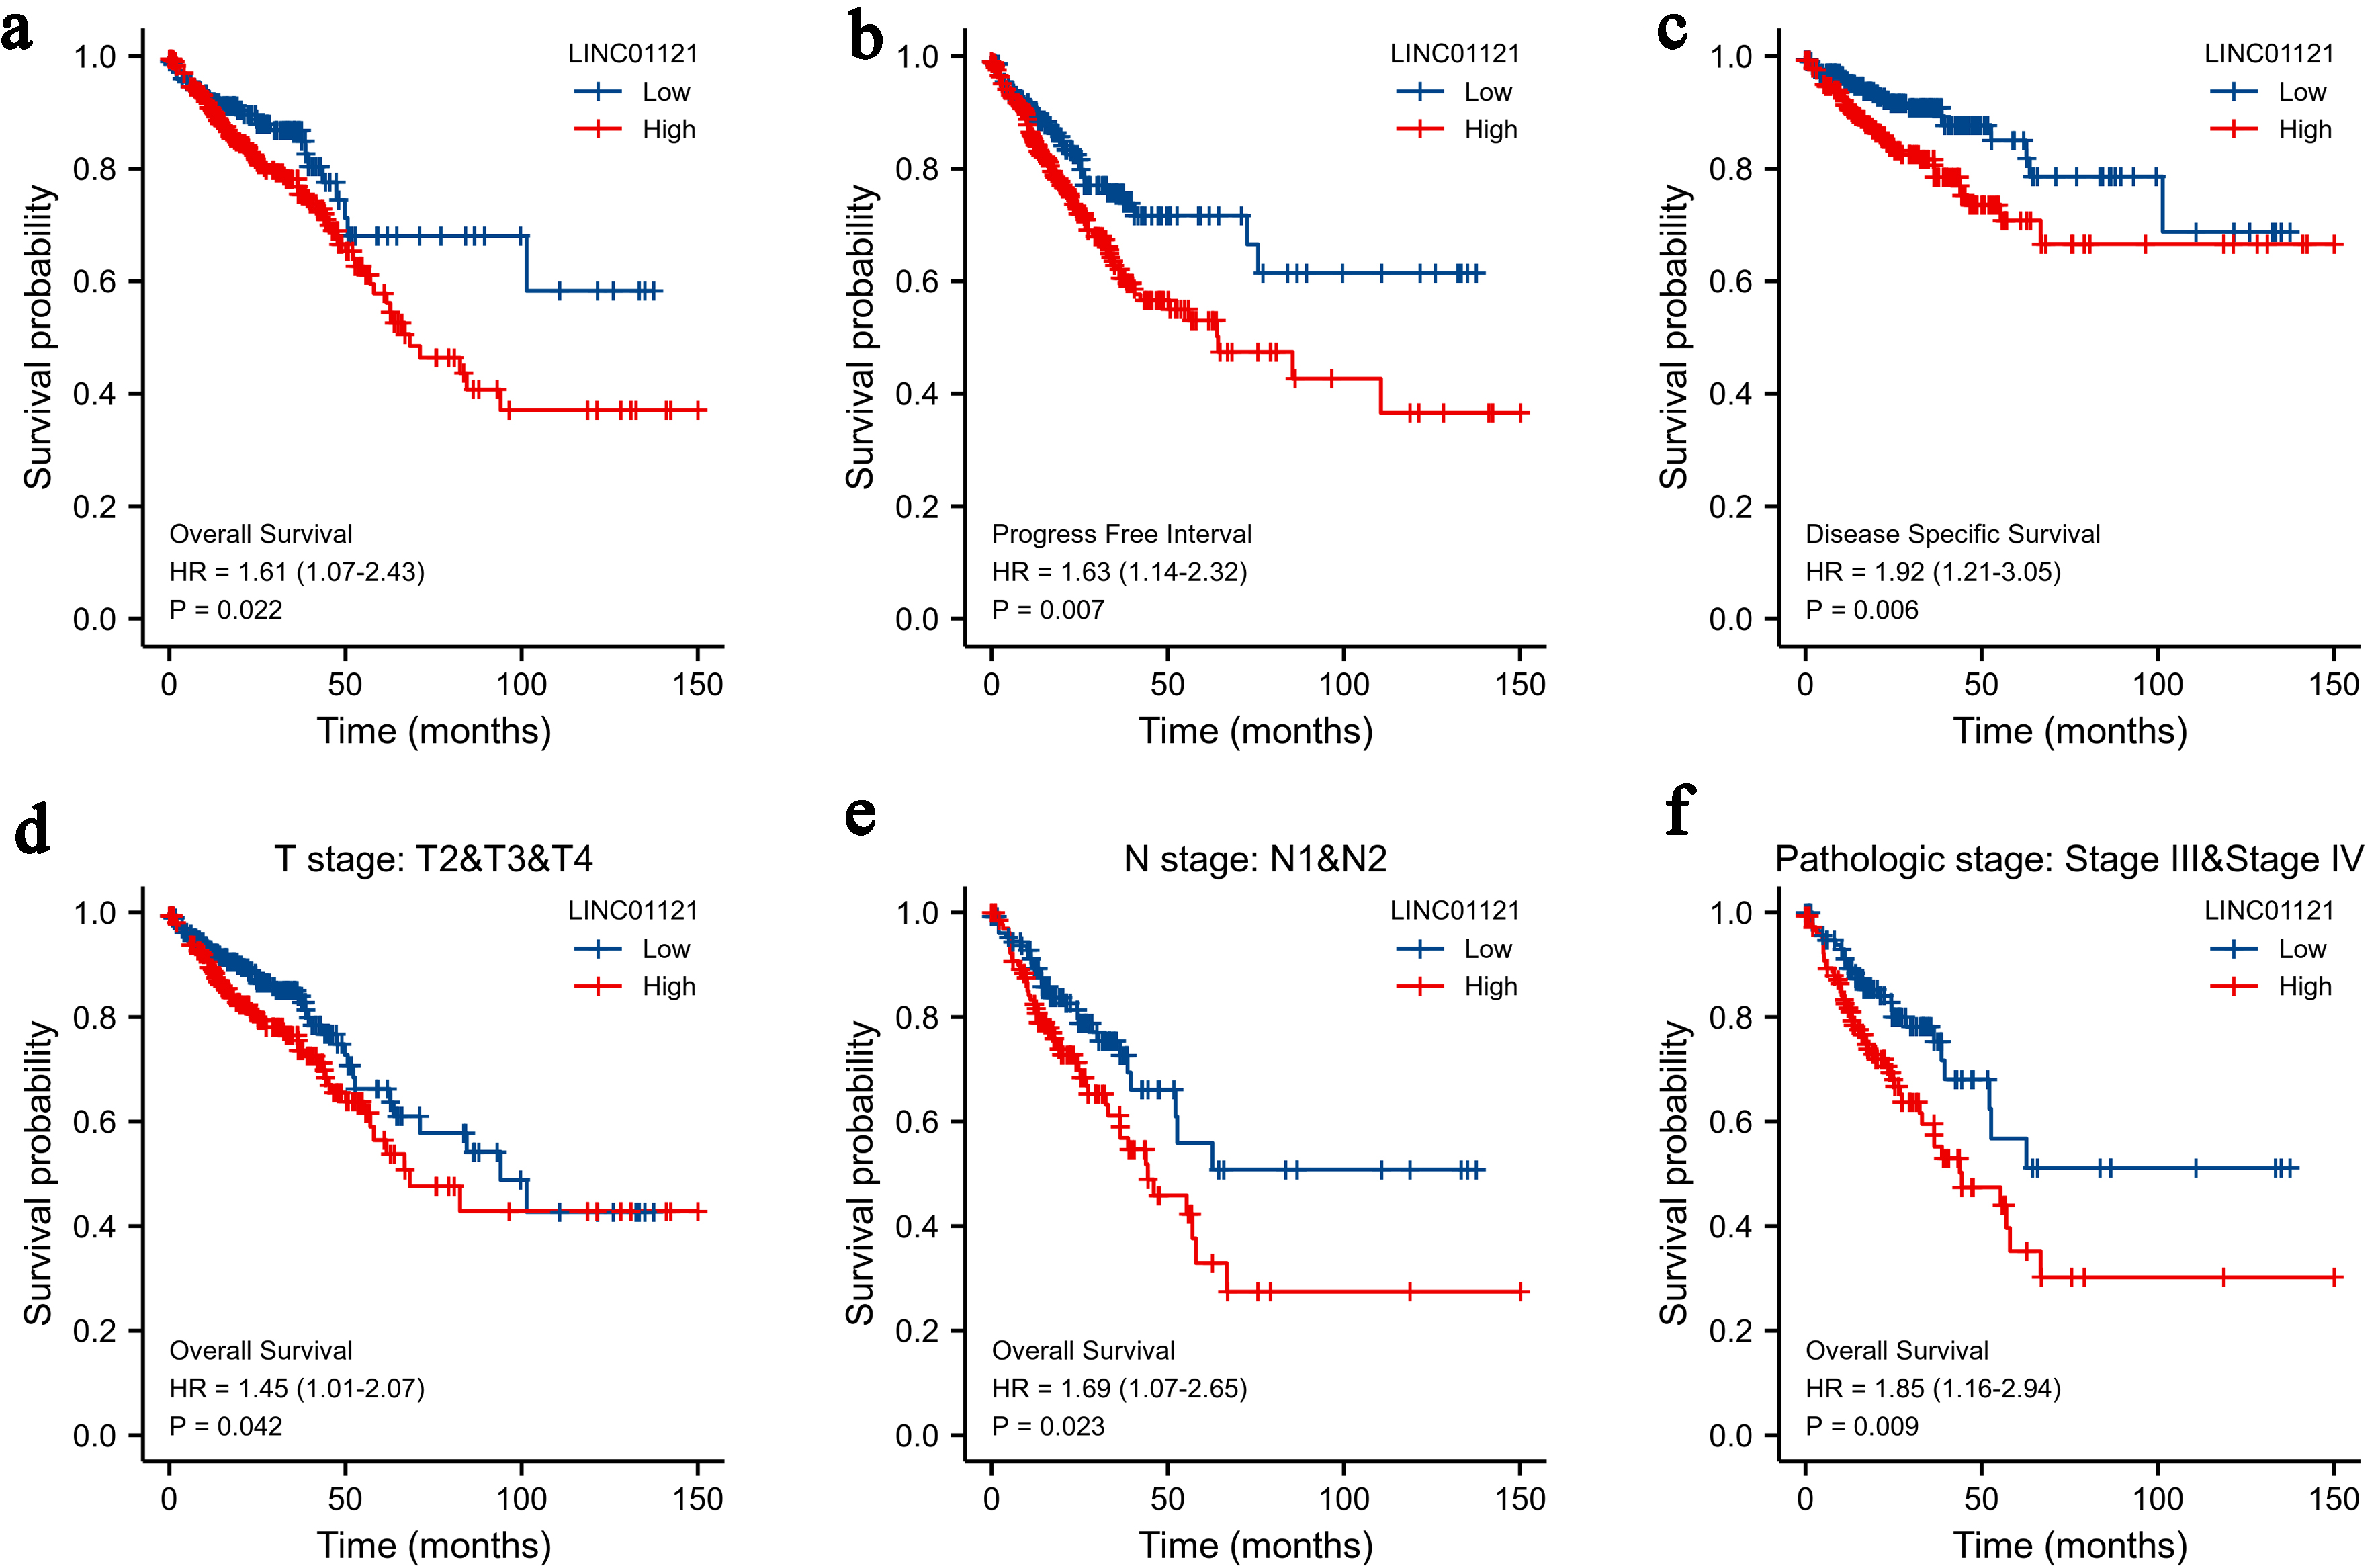
↓ Figure 2. Kaplan-Meier survival curves
comparing the high and low expression of LINC01121 in CRC patients: (a) overall survival; (b)
progression-free interval; (c) disease-specific survival; (d-f) overall survival analyses of T2-T4,
N1-2, and stages III and IV subgroup. CRC: colorectal cancer.
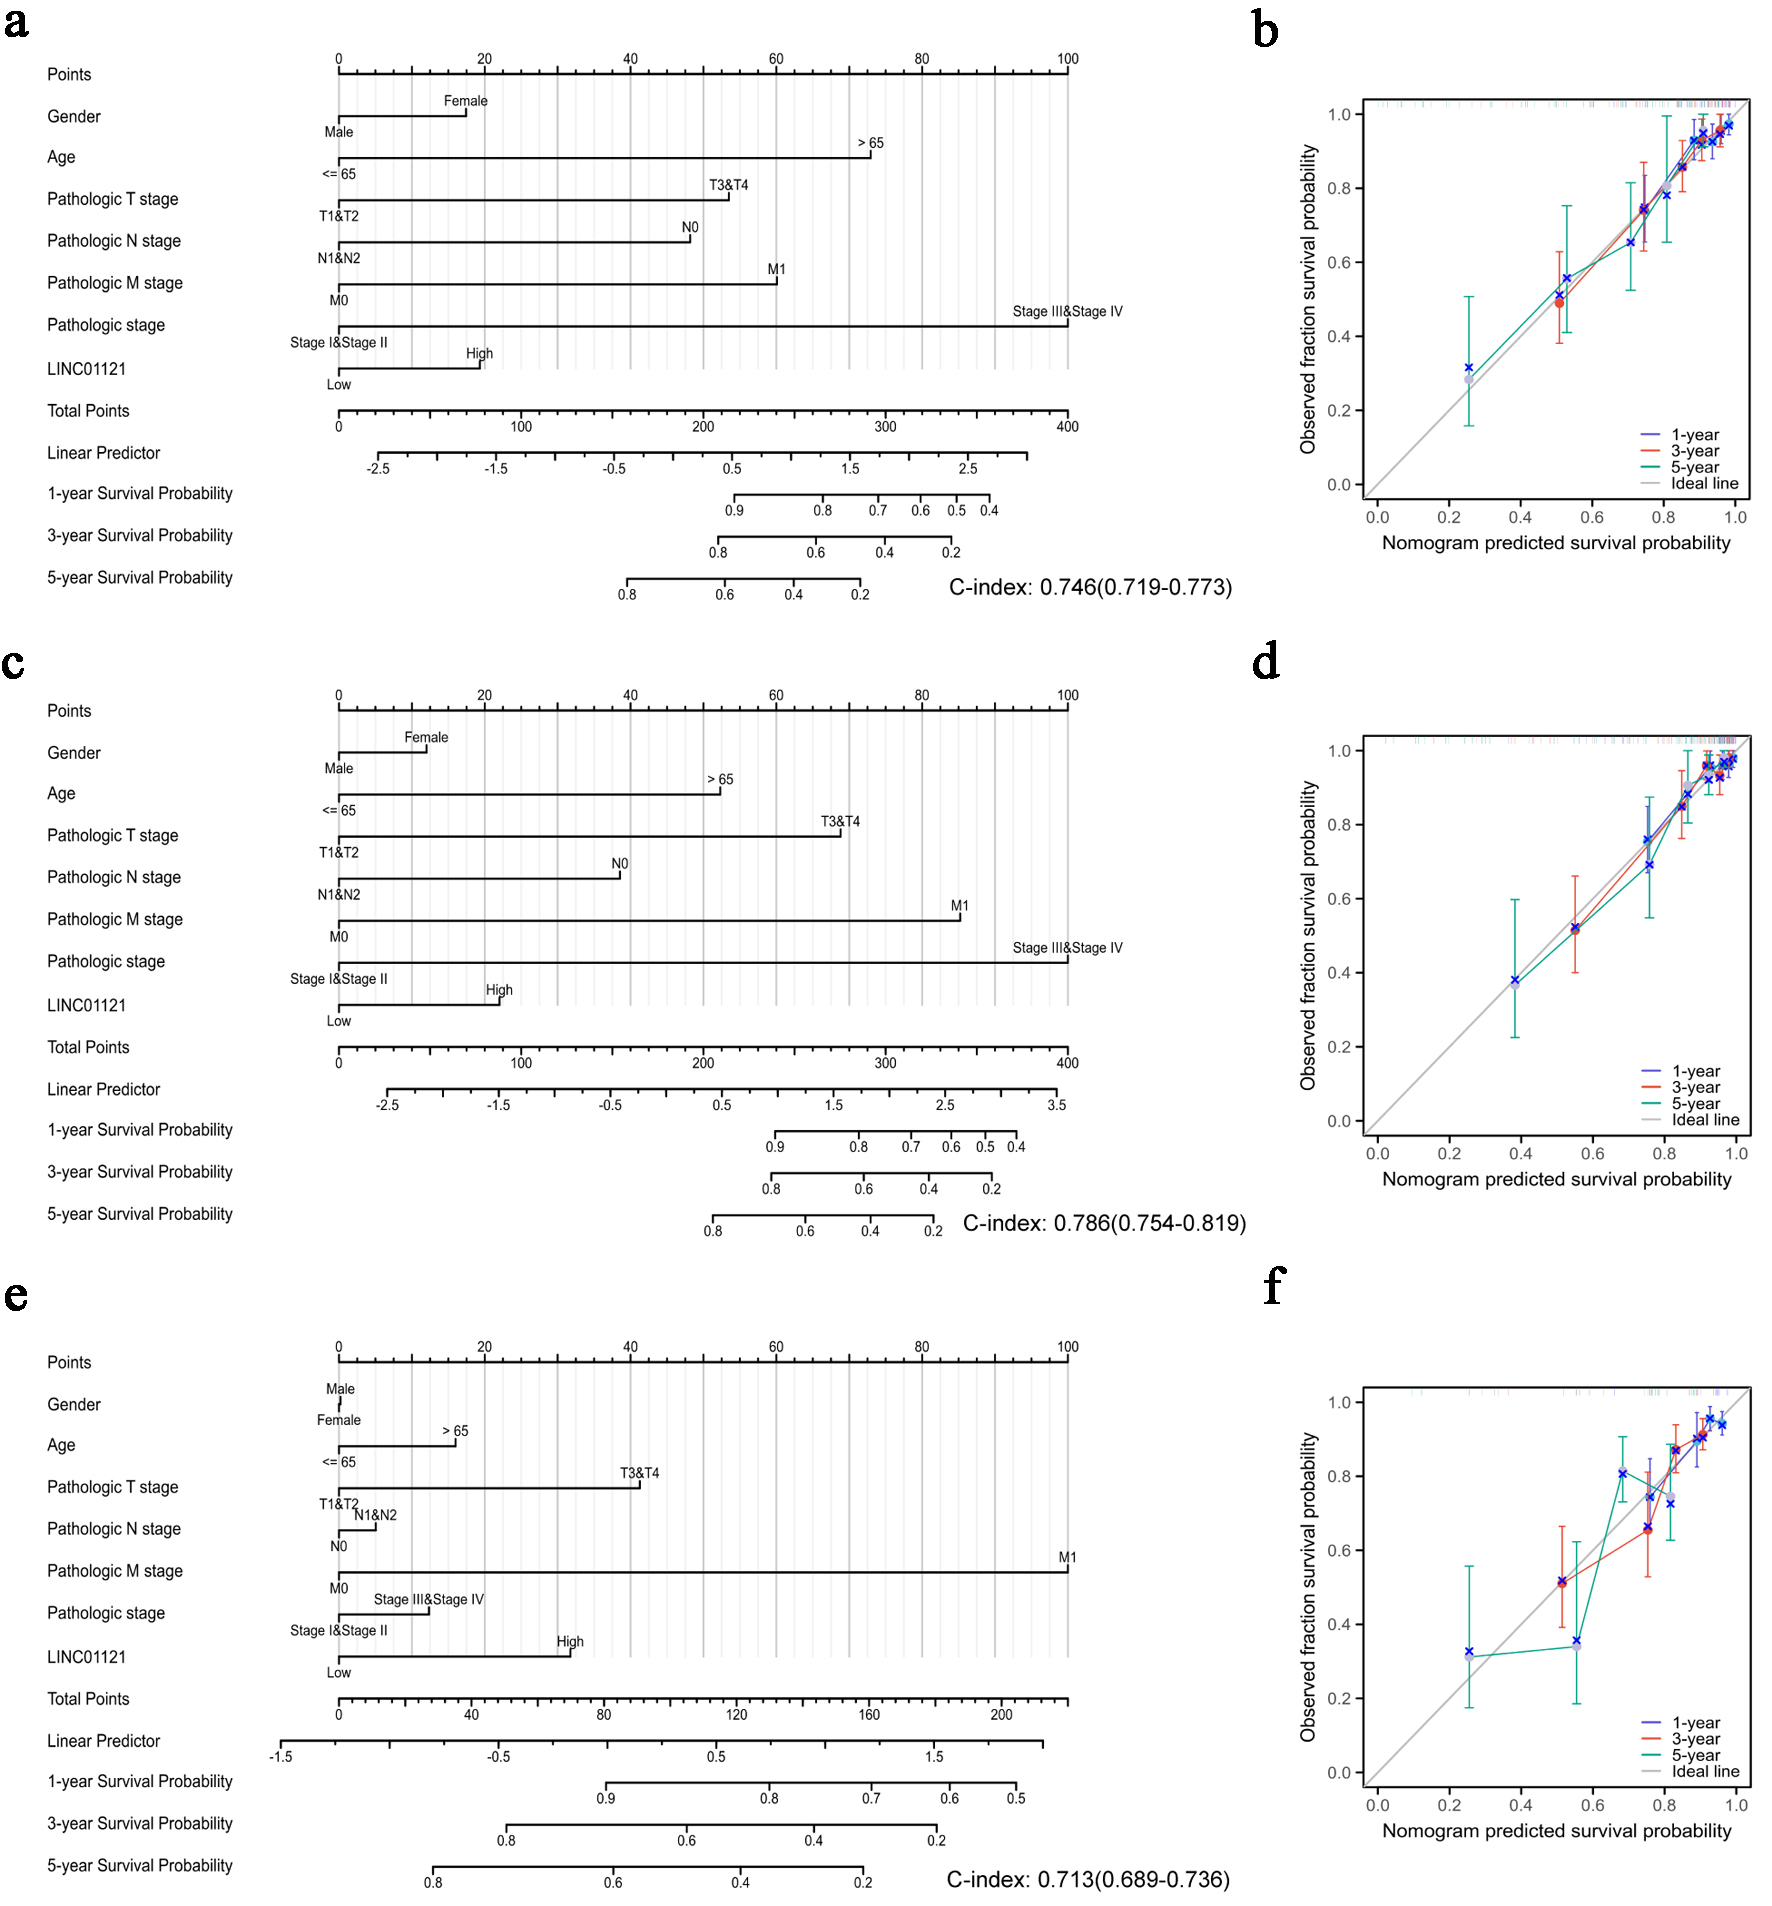
↓ Figure 3. Quantitative methods to predict
probability of 1-, 3-, 5-year OS, DSS, and PFI of CRC patients. Nomogram for predicting the probability
of 1-, 3-, 5-year OS (a), DSS (c), and PFI (e) for CRC patients. Calibration plots of the nomogram for
predicting the probability of OS (b), DSS (d), and PFI (f) at 1, 3, and 5 years. CRC: colorectal cancer;
DSS: disease-specific survival; OS: overall survival; PFI: progression-free interval.
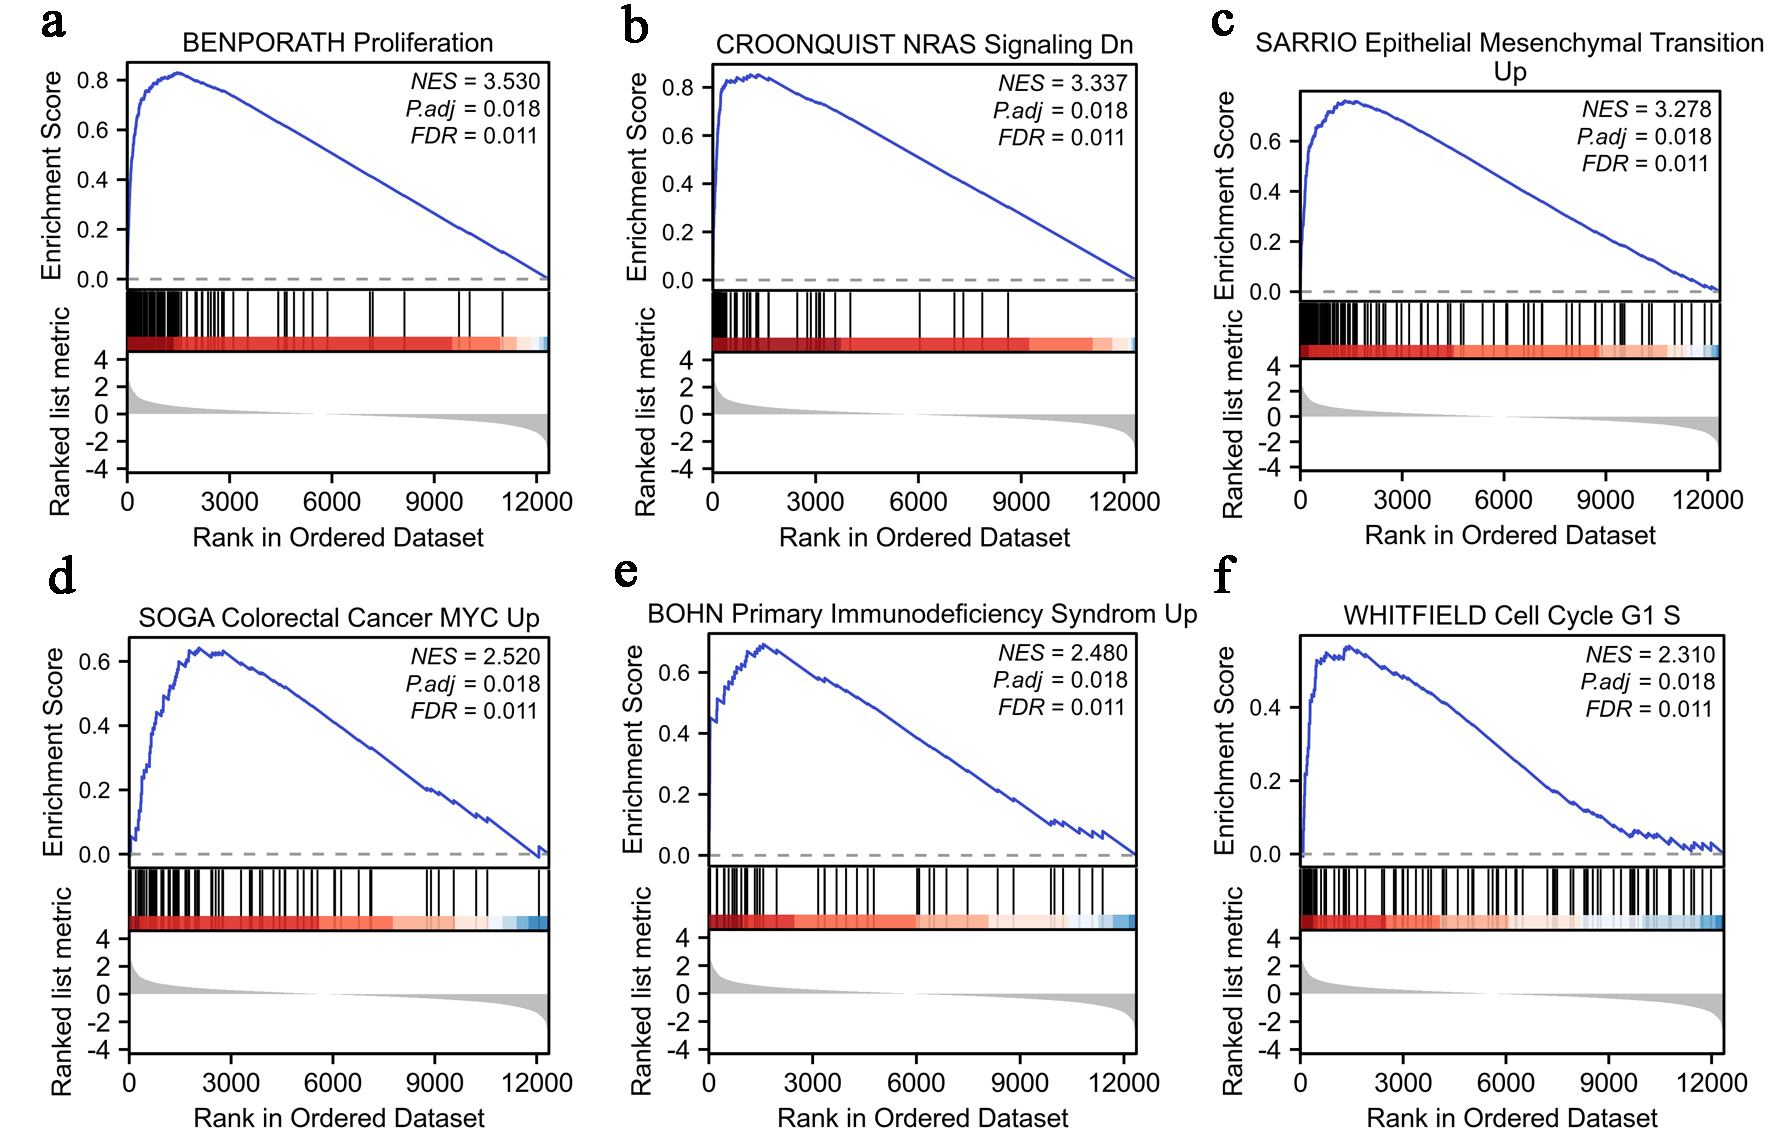
↓ Figure 4. Enrichment analysis of LINC01121 in
CRC: (a) proliferation; (b) NRAS signaling; (c) epithelial mesenchymal transition; (d) colorectal cancer
MYC; (e) primary immunodeficiency syndrome; (f) cell cycle G1 S. CRC: colorectal cancer.
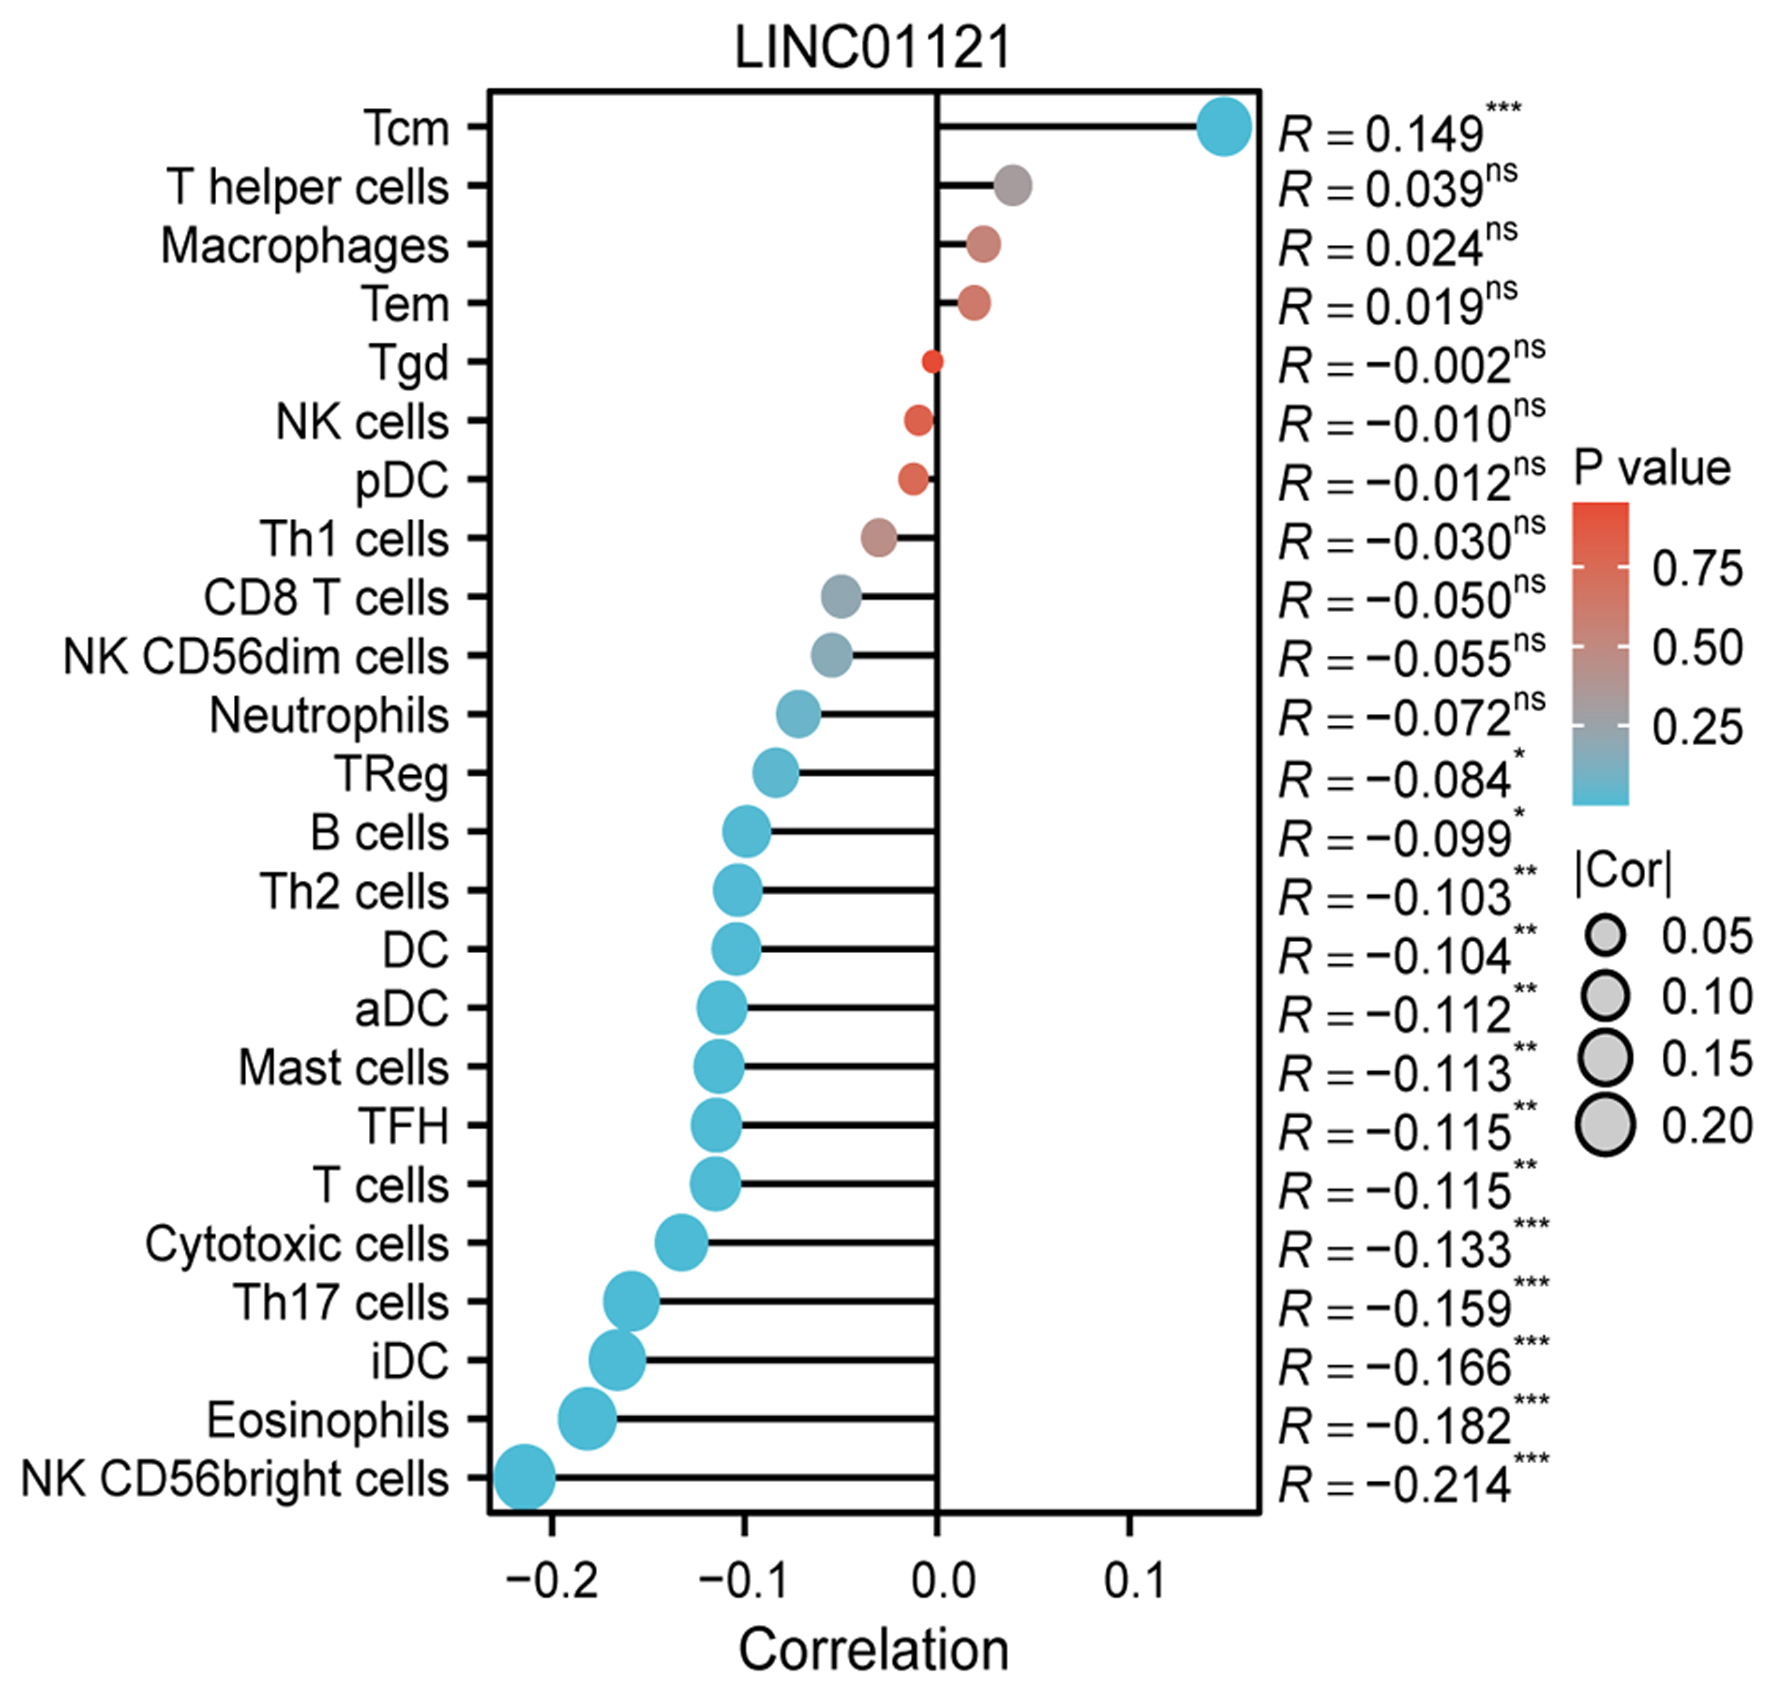
↓ Figure 5. The relationship between LINC01121
expression and immune cell infiltration.
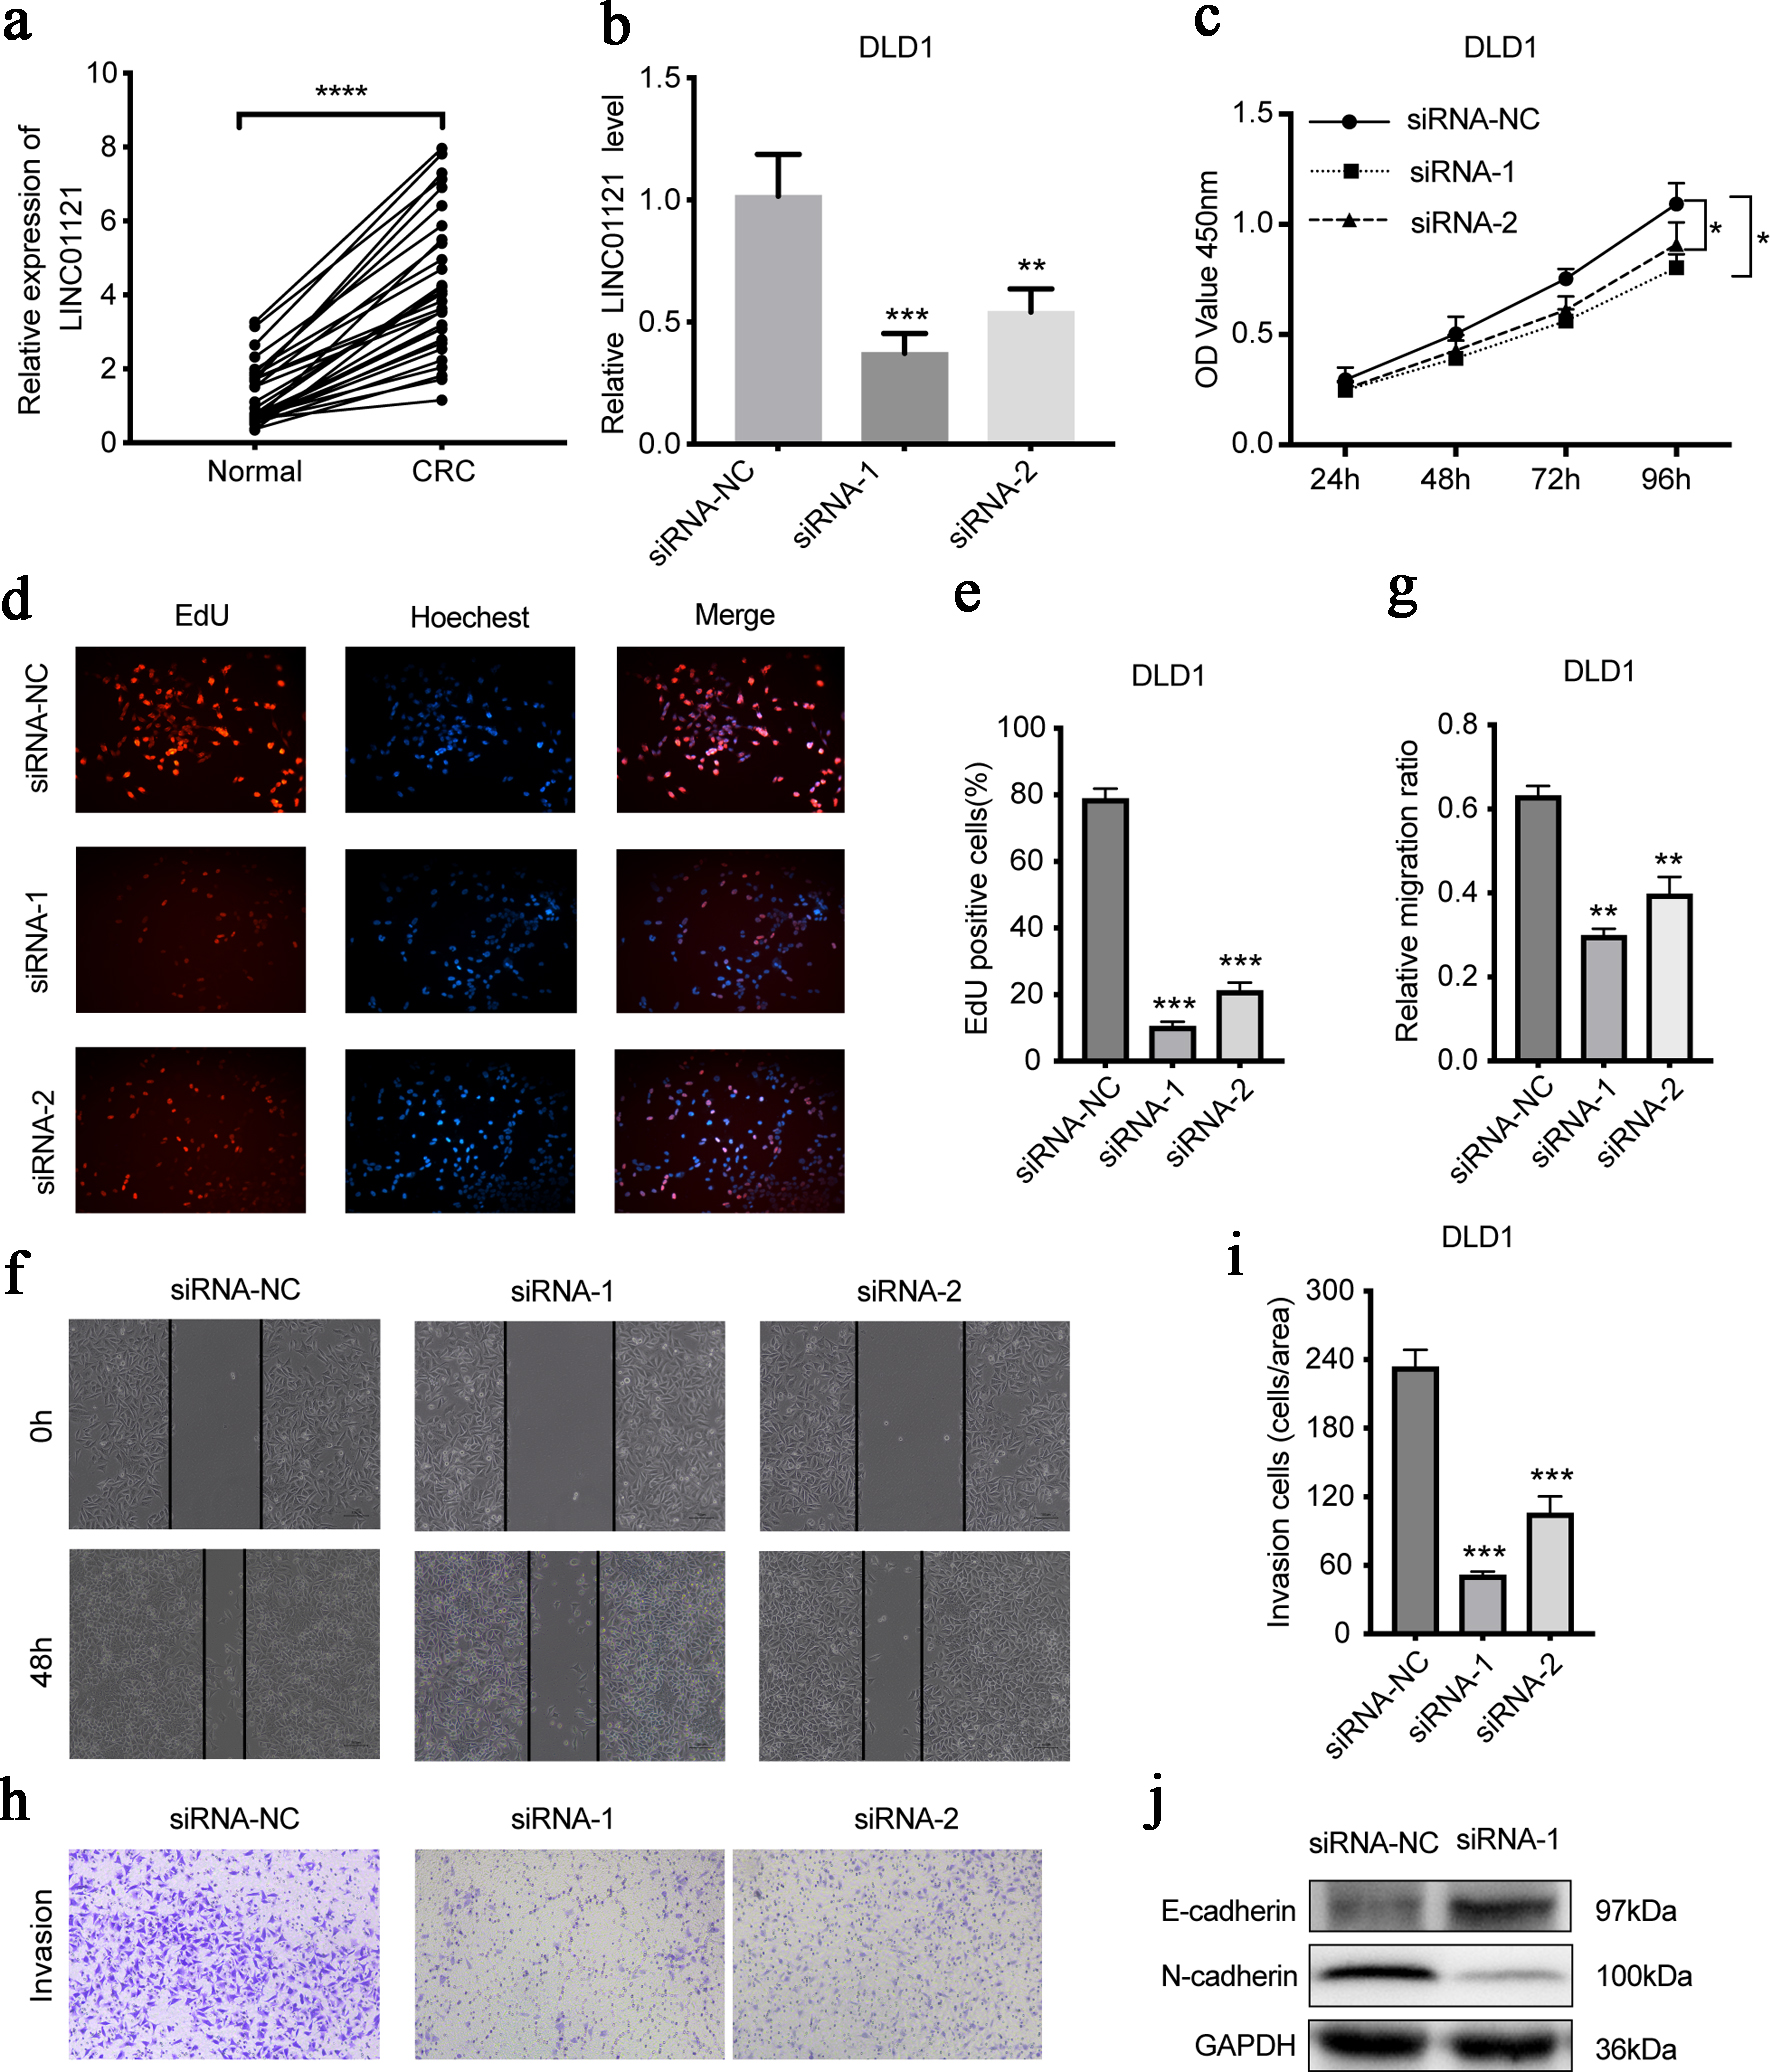
↓ Figure 6. LINC01121 mediates the proliferation,
migration, and invasion of DLD1 cells. (a) The expression level of LINC01121 in CRC tissue and adjacent
tissues. (b) RT-qPCR was used to access the expression level of LINC01121 in DLD1 after knockdown. (c-e)
CCK8 and EdU assays assessed the cell proliferation levels after LINC01121 knockdown. (f, g) Scratch
assays were performed to detect the cell migration ability after LINC01121 knockdown. (h, i) Transwell
invasion assays showed the cell invasion ability after LINC01121 knockdown. (j) Western blotting
revealed the change of E-cadherin and N-cadherin expression after LINC01121 knockdown. Data are
represented as mean ± SD. P values were calculated via one-way ANOVA test. **P < 0.01, ***P <
0.001, ****P < 0.0001. ANOVA: analysis of variance; CRC: colorectal cancer; RT-qPCR: reverse
transcription-quantitative polymerase chain reaction.
Table
↓ Table 1. Clinical Information of Colorectal Patients in TCGA
|
Characteristics |
Low
expression of LINC01121 |
High
expression of LINC01121 |
P
value |
| TCGA: The Cancer Genome Atlas. |
| n |
322 |
322 |
|
| Gender, n (%) |
|
|
0.693 |
| Male |
169 (26.2%) |
174 (27%) |
|
| Female |
153 (23.8%) |
148 (23%) |
|
| Age, n (%) |
|
|
0.152 |
| ≤ 65 |
129 (20%) |
147 (22.8%) |
|
| > 65 |
193 (30%) |
175 (27.2%) |
|
| Pathologic T stage, n (%) |
|
|
0.118 |
| T1 |
15 (2.3%) |
5 (0.8%) |
|
| T2 |
56 (8.7%) |
55 (8.6%) |
|
| T3 |
217 (33.9%) |
219 (34.2%) |
|
| T4 |
33 (5.1%) |
41 (6.4%) |
|
| Pathologic N stage, n (%) |
|
|
0.568 |
| N0 |
190 (29.7%) |
178 (27.8%) |
|
| N1 |
75 (11.7%) |
78 (12.2%) |
|
| N2 |
55 (8.6%) |
64 (10%) |
|
| Pathologic M stage, n (%) |
|
|
0.191 |
| M0 |
244 (43.3%) |
231 (41%) |
|
| M1 |
39 (6.9%) |
50 (8.9%) |
|
| Pathologic stage, n (%) |
|
|
0.545 |
| Stage I |
58 (9.3%) |
53 (8.5%) |
|
| Stage II |
125 (20.1%) |
113 (18.1%) |
|
| Stage III |
89 (14.3%) |
95 (15.2%) |
|
| Stage IV |
40 (6.4%) |
50 (8%) |
|