Figures
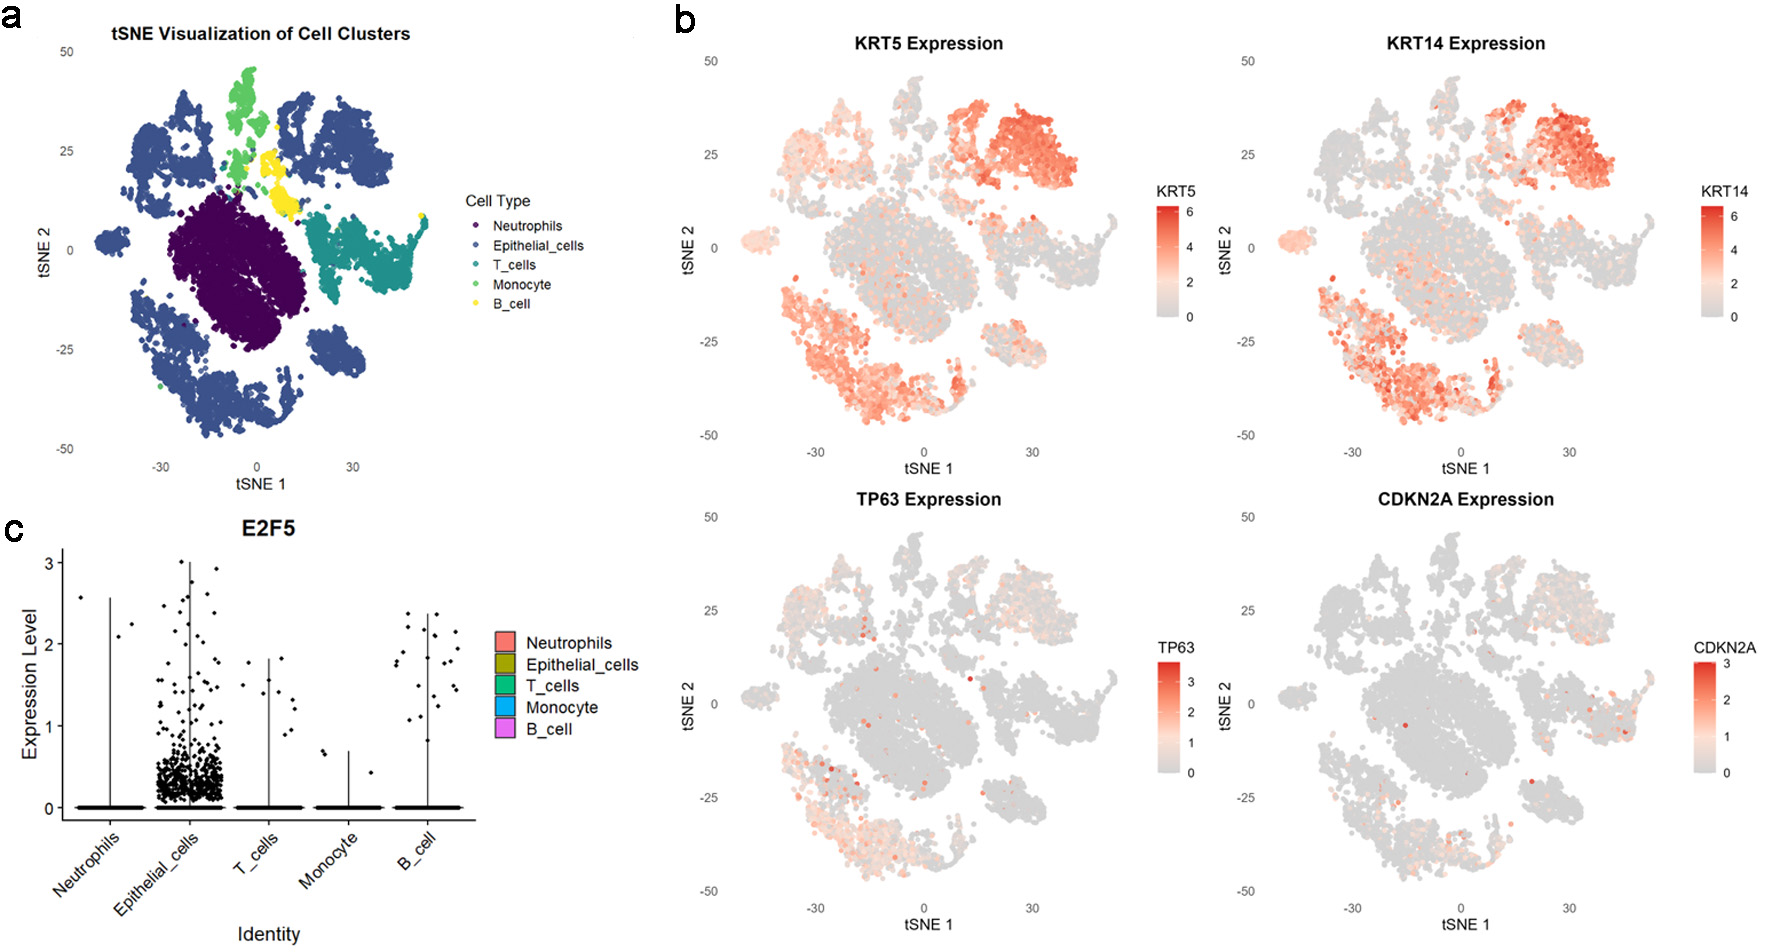
↓ Figure 1. High E2F5 expression in LSCC cells.
(a) tSNE plot showing the distribution of different cell types in the single-cell population. (b) LSCC
cells labeled with KRT5, KRT14, TP63, and CDKN2A. (c) Distribution of E2F5 expression in single-cell RNA
sequencing data from LSCC. LSCC: laryngeal squamous cell carcinoma.
↓ Figure 2. Spatial transcriptomics data confirm
high expression of E2F5 in LSCC tissue. Violin plot of spatial counts, showing gene expression
distribution in LSCC samples, accompanied by the corresponding spatial heat map. Spatial expression map
of E2F5 in LSCC tissue for samples. LSCC: laryngeal squamous cell carcinoma.

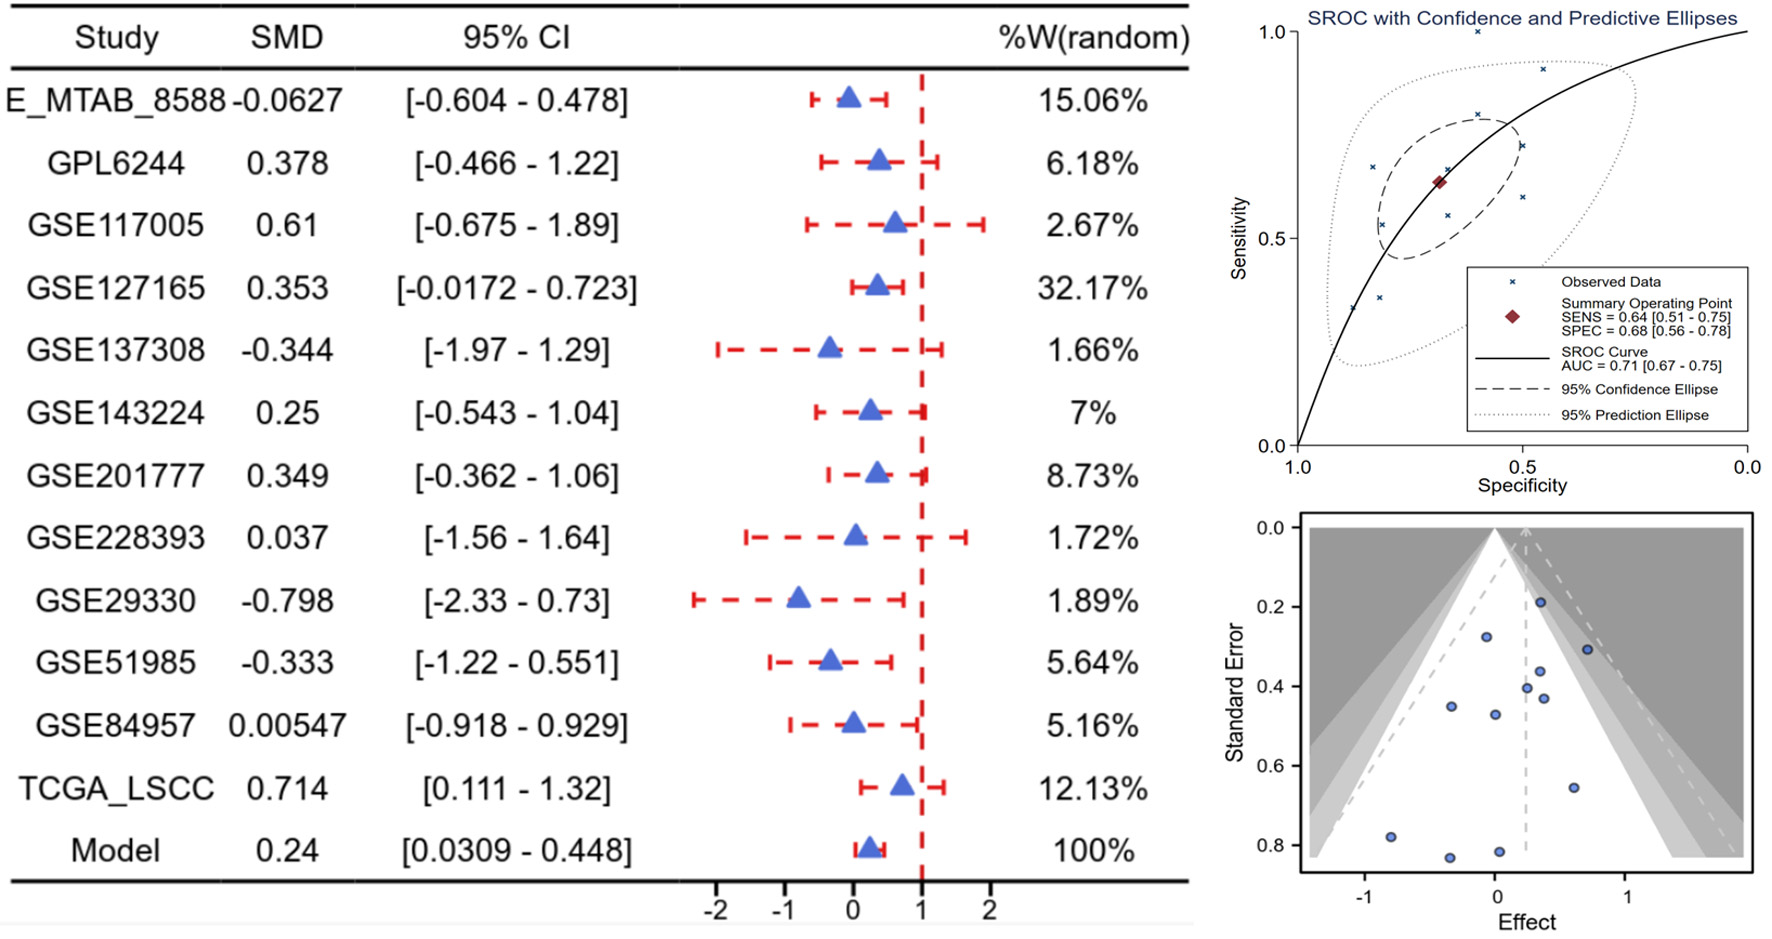
↓ Figure 3. High E2F5 expression in LSCC at the
mRNA level. Forest plot of SMD and their 95% CI, showing the means, SD, and SMD for each study’s
experimental and control groups. Funnel plot from the Begg test to assess publication bias across
studies. sROC curve, presenting the evaluation of discrimination ability. CI: confidence interval; LSCC:
laryngeal squamous cell carcinoma; SMD: standardized mean difference; sROC: summary receiver operating
characteristic.
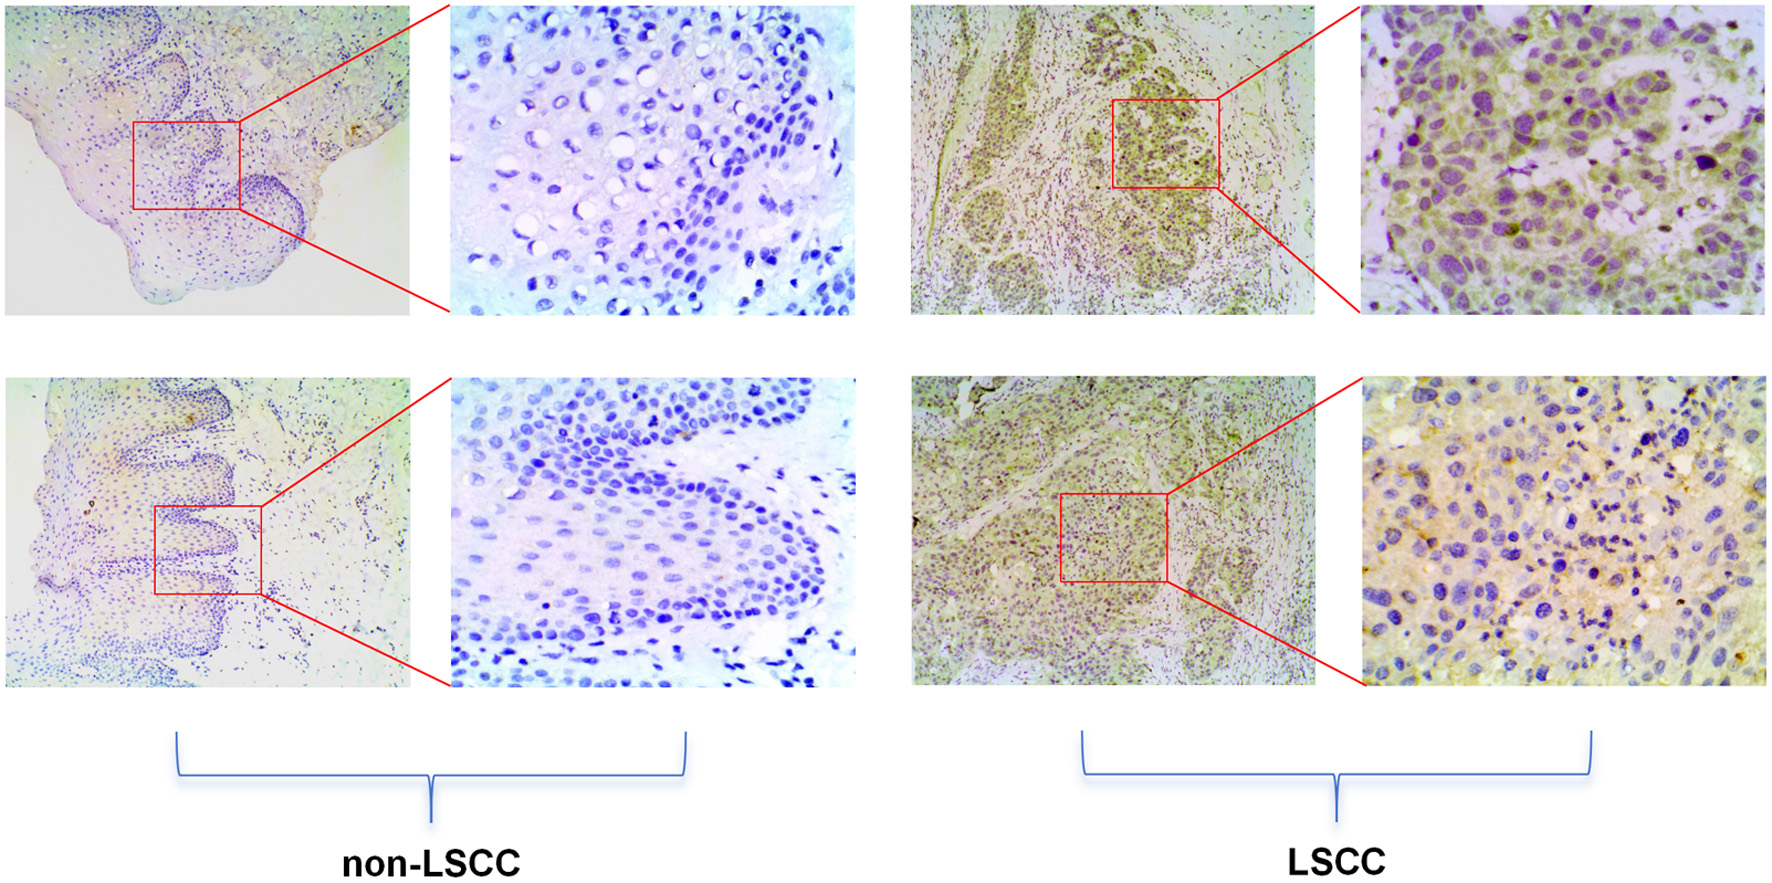
↓ Figure 4. High E2F5 expression in LSCC tissues
at the protein level. The top panel shows immunohistochemical staining of non-LSCC tissues, and the
bottom panel shows immunohistochemical staining of LSCC tissues. LSCC: laryngeal squamous cell
carcinoma.
↓ Figure 5. High E2F5 expression in LSCC tissues
at the protein level, as determined by staining counts. (a) Differential expression honeycomb plot. (b)
ROC curve. LSCC: laryngeal squamous cell carcinoma; ROC: receiver operating characteristic.

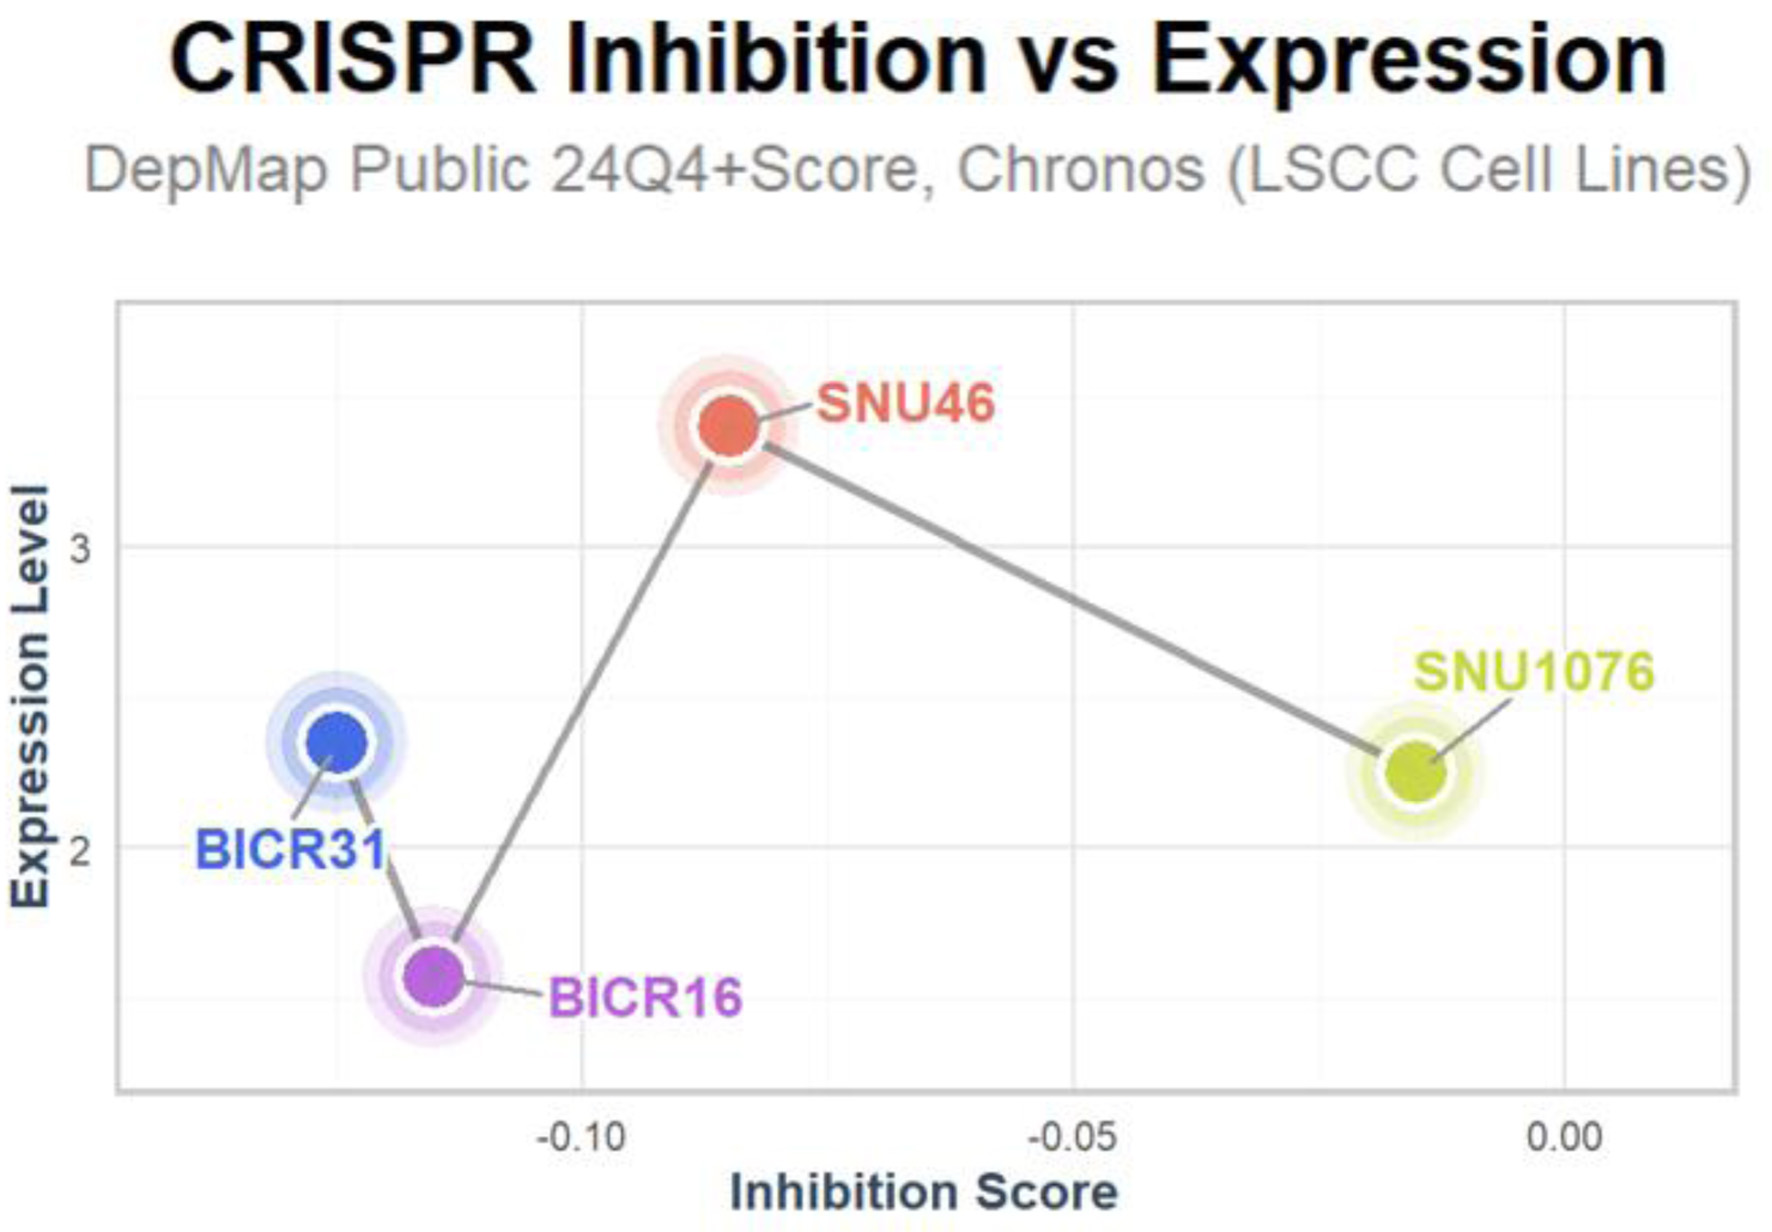
↓ Figure 6. Inhibition of LSCC-related cell lines
upon E2F5 knockdown. LSCC: laryngeal squamous cell carcinoma.
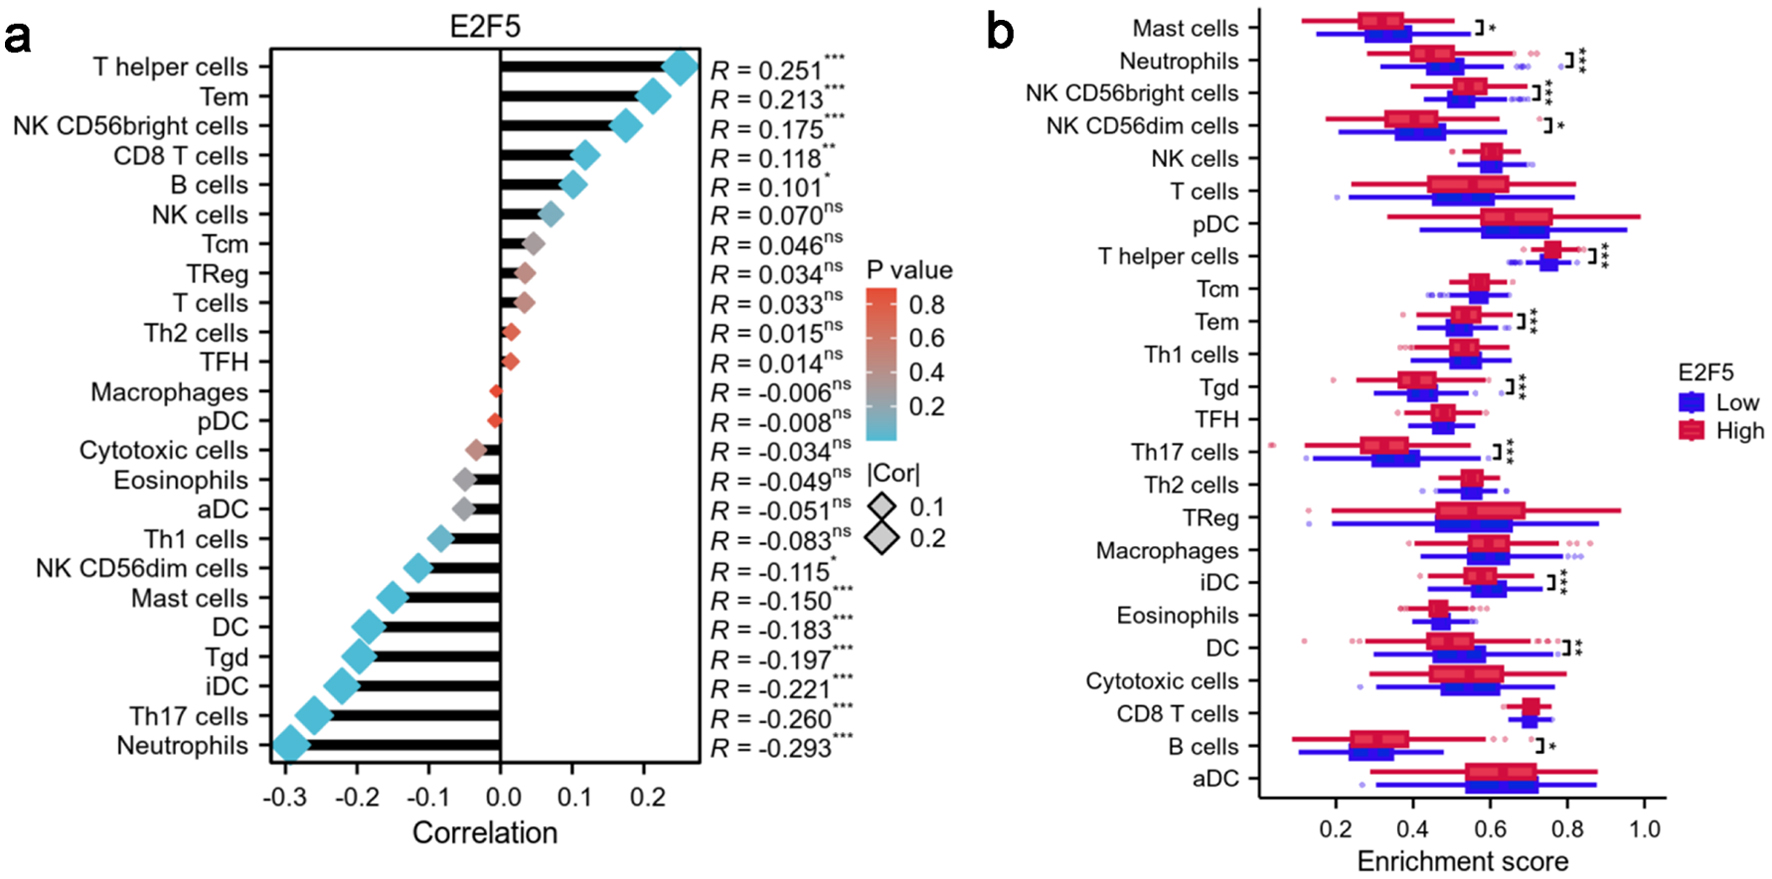
↓ Figure 7. High expression of E2F5 in LSCC
affects the enrichment status of immune cells. (a) Correlation between E2F5 expression and immune cells.
(b) Differences in immune cells between high and low E2F5 expression groups. Significance symbol: *P
< 0.05, **P < 0.01, ***P < 0.001. LSCC: laryngeal squamous cell carcinoma.
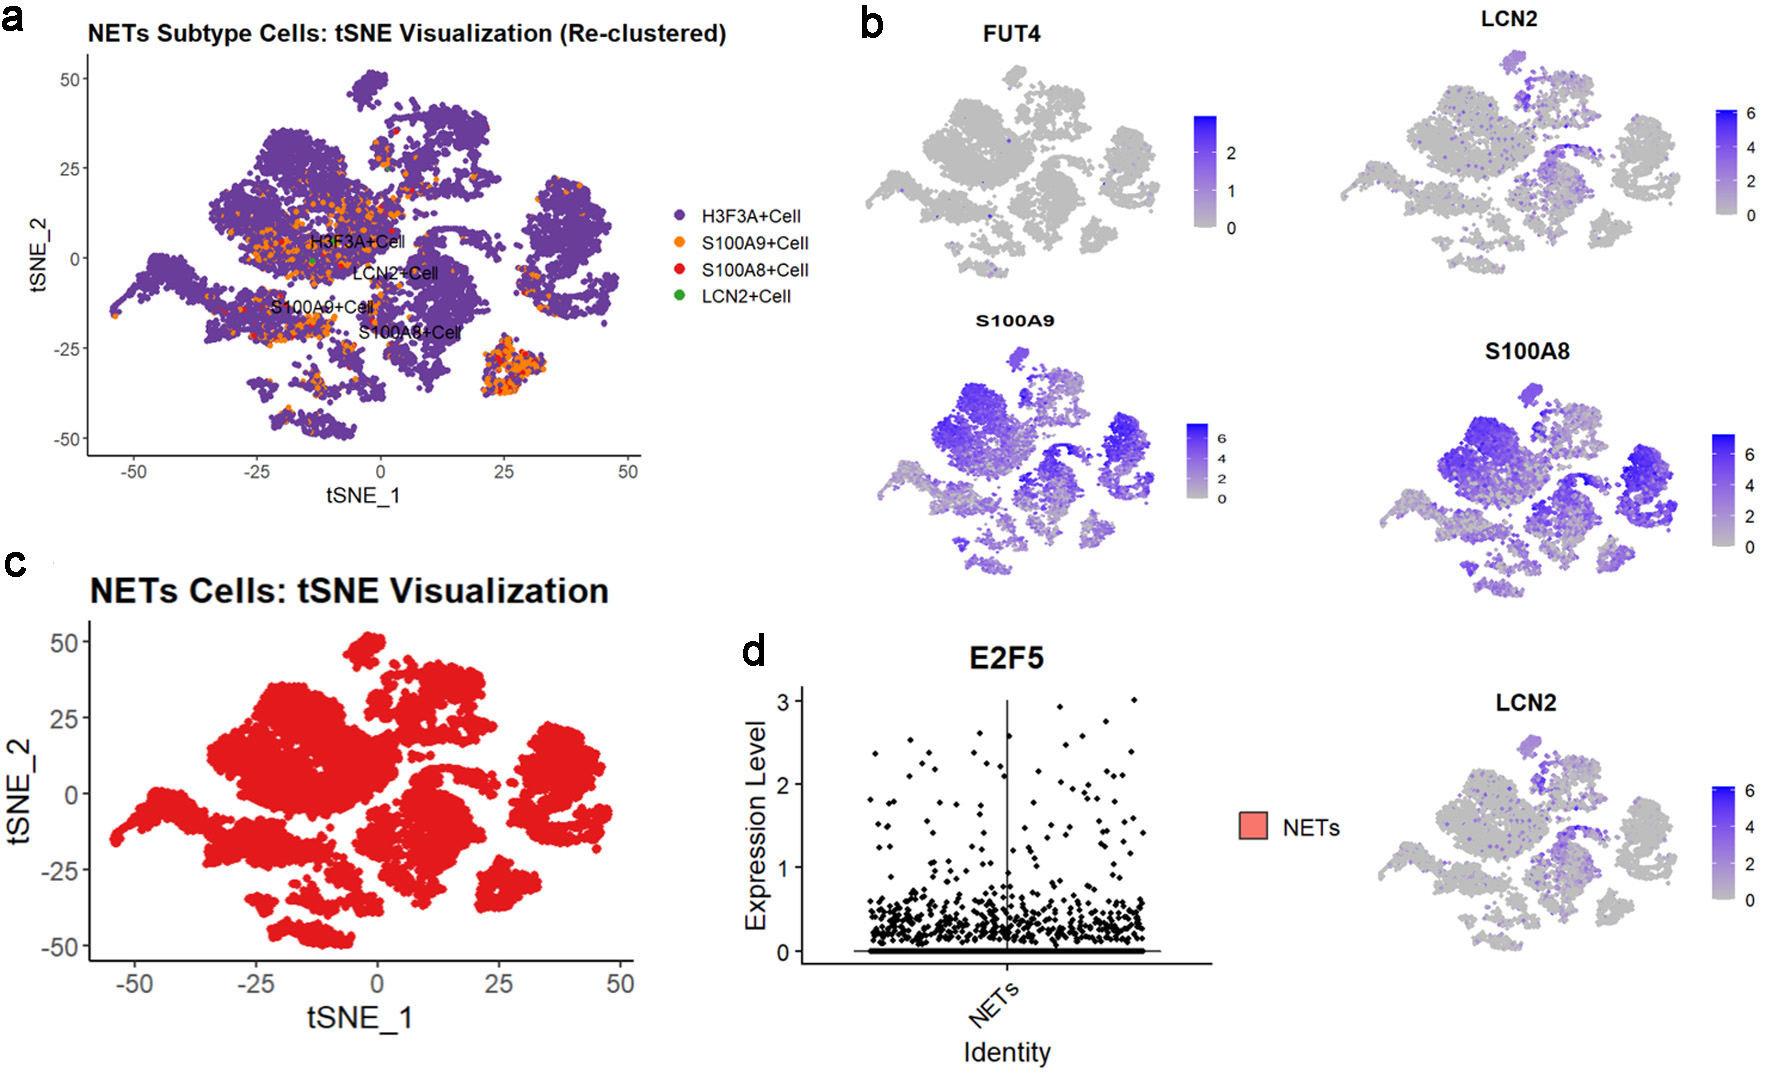
↓ Figure 8. High expression of E2F5 in NETs in
LSCC single-cell RNA sequencing. (a) tSNE subtype plot of NETs expression in LSCC. (b) Expression plot
of NETs-related indicators. (c) Overall tSNE plot of NETs expression in LSCC. (d) Expression of E2F5 in
NETs. LSCC: laryngeal squamous cell carcinoma; NETs: neutrophil extracellular traps.
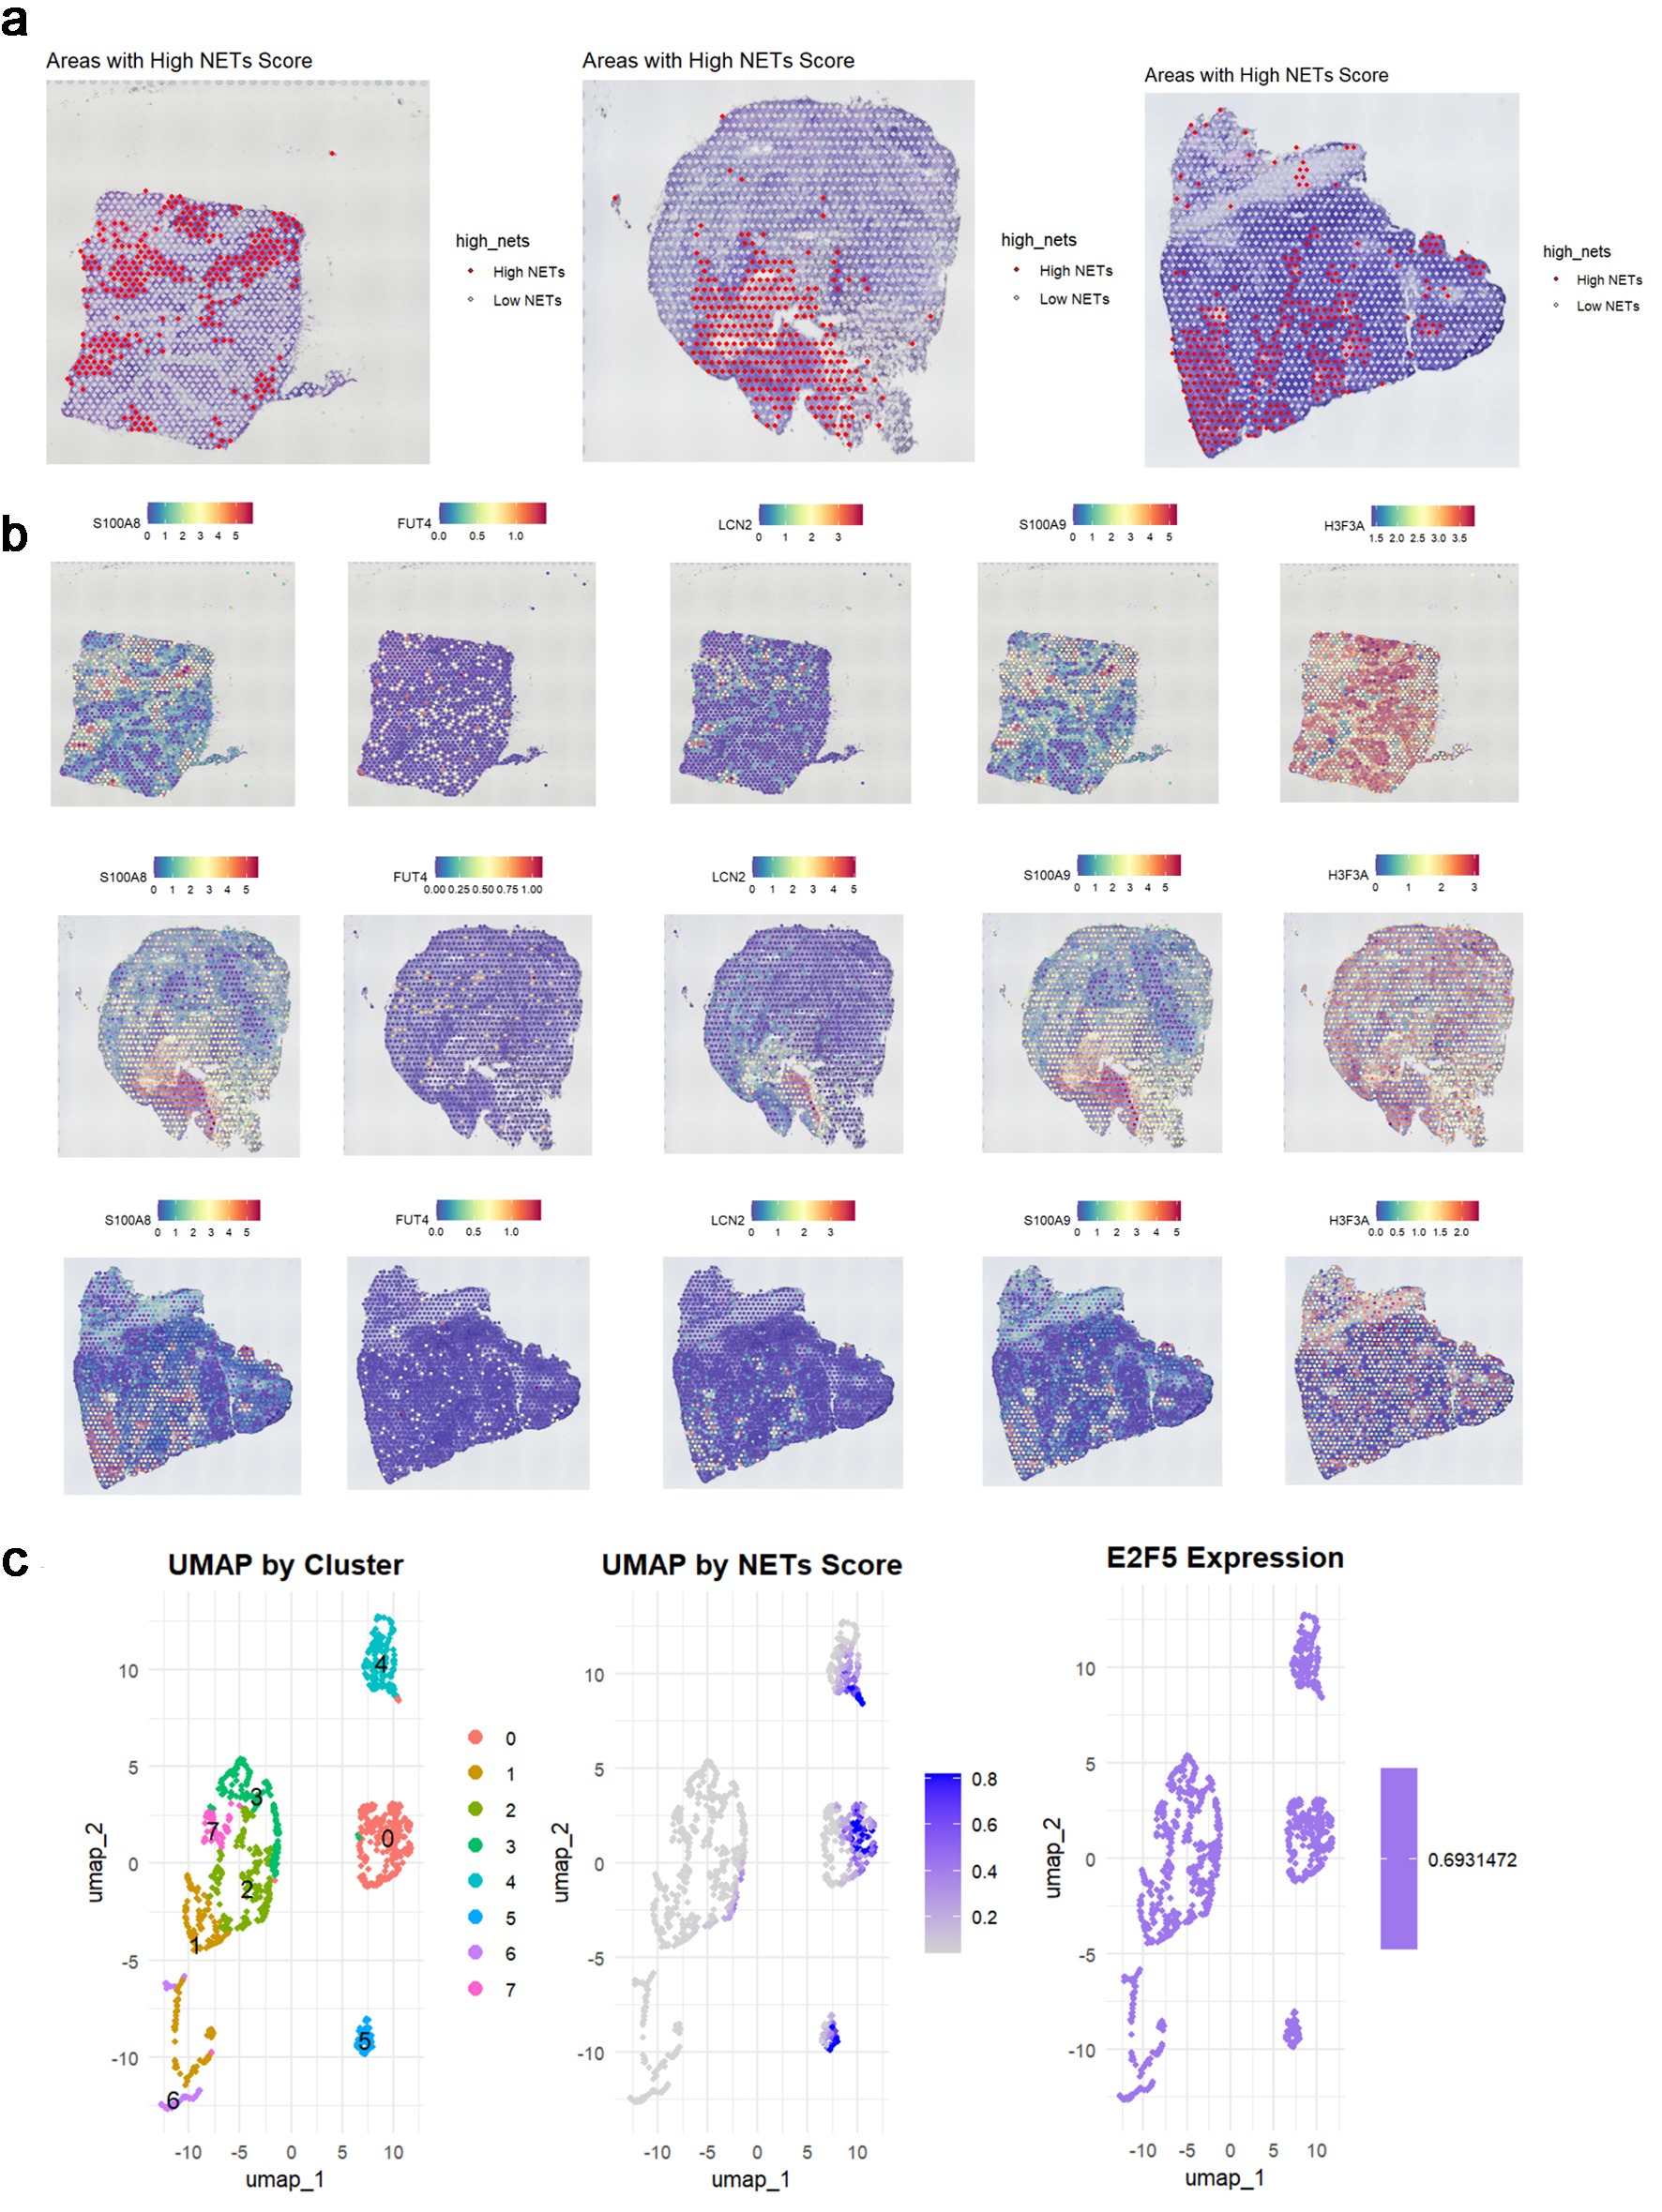
↓ Figure 9. E2F5 expression in LSCC is associated
with neutrophil extracellular traps. (a) Spatial distribution of high and low NETs scores across three
tumor samples. (b) Spatial expression patterns of key NET-associated markers (S100A8, FUT4, LCN2,
S100A9, HSP3A) in corresponding tissue sections. (c) UMAP visualization showing cell clusters, NETs
score distribution, and E2F5 expression pattern in single-cell data. LSCC: laryngeal squamous cell
carcinoma; NETs: neutrophil extracellular traps.
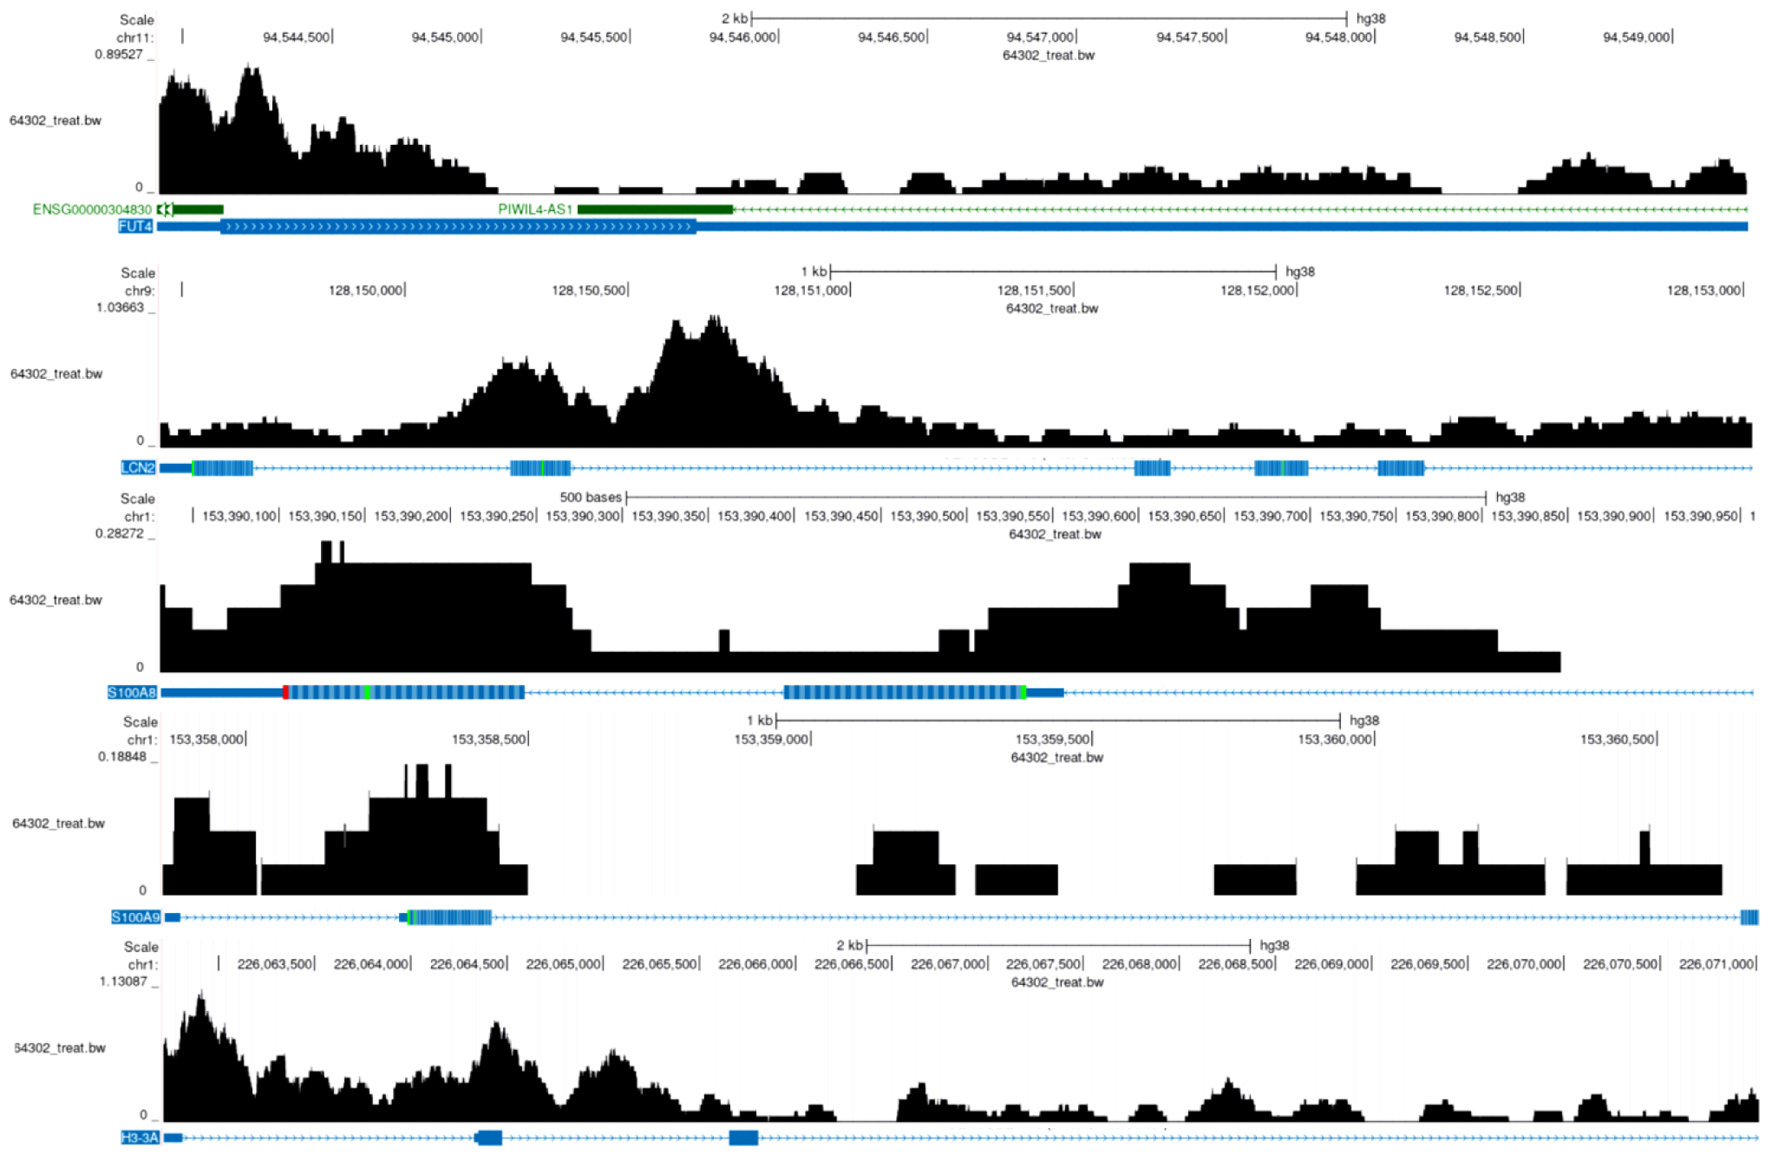
↓ Figure 10. E2F5 transcription factor in
NETs-related regions. The black histogram above represents sequencing read depth (64302_treat_bw), the
middle colored bands indicate predicted functional elements, and the blue markers below show RefSeq
predicted gene models. The gene regions of FUT4, LCN2, S100A8, S100A9, and H3-3A display multiple
binding peaks. NETs: neutrophil extracellular traps.
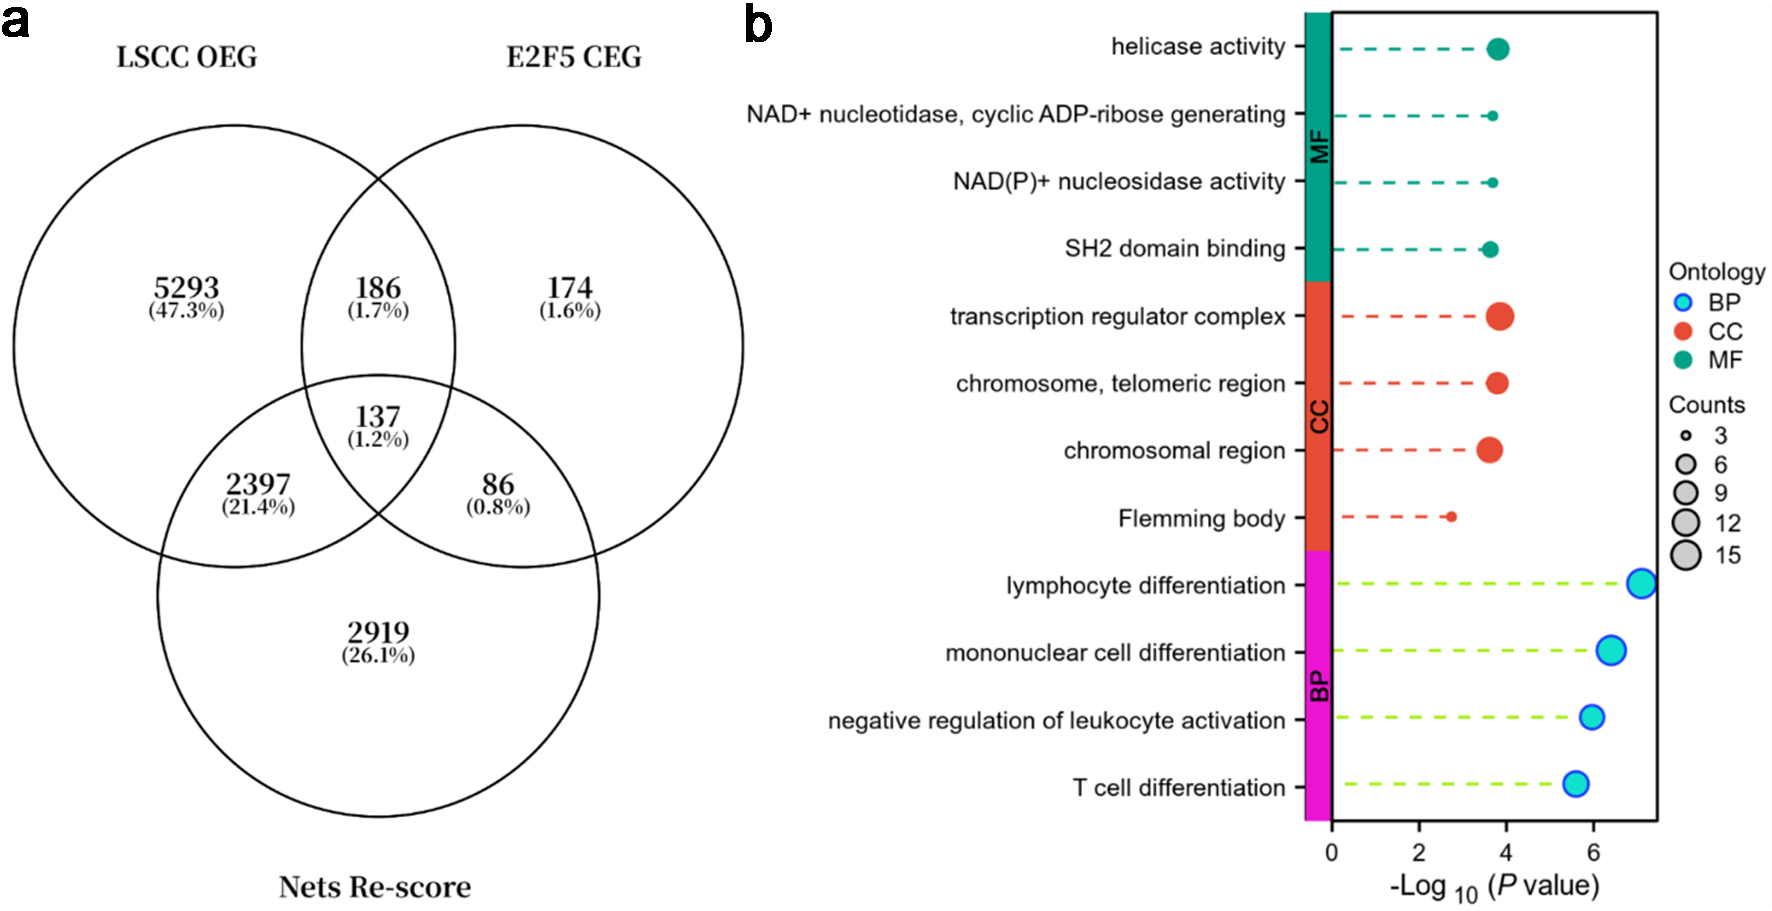
↓ Figure 11. E2F5 and NETs-related genes are
primarily enriched in immune regulation and chromosome/transcription regulation. (a) Venn diagram of
LSCC overexpressed genes (OEGs), E2F5 co-expressed genes (CEGs), and genes with NETs-related scores >
1.5. (b) Gene function enrichment analysis. LSCC: laryngeal squamous cell carcinoma; NETs: neutrophil
extracellular traps.