Figures
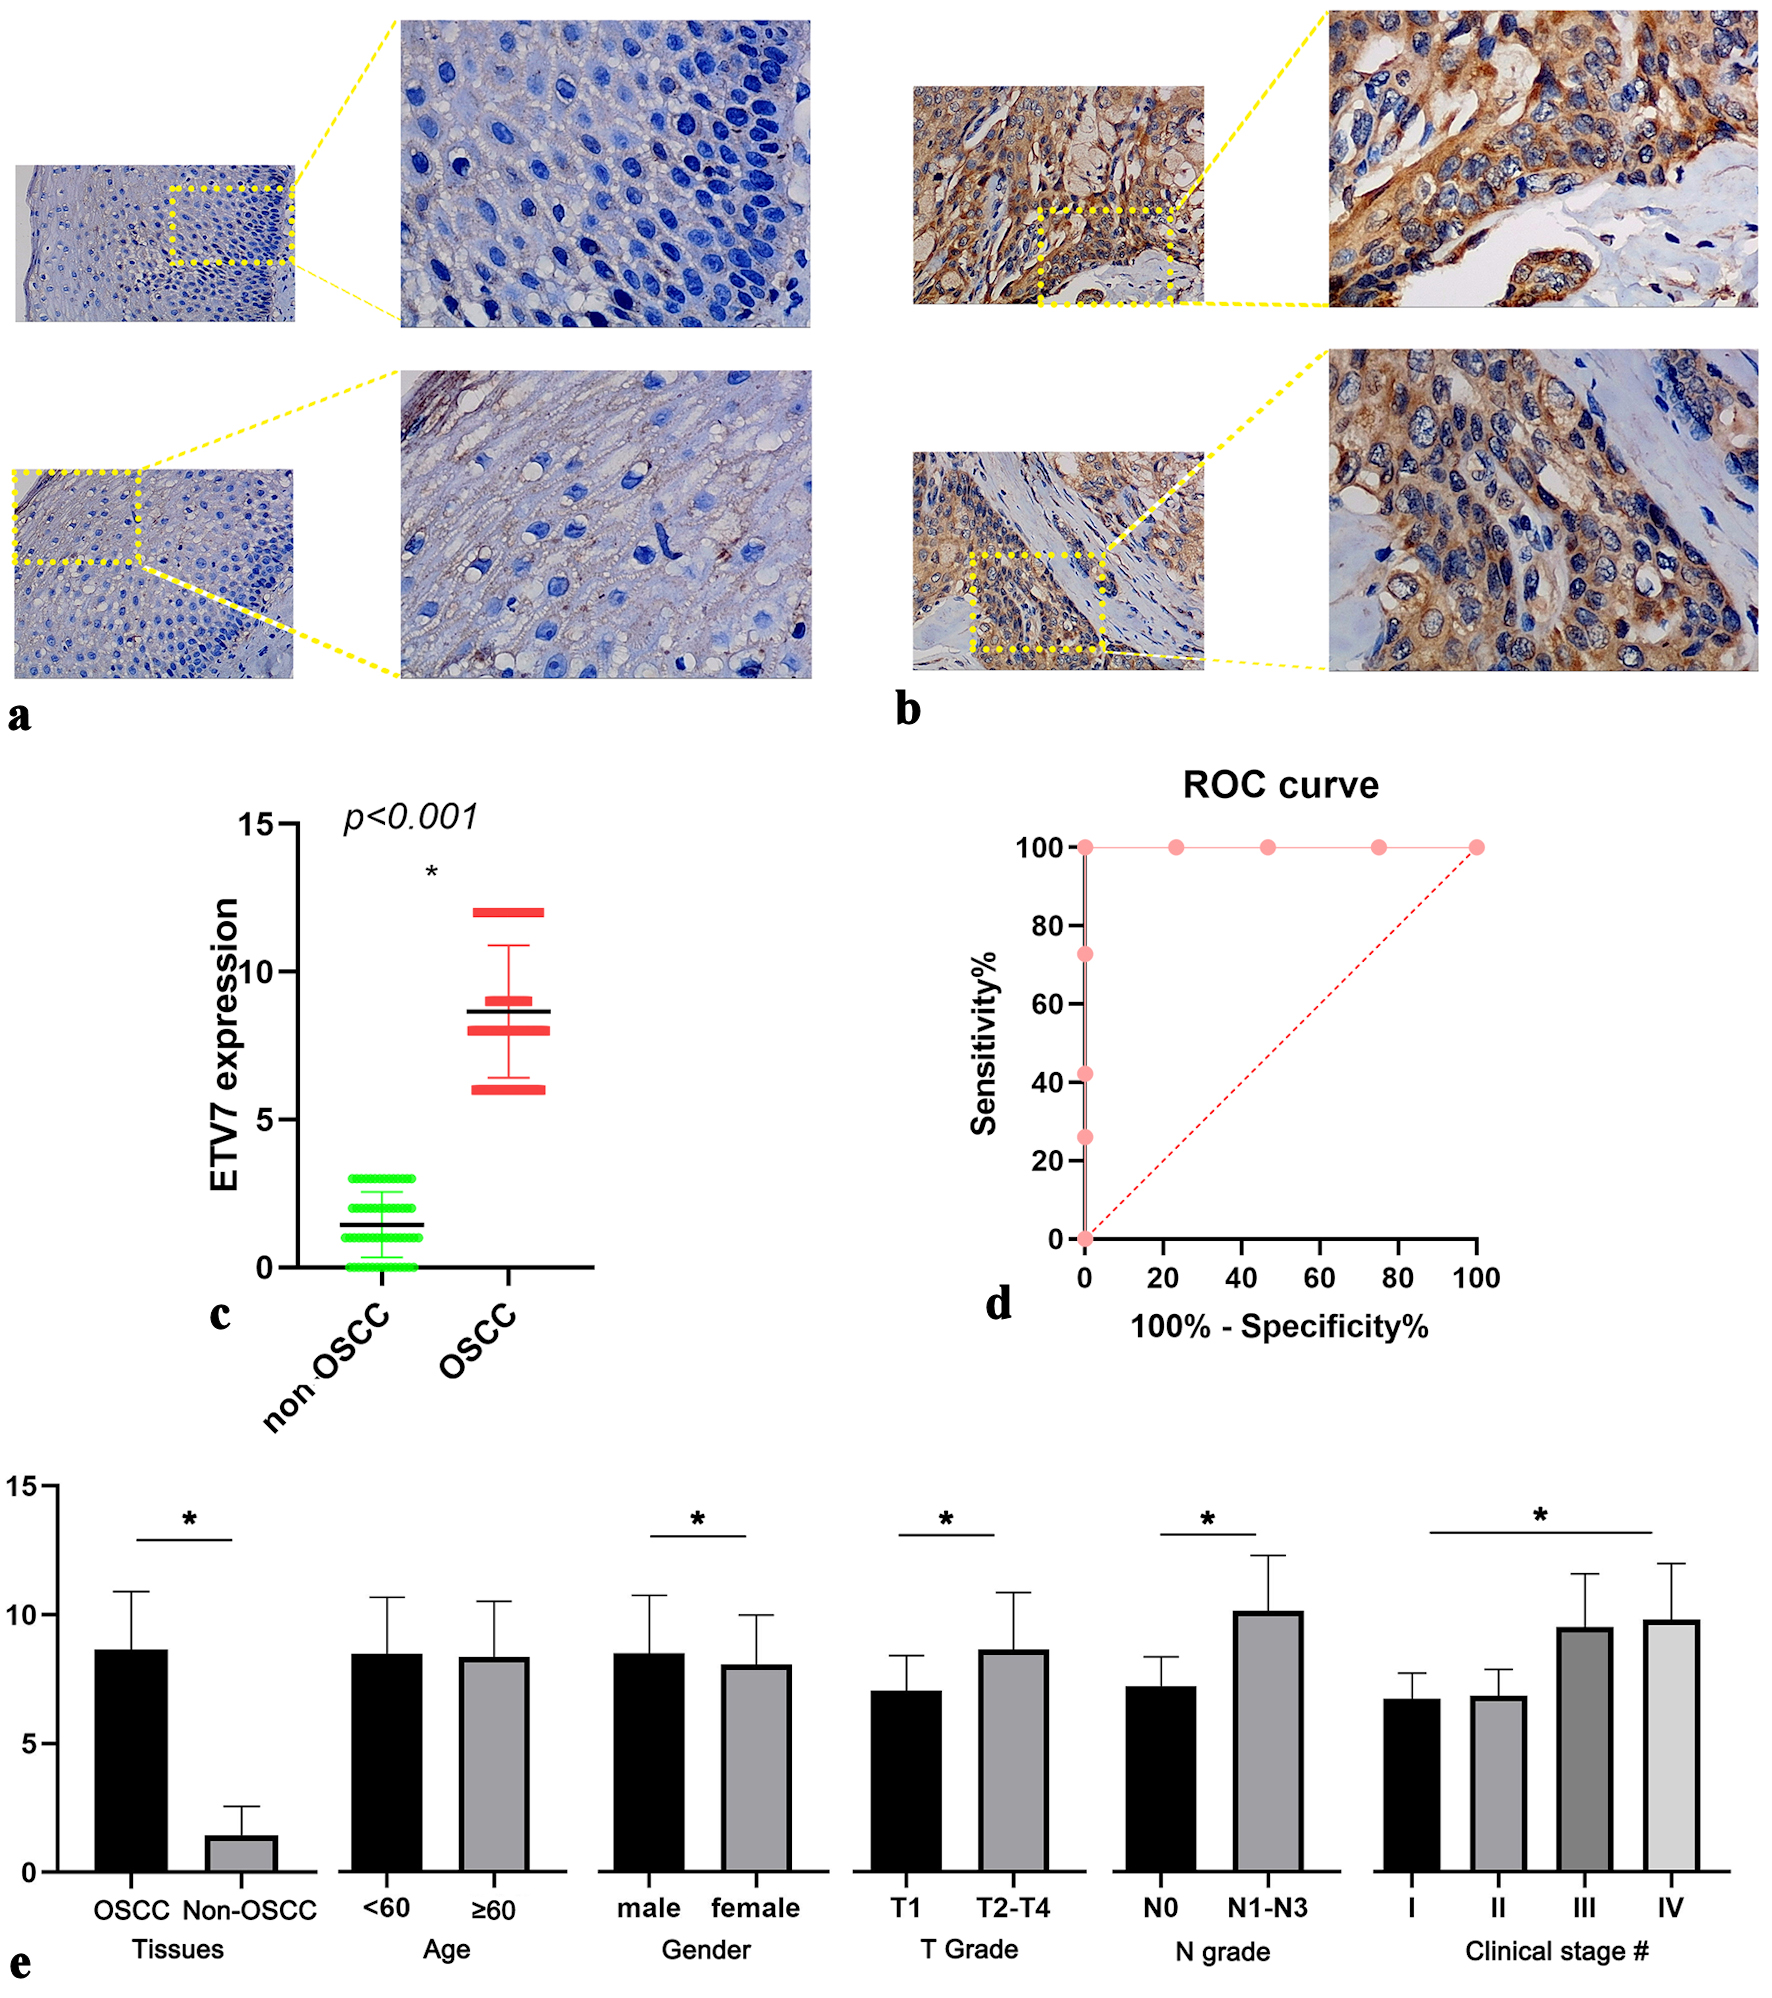
↓ Figure 1. IHC staining of ETV7 expression in
OSCC. (a) Expression of ETV7 in non-OSCC tissues. (b) Expression of ETV7 in OSCC tissues. (c) Different
expression of ETV7 protein between non-OSCC and OSCC tissues. (d) ROC analysis of ETV7 protein
expression in OSCC tissues. (e) Relationship between ETV7 protein level and clinicopathological
parameters of OSCC patients based on the IHC. *P < 0.05. #Clinical stage: I vs. III, I vs. IV, II vs.
III, II vs. IV, P < 0.001. Early stage (I and II) vs. advanced stage (III and IV) P < 0.001. IHC:
immunohistochemistry; ETV7: E26 transformation-specific variant transcription factor 7; OSCC: oral
squamous cell carcinoma; ROC: receiver operating characteristic.
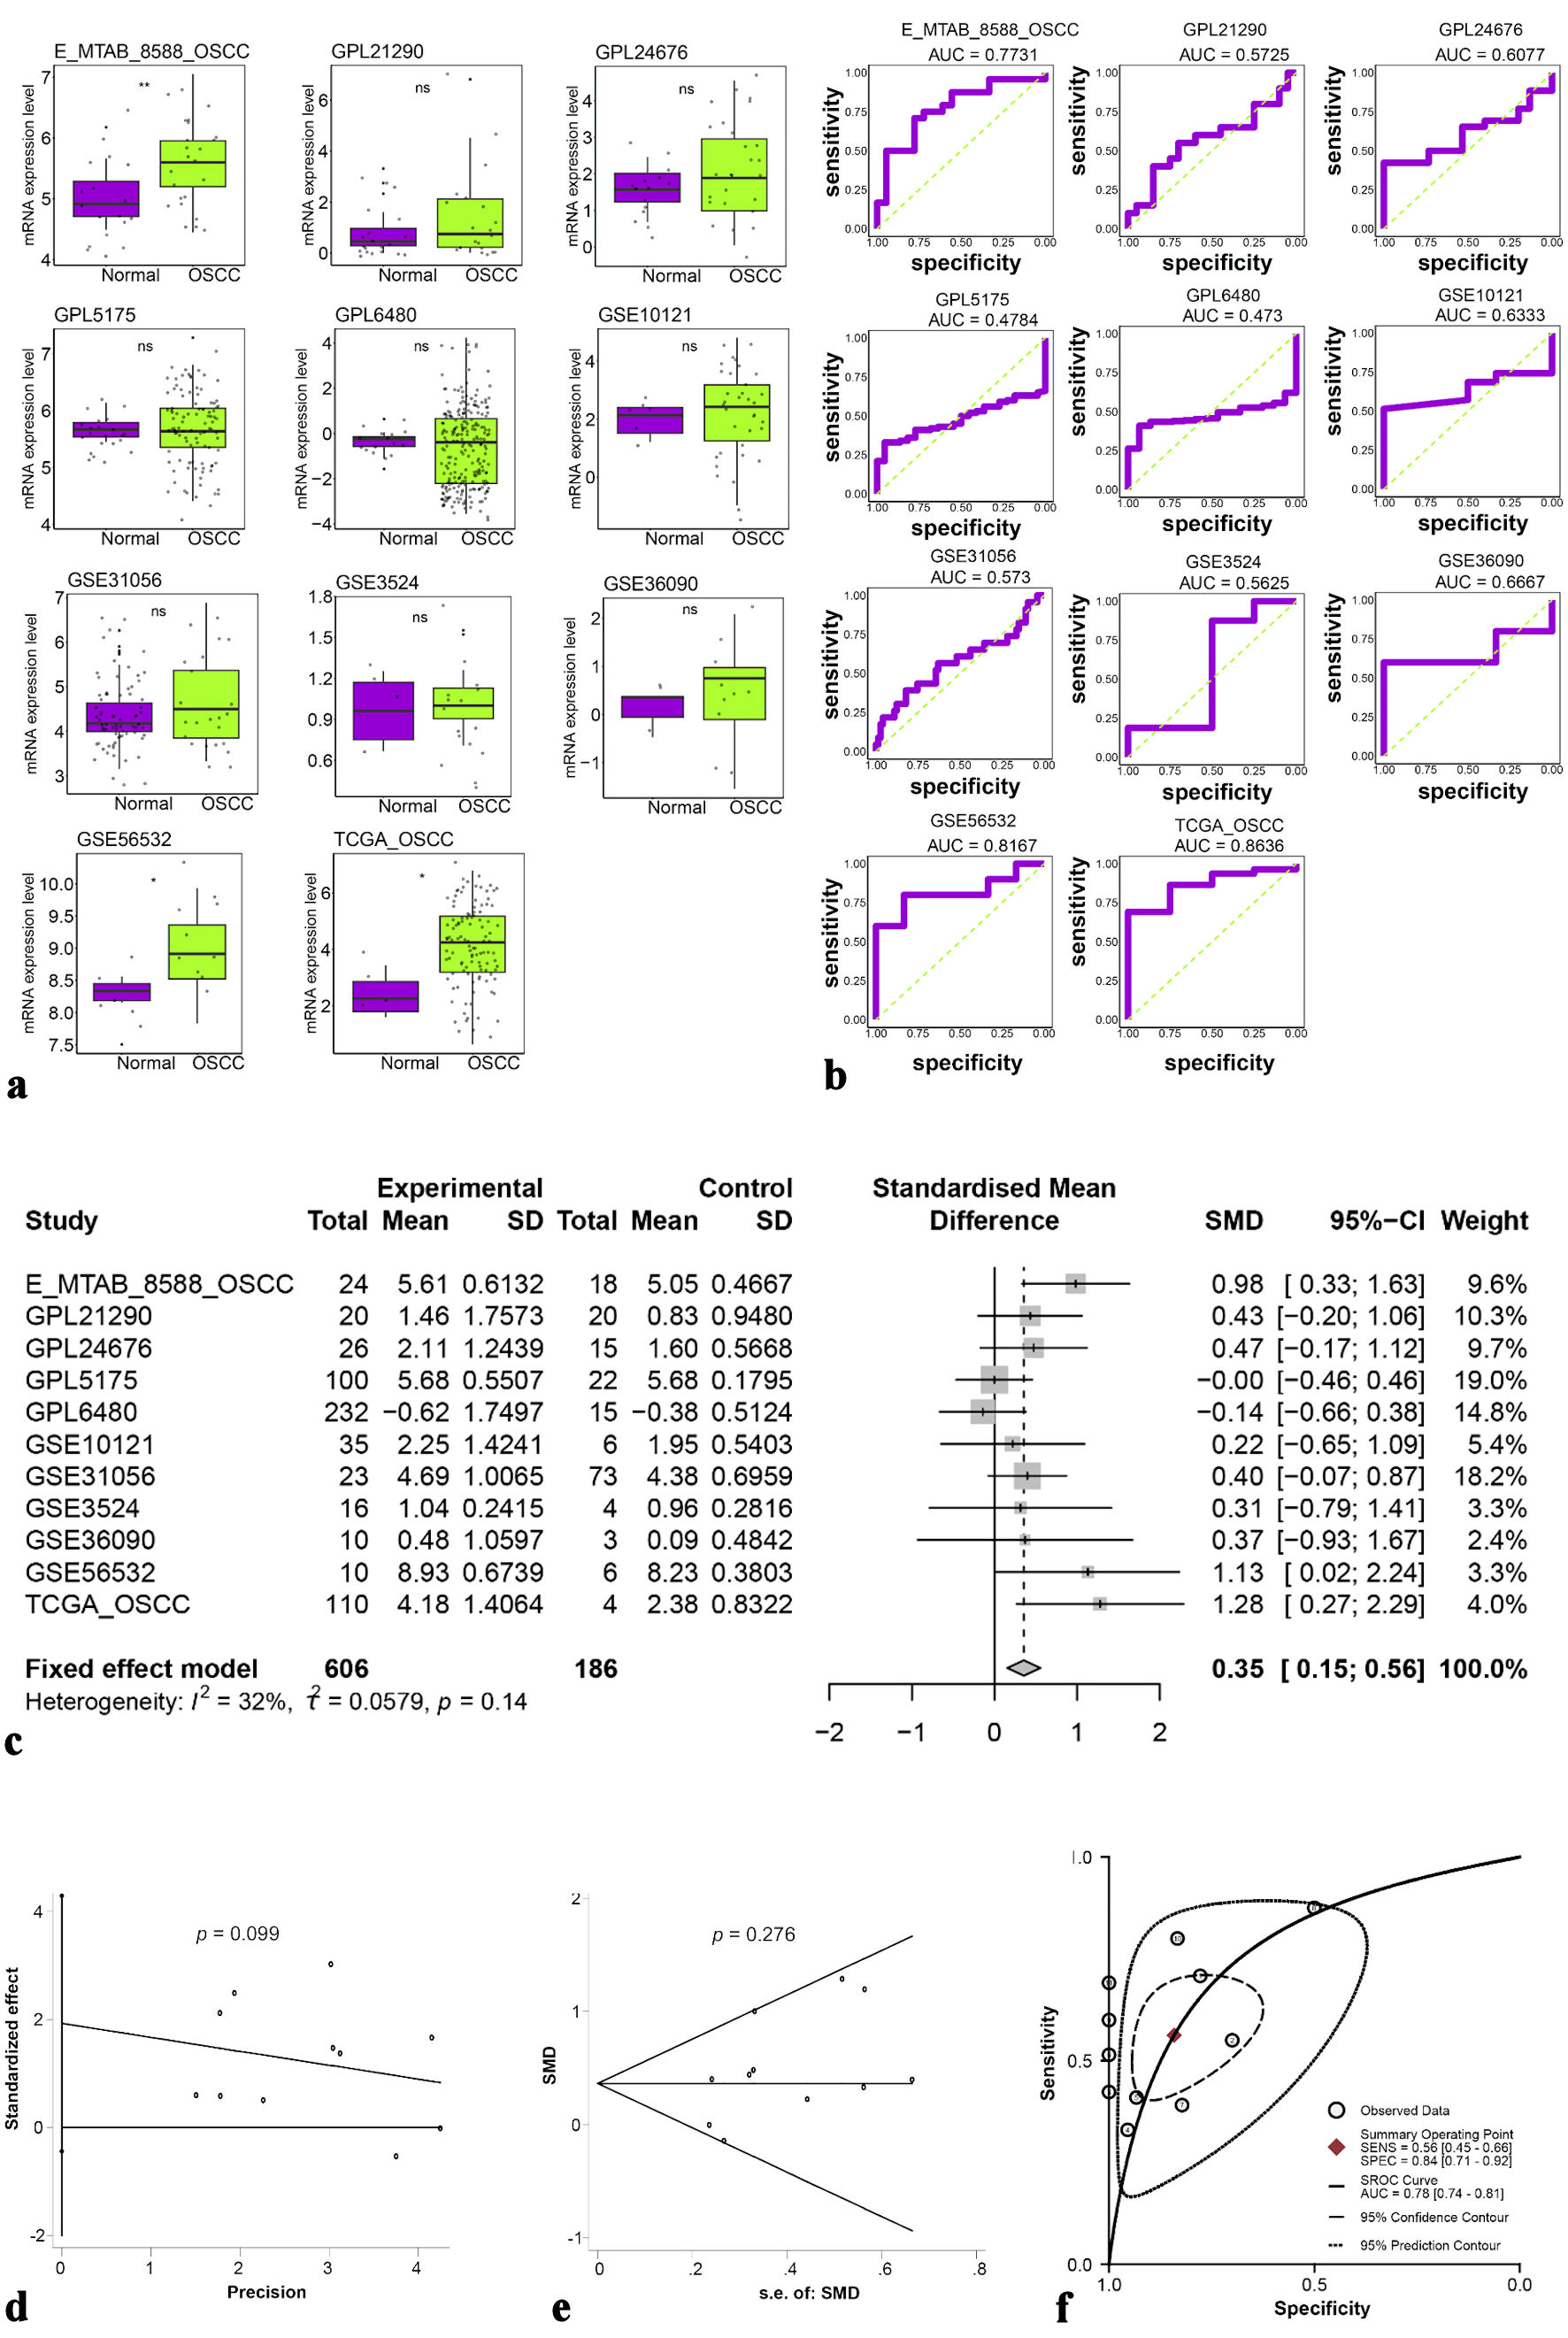
↓ Figure 2. (a) Different expressions of ETV7
mRNA. (b) ROC analysis of ETV7 mRNA expression in each dataset. (c) Forest plot of standardized mean
differences of ETV7 mRNA. (d, e) Publication bias test of included datasets. (f) sROC curve of ETV7
mRNA. ETV7: E26 transformation-specific variant transcription factor 7; ROC: receiver operating
characteristic; sROC: summary receiver operating characteristic; SD: standard deviation; SMD:
standardized mean difference; CI: confidence interval.
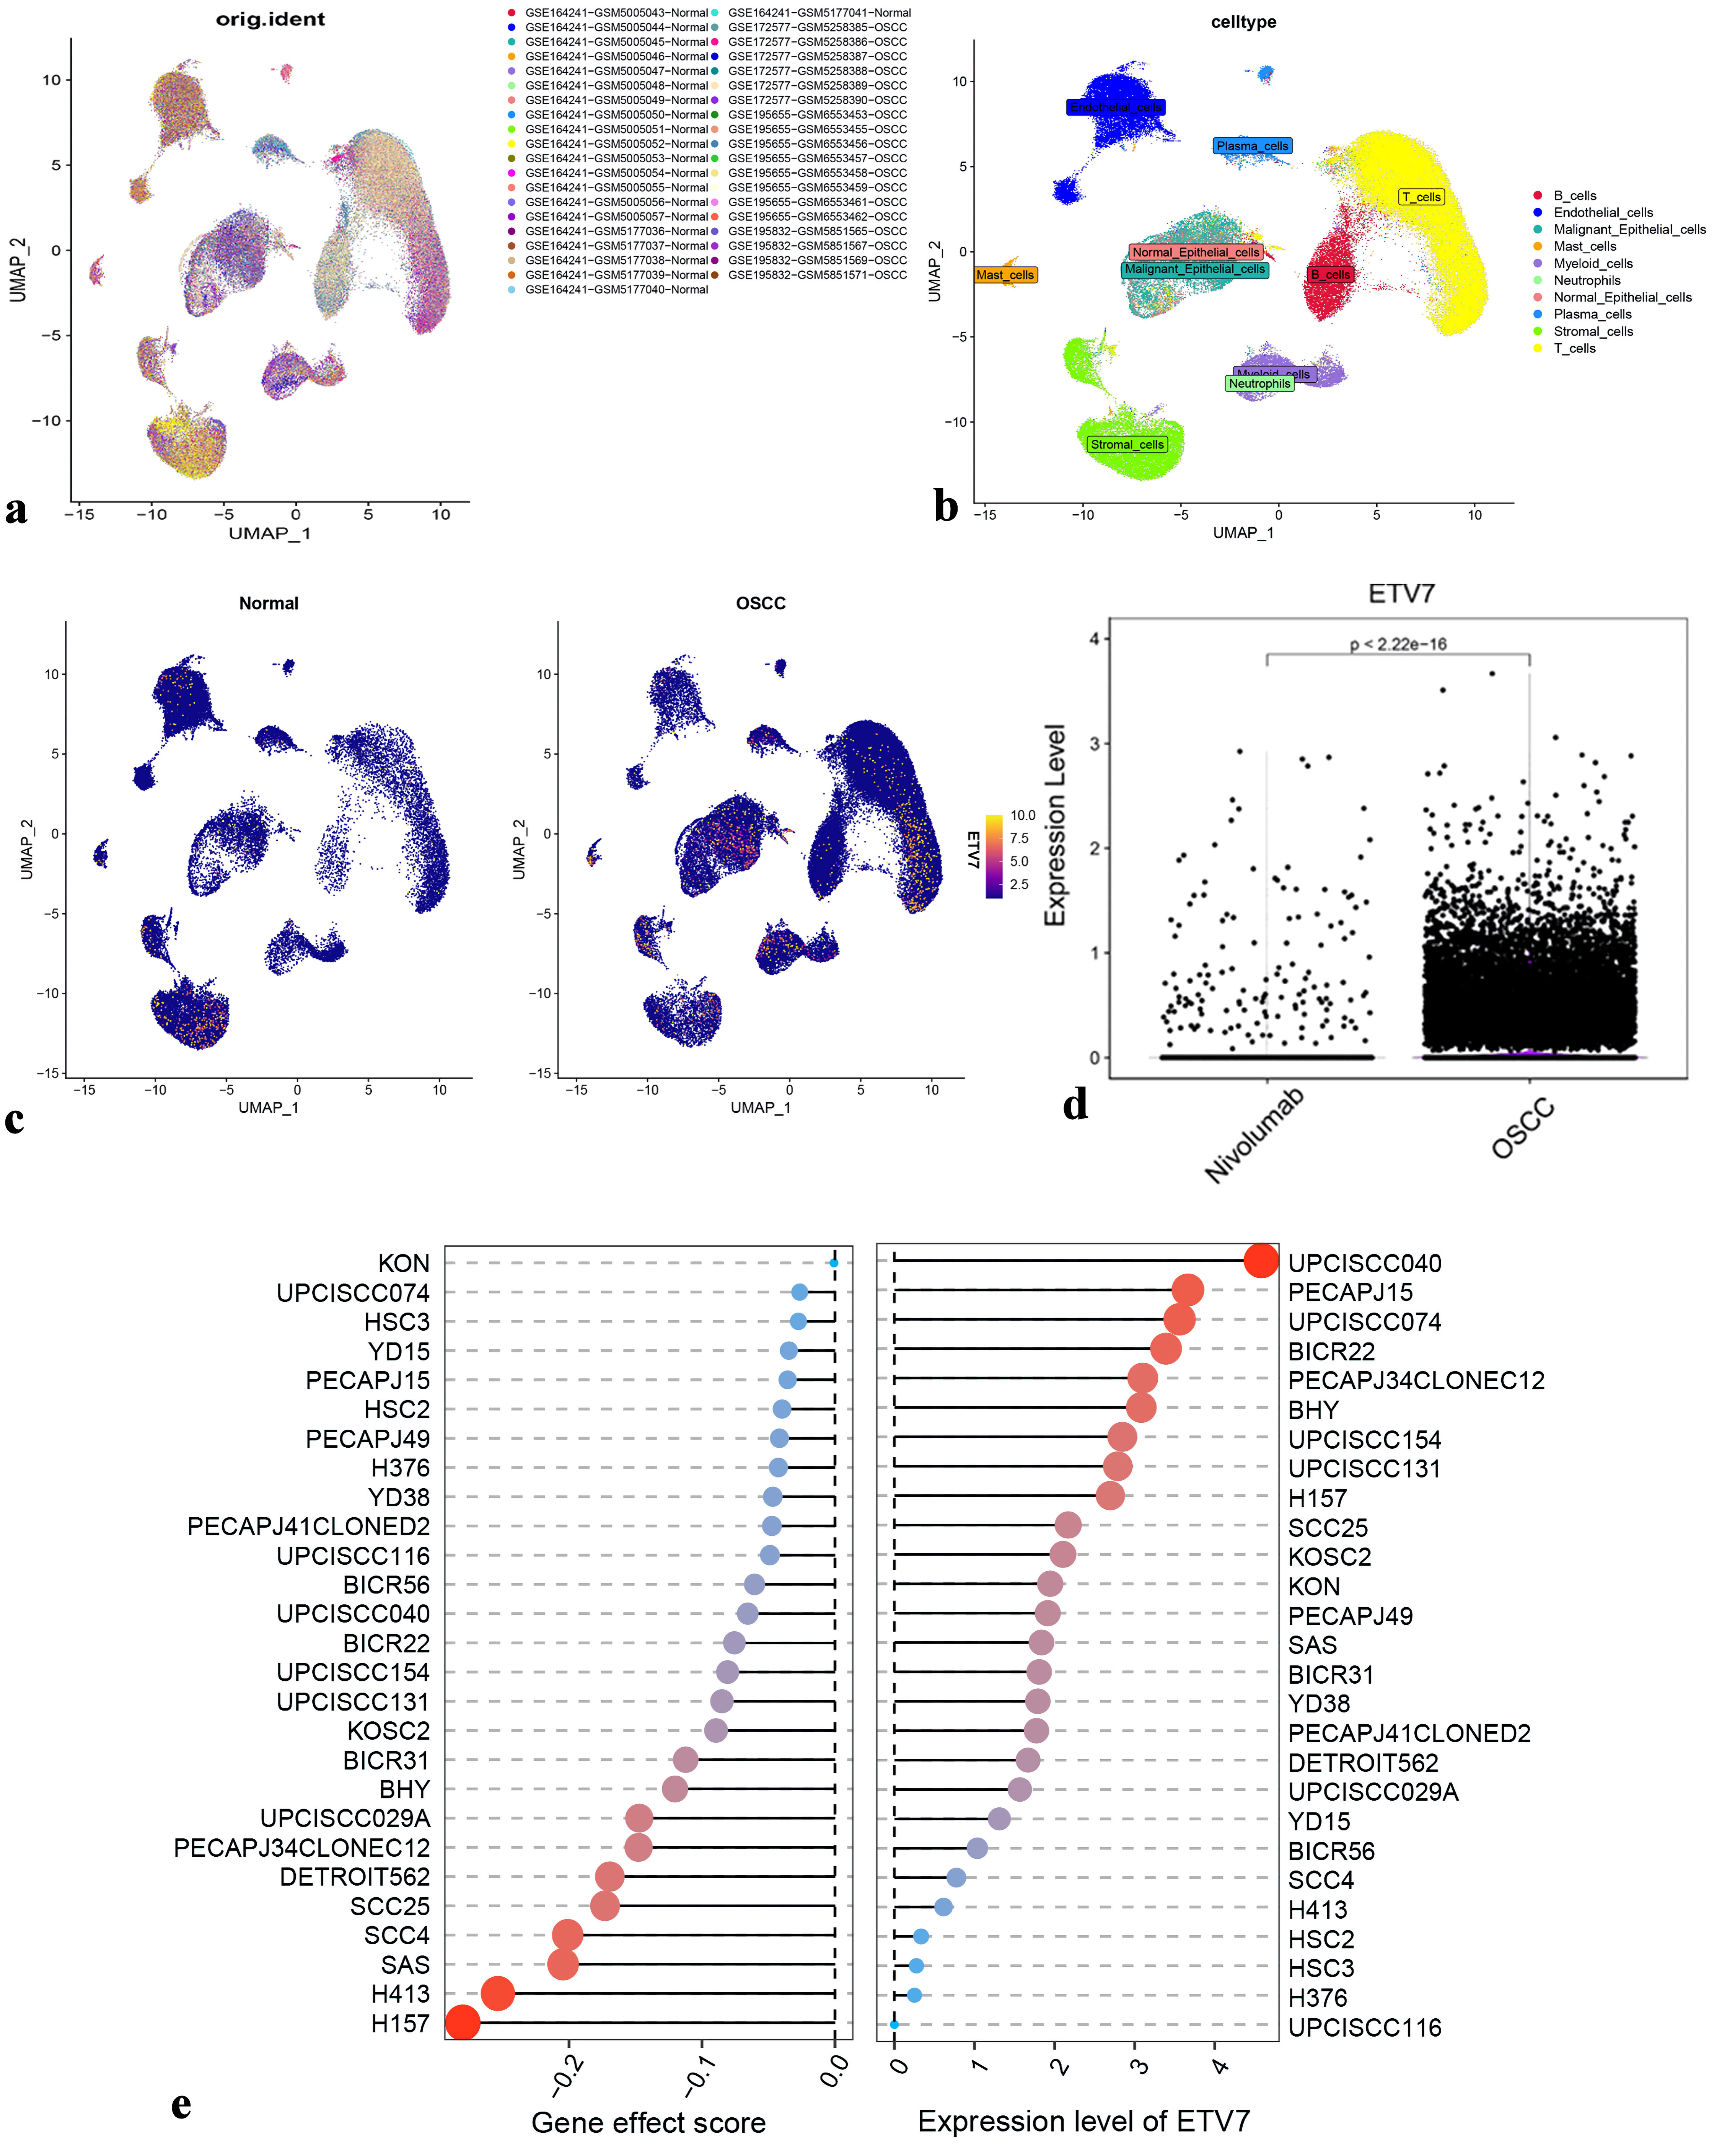
↓ Figure 3. Expression of ETV7 in OSCC different
subpopulations. (a) Cluster analysis for scRNA-seq data. (b) Cell annotation for clusters. (c) Density
plot of ETV7 expression distribution in each cluster. (c) Changes of OSCC cell subsets after nivolumab
treatment. (e) ETV7 expression vs. gene effect in head and neck cancer cell lines. ETV7: E26
transformation-specific variant transcription factor 7; OSCC: oral squamous cell carcinoma; scRNA-seq:
single-cell RNA sequencing.
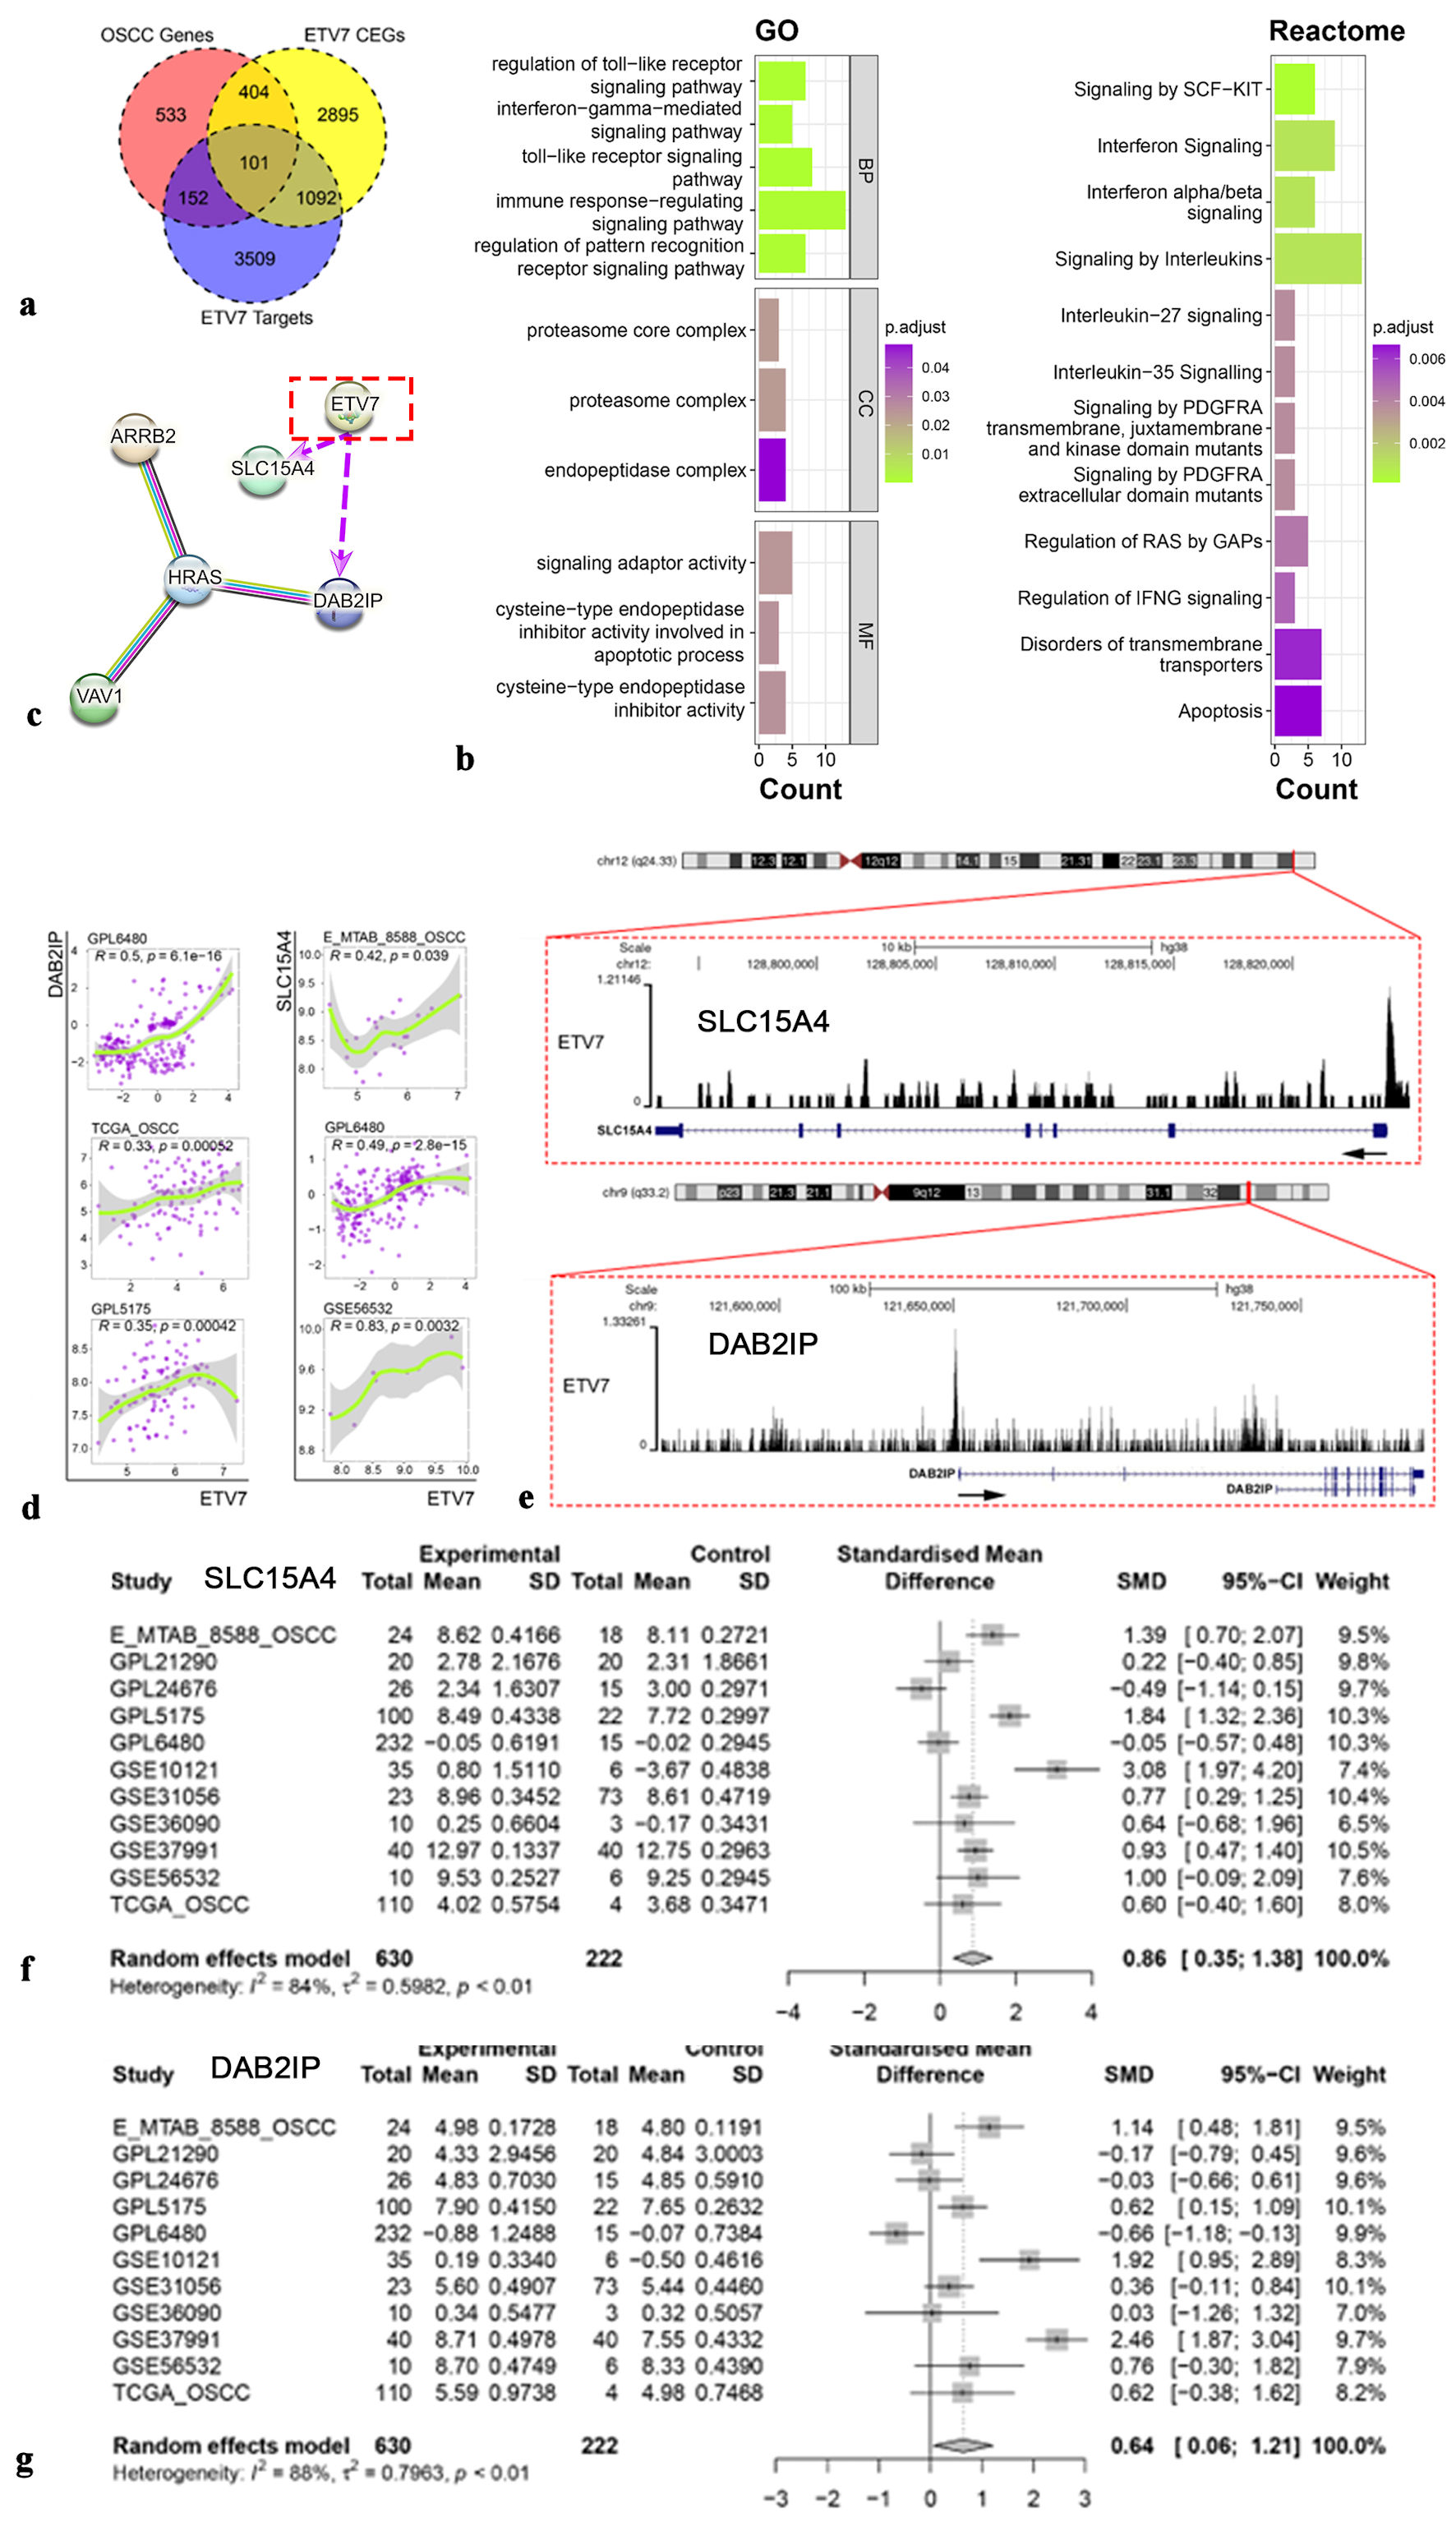
↓ Figure 4. Potential mechanism of ETV7 in OSCC.
(a) The intersection of OSCC overexpressed genes, ETV7 coexpressed genes, and ETV7 targets genes. (b)
Enrichment analysis for ETV7. (c) Protein-protein interactive network for ETV7 (purple arrows indicate
potential positive transcriptional regulatory relationships for ETV7). (d) The relationship between ETV7
and targeted genes SLC15A4 and DAB2IP. (e) SLC15A4 and DAB2IP were potential targets of
ETV7. (f) Different expression of SLC15A4 mRNA in OSCC. (g) Different expression of DAB2IP mRNA in OSCC.
ETV7: E26 transformation-specific variant transcription factor 7; OSCC: oral squamous cell carcinoma;
SD: standard deviation; SMD: standardized mean difference; CI: confidence interval.
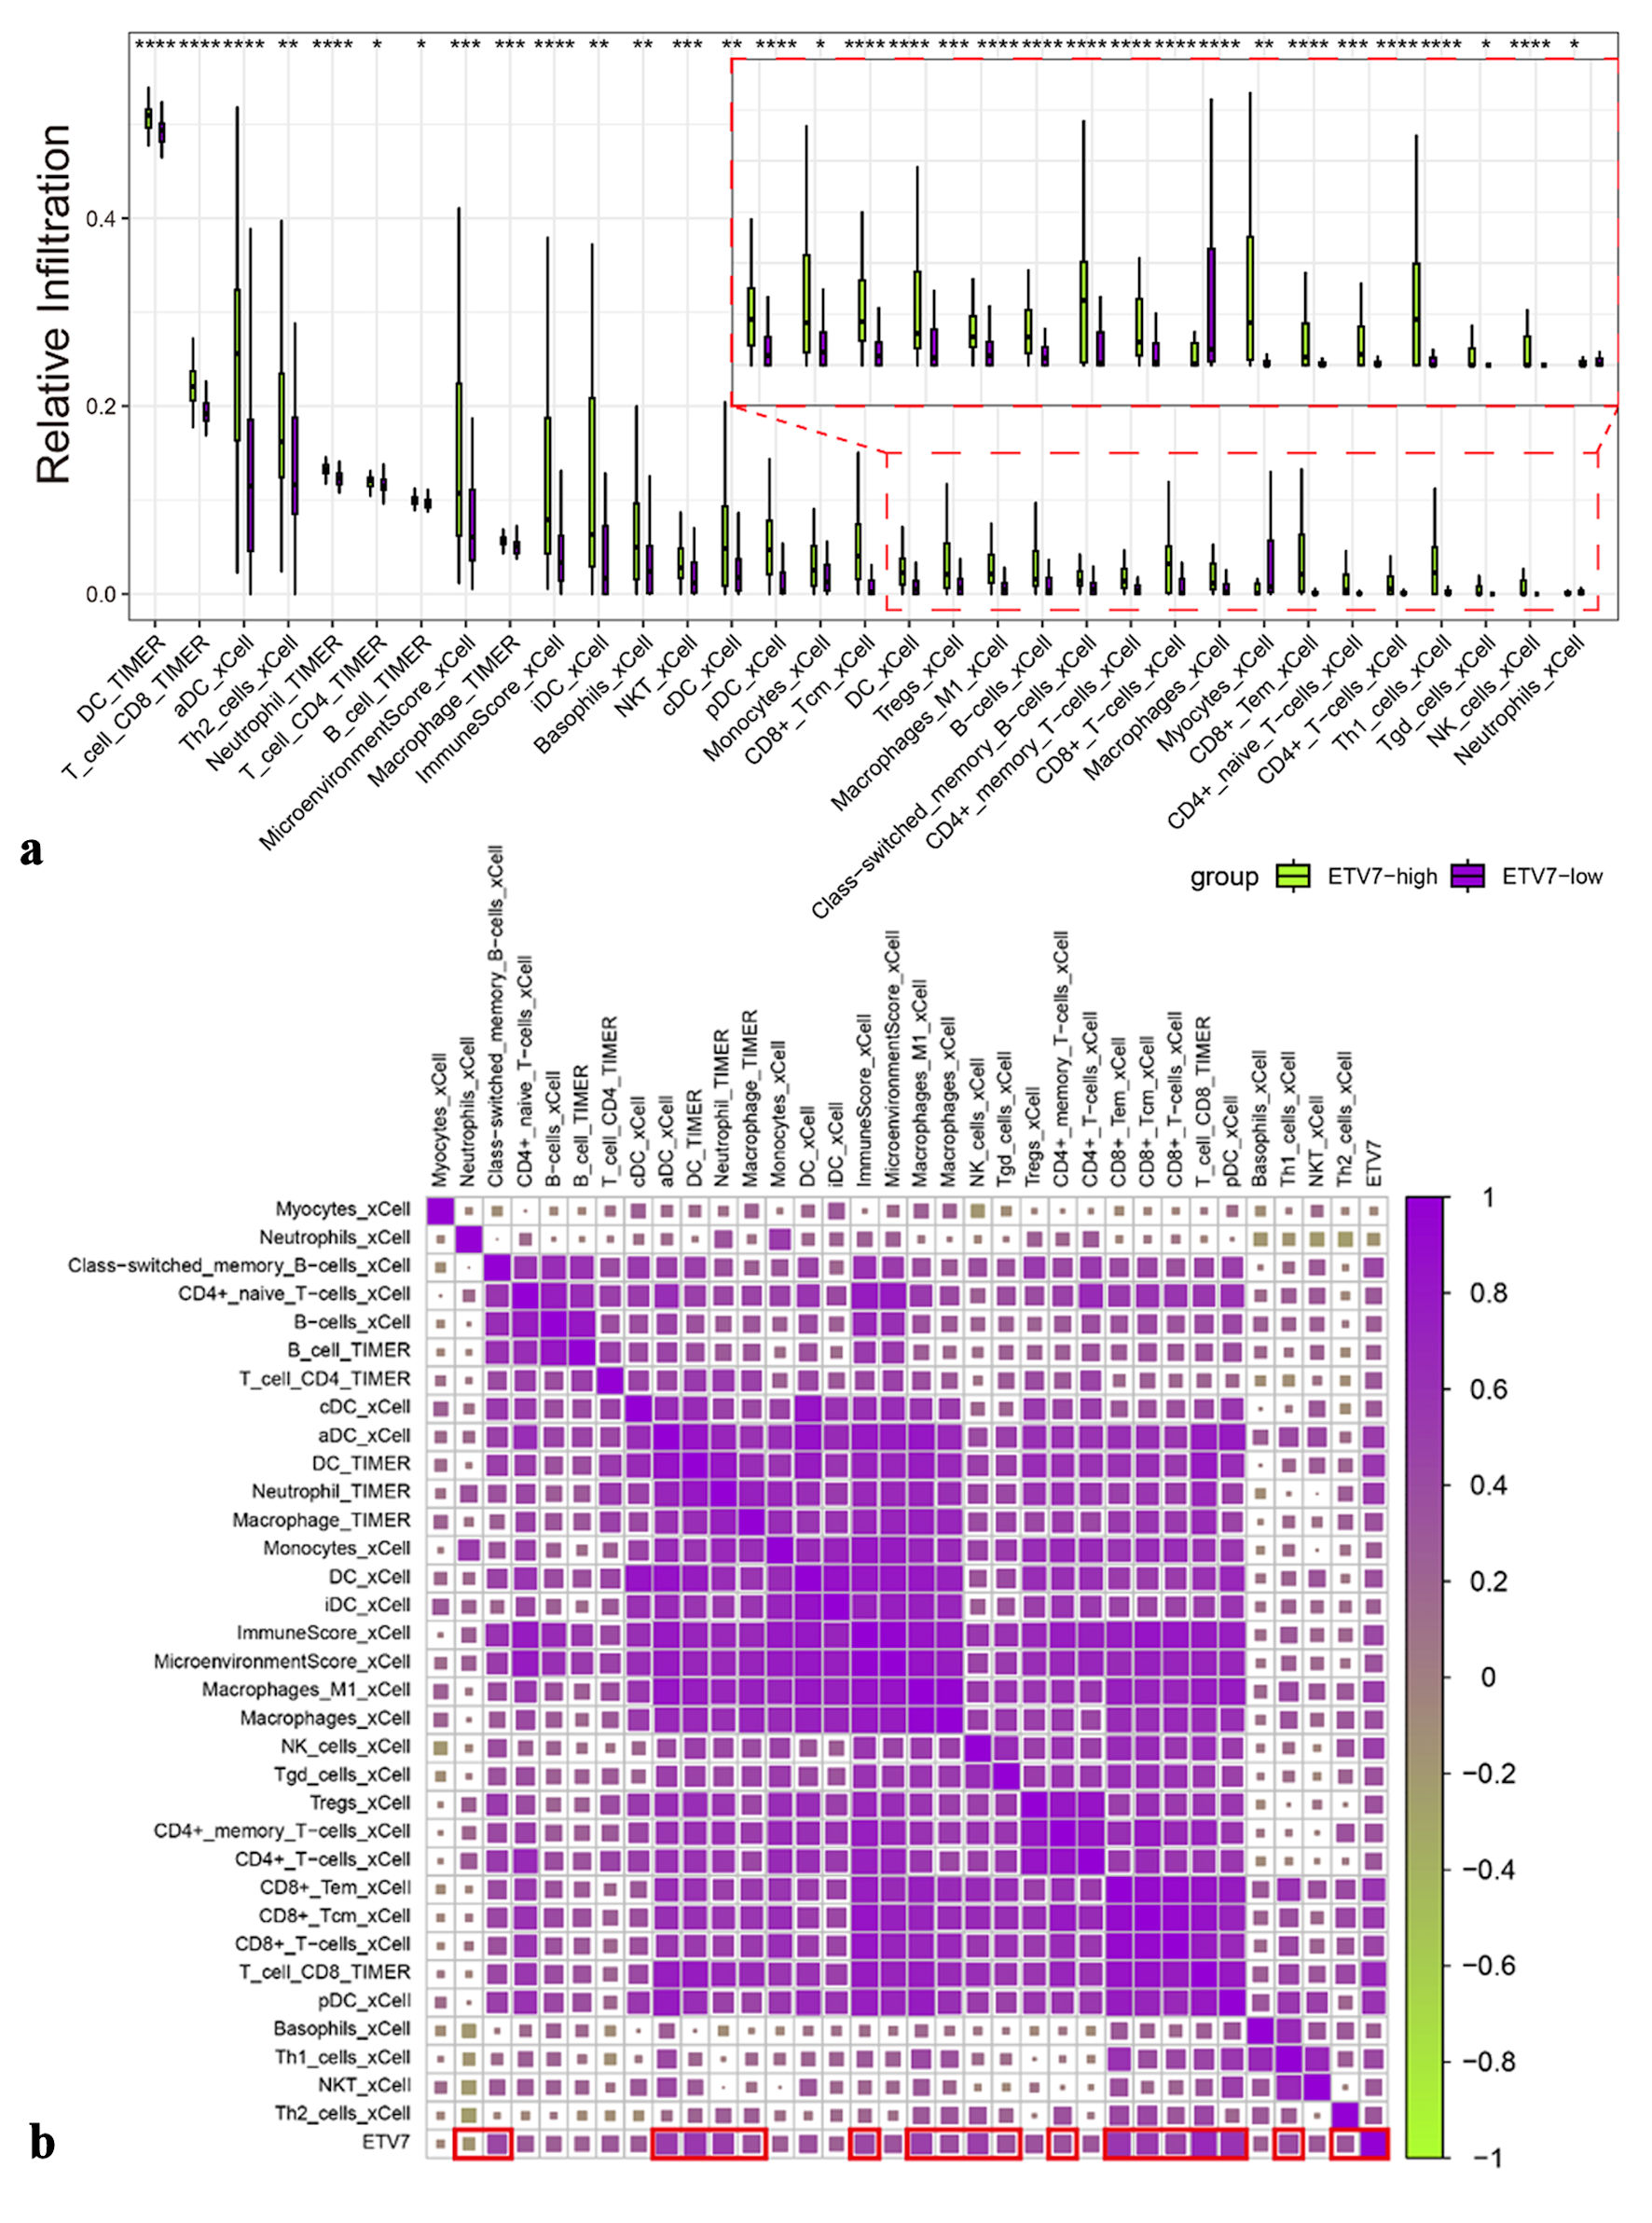
↓ Figure 5. The relationship between immune
infiltration and ETV7 expression. (a) Immune infiltration with different expressions of ETV7. (b)
Correlation between ETV7 and immune infiltration. ETV7: E26 transformation-specific variant
transcription factor 7.
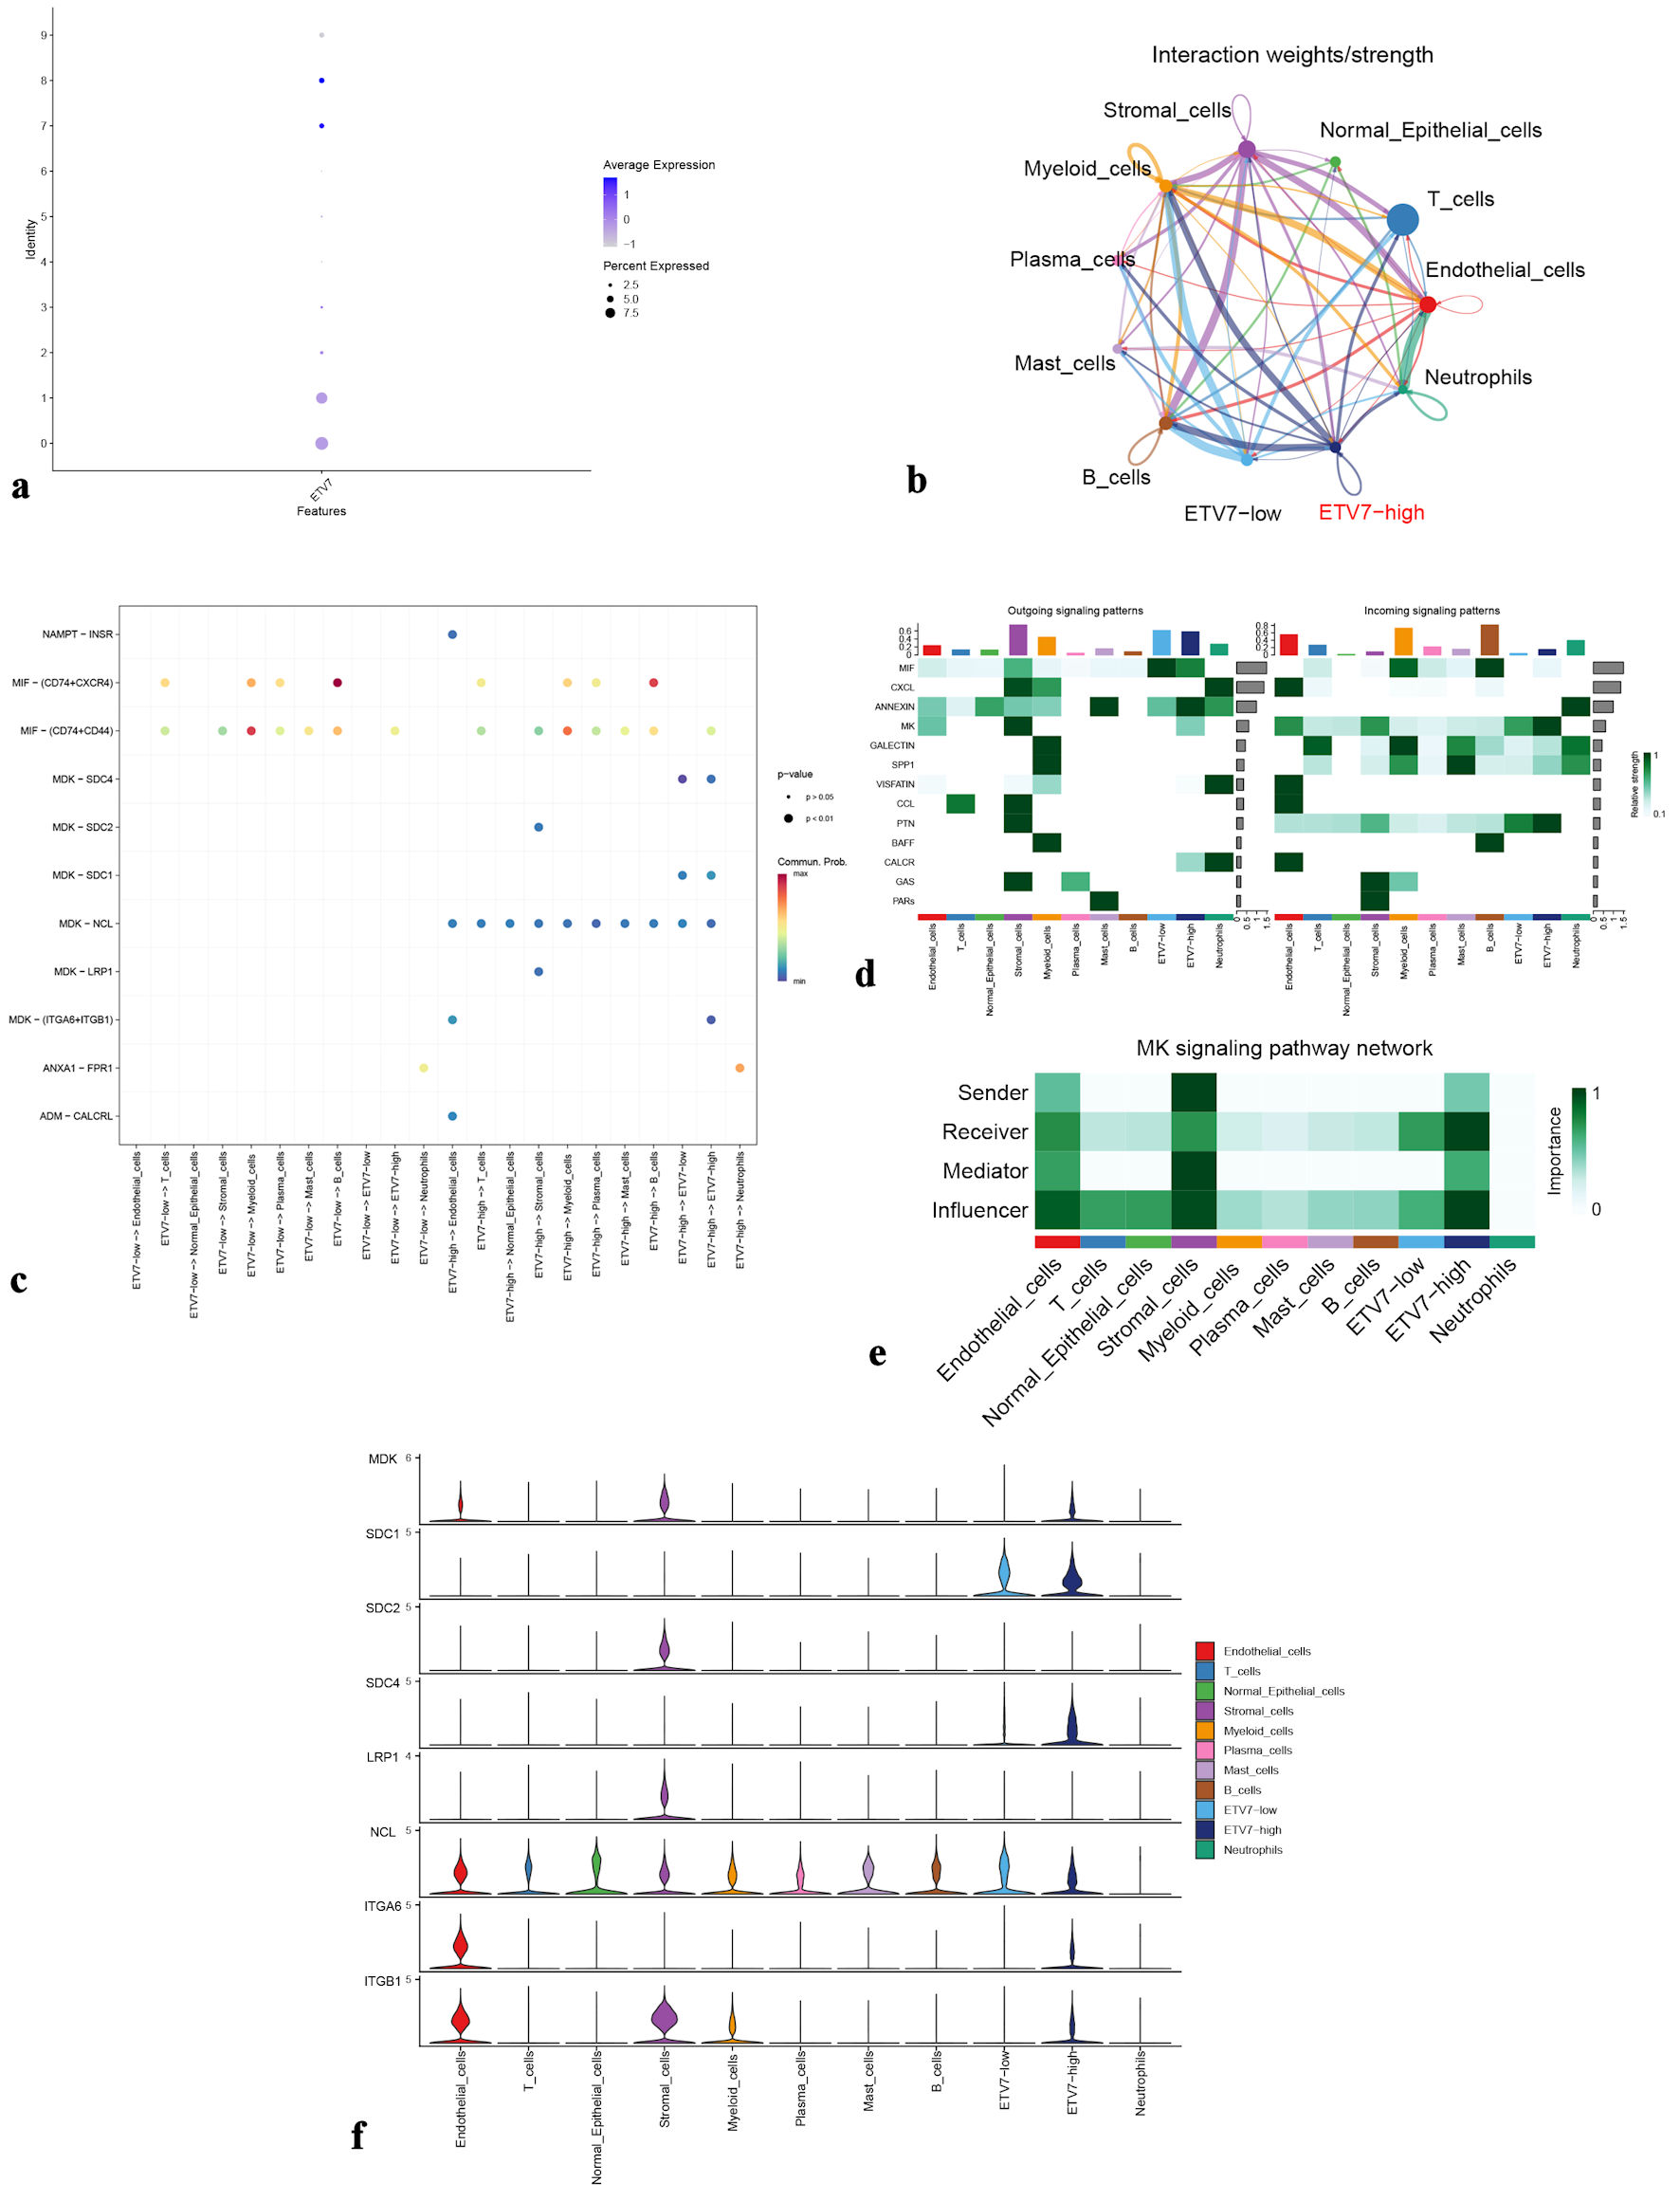
↓ Figure 6. (a) Dot plot showing ETV7 expression
in epithelial cell clusters from the OSCC group. (b) Cellular interaction network among different cell
types. (c) Ligand-receptor signaling patterns between ETV7 high-expression and low-expression groups.
(d) Heatmap of output and input signaling patterns. (e) Midkine (MK) signaling pathway network. (f)
Violin plots illustrate expression levels of MK pathway-associated genes. ETV7: E26
transformation-specific variant transcription factor 7; OSCC: oral squamous cell carcinoma.
Table
↓ Table 1. Information of Included High Throughput Data
|
Platform |
ID
|
OSCC
samples |
Non-OSCC samples |
| OSCC: oral squamous cell carcinoma. |
| GPL24676 |
GSE184616 |
15 |
15 |
|
GSE179730 |
11 |
0 |
| GPL21290 |
GSE186775 |
17 |
17 |
|
GSE140707 |
3 |
3 |
| GPL5175 |
GSE25099 |
57 |
22 |
|
GSE41116 |
43 |
0 |
| GPL6480 |
GSE23558 |
27 |
4 |
|
GSE46802 |
6 |
10 |
|
GSE84846 |
99 |
0 |
|
GSE85446 |
66 |
0 |
|
GSE85195 |
34 |
1 |
| GPL6353 |
GSE10121 |
35 |
6 |
| GPL10526 |
GSE31056 |
23 |
73 |
| GPL96 |
GSE3524 |
16 |
4 |
| GPL1426 |
GSE36090 |
10 |
3 |
| GPL2986 |
|
|
|
| GPL10739 |
GSE56532 |
10 |
6 |
| TCGA |
OSCC |
110 |
4 |
| E-MTAB |
8588 |
24 |
28 |