↓ Figure 1. Conceptual framework and patient flow
chart for research and model development.
| World Journal of Oncology, ISSN 1920-4531 print, 1920-454X online, Open Access |
| Article copyright, the authors; Journal compilation copyright, World J Oncol and Elmer Press Inc |
| Journal website https://wjon.elmerpub.com |
Original Article
Volume 16, Number 4, August 2025, pages 365-374
Development and Validation of KN-DIOC: A Novel Preoperative Diagnostic Index Using Ultrasound, Complete Blood Count, and Cancer Antigen 125 for Ovarian Cancer
Figures
Tables
| Histological type | Development dataset (n = 53) | Validation dataset (n = 17) |
|---|---|---|
| High-grade serous carcinoma | 19 | 4 |
| Mucinous adenocarcinoma/carcinoma | 8 | 1 |
| Clear cell carcinoma | 7 | 5 |
| Endometrioid adenocarcinoma | 8 | 5 |
| Undifferentiated adenocarcinoma | 7 | 0 |
| Mixed cell type | 3 | 1 |
| Mucinous borderline tumor | 1 | 1 |
| Predictors | Coefficient | OR | 95% CI | P-value* |
|---|---|---|---|---|
| *Significant at P < 0.05. CBC: complete blood count; CI: confident interval; OR: odds ratio. | ||||
| CBC | ||||
| Platelets counts | 0.009 | 1.009 | 1.005 - 1.013 | < 0.001 |
| Constant | -3.692 | 0.025 | - | < 0.001 |
| Ultrasound features | ||||
| Solid area | 1.868 | 6.475 | 2.488 - 16.851 | < 0.001 |
| Papillary projection | 2.395 | 10.974 | 4.117 - 29.250 | < 0.001 |
| Ascites | 1.490 | 4.439 | 1.362 - 14.474 | 0.013 |
| Constant | -2.757 | 0.063 | - | < 0.001 |
| Predictors | Coefficient | OR | 95% CI | P-value* |
|---|---|---|---|---|
| *Significant at P < 0.05. CA125: cancer antigen 125; CI: confident interval; KN-DIOC: KMUTT-NMU Diagnostic Index for Ovarian Cancer; OR: odds ratio. | ||||
| Postmenopausal | 0.874 | 2.396 | 0.795 - 7.219 | 0.121 |
| Platelets counts | 0.008 | 1.008 | 1.002 - 1.013 | 0.010 |
| Solid area | 1.484 | 4.410 | 1.449 - 13.423 | 0.009 |
| Papillary projection | 2.446 | 11.547 | 3.753 - 35.527 | < 0.001 |
| Multilocular cyst | 1.389 | 4.009 | 1.264 - 12.715 | 0.018 |
| CA125 | 0.002 | 1.002 | 1.001 - 1.004 | 0.007 |
| Constant | -6.527 | 0.001 | - | < 0.001 |
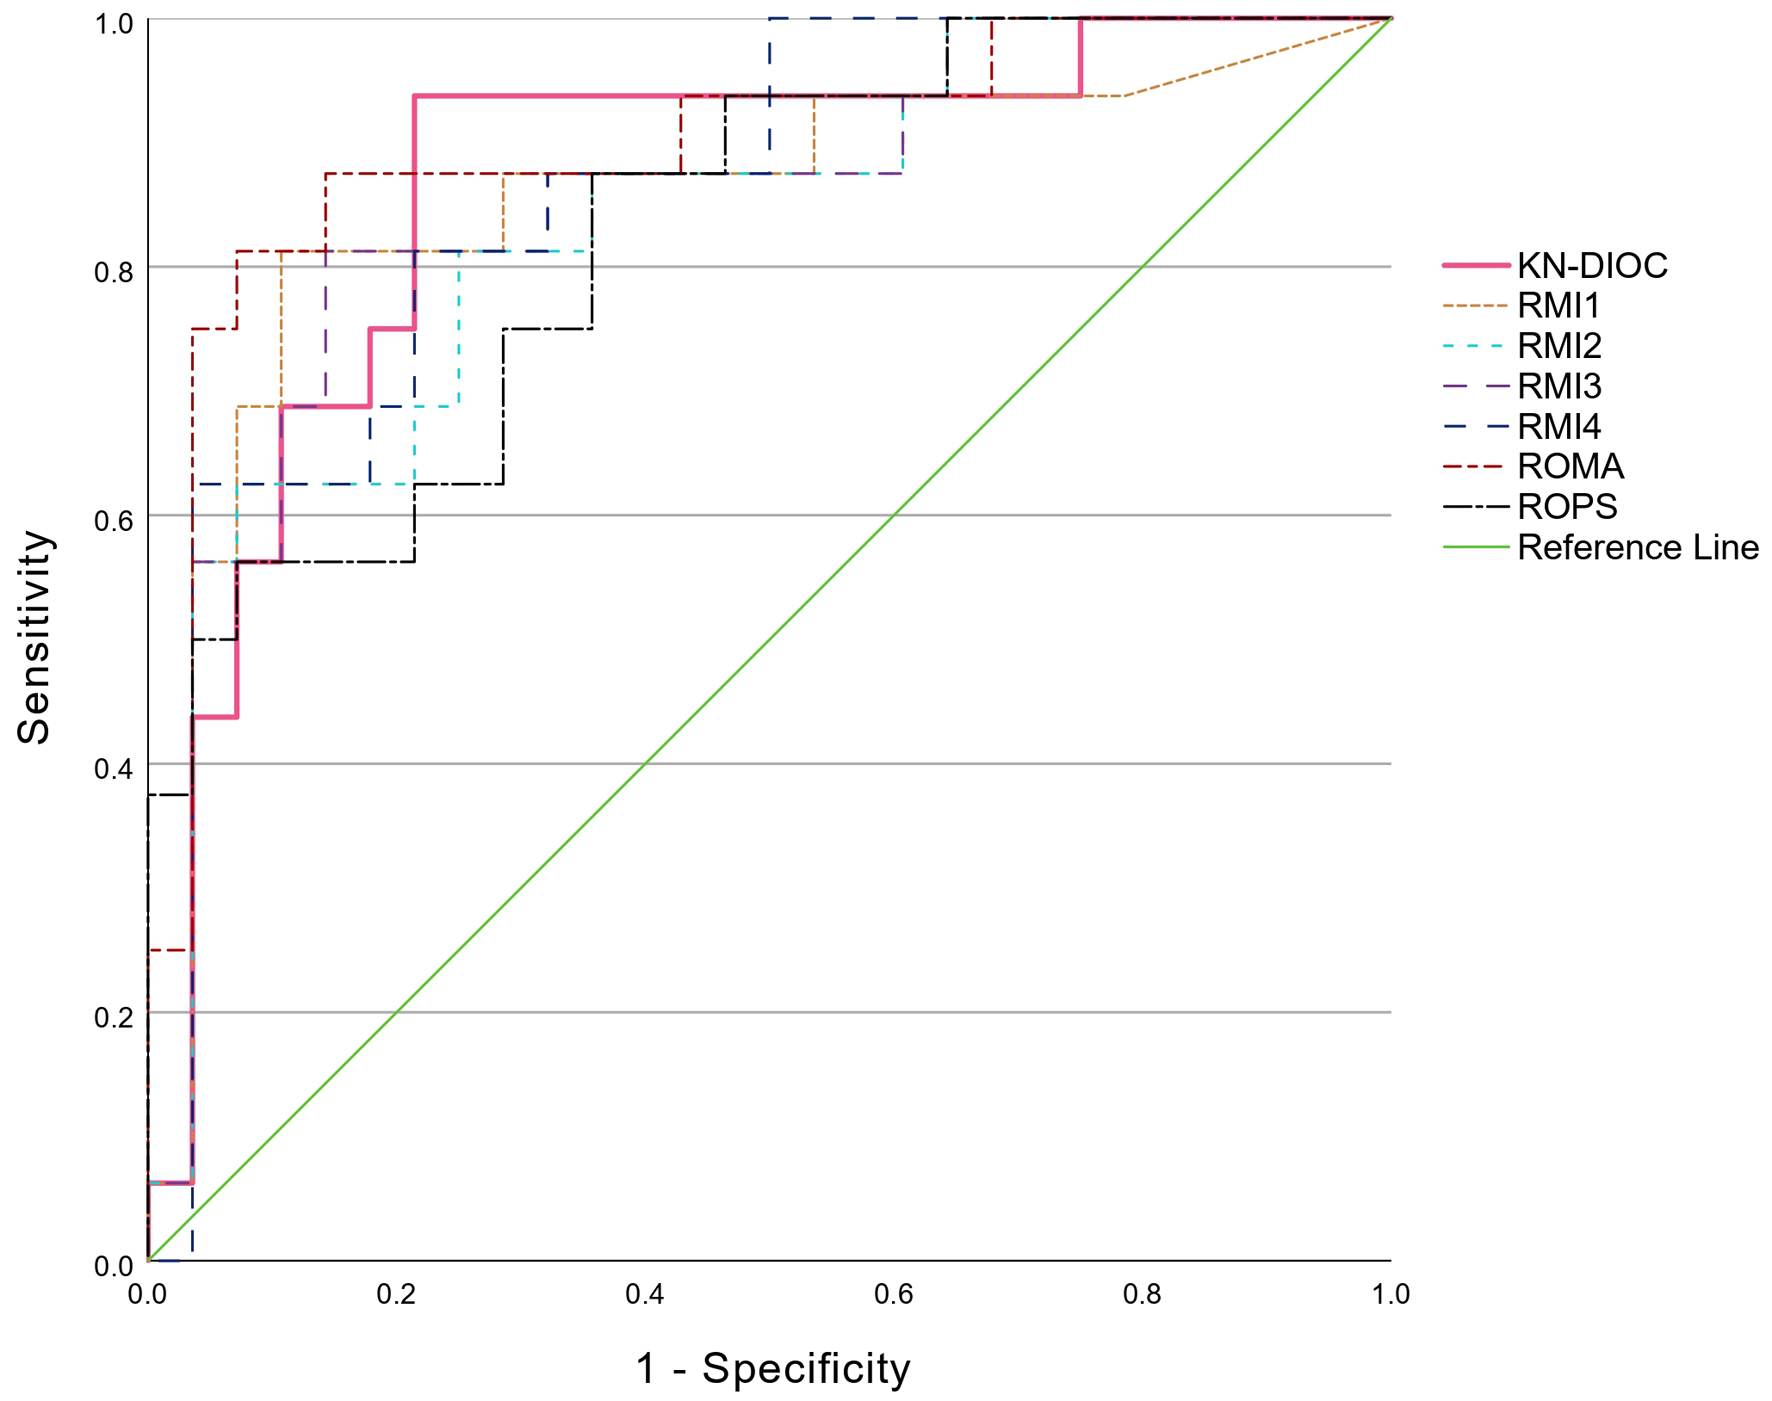
| Test result indices | Cutoff point | AUC | P-valuea | 95% CI | P-valueb | AUC difference |
|---|---|---|---|---|---|---|
| Significant at P < 0.05. aNull hypothesis: true area = 0.5. bNull hypothesis: true area difference = 0. cPremenopausal/postmenopausal cut-off points. AUC: area under the curve; CI: confident interval; KN-DIOC: KMUTT-NMU Diagnostic Index for Ovarian Cancer; OR: odds ratio; RMI: Risk of Malignancy Index; ROMA: Risk of Ovarian Malignancy Algorithm; R-OPS: Rajavithi-ovarian cancer predictive score. | ||||||
| KN-DIOC | 0.25 | 0.866 | < 0.001 | 0.750 - 0.982 | Ref. | Ref. |
| RMI I | 200 | 0.853 | < 0.001 | 0.720 - 0.986 | 0.857 | 0.013 |
| RMI II | 200 | 0.833 | < 0.001 | 0.706 - 0.959 | 0.614 | 0.033 |
| RMI III | 200 | 0.853 | < 0.001 | 0.731 - 0.974 | 0.846 | 0.013 |
| RMI IV | 450 | 0.857 | < 0.001 | 0.744 - 0.971 | 0.881 | 0.009 |
| ROMA | 11.4/29.9c | 0.900 | < 0.001 | 0.795 - 1.000 | 0.558 | -0.033 |
| R-OPS | 330 | 0.828 | < 0.001 | 0.705 - 0.951 | 0.452 | 0.038 |
| KN-DIOC | RMI I | RMI II | RMI III | RMI IV | ROMA | R-OPS | |
|---|---|---|---|---|---|---|---|
| Acc: accuracy; FN: false negatives; FP: false positives; KN-DIOC: KMUTT-NMU Diagnostic Index for Ovarian Cancer; LR+: positive likelihood ratio; LR-: negative likelihood ratio; NPV: negative predictive value; OR: odds ratio; PPV: positive predictive value; RMI: Risk of Malignancy Index; ROMA: Risk of Ovarian Malignancy Algorithm; R-OPS: Rajavithi-ovarian cancer predictive score; Sn: sensitivity; Sp: specificity; TN: true negatives; TP: true positives. | |||||||
| TP | 15 | 11 | 13 | 11 | 11 | 13 | 10 |
| FP | 6 | 2 | 9 | 3 | 6 | 4 | 7 |
| FN | 1 | 5 | 3 | 5 | 5 | 3 | 6 |
| TN | 22 | 26 | 19 | 25 | 22 | 24 | 21 |
| Sn (%) | 93.75 | 68.75 | 81.25 | 68.75 | 68.75 | 81.25 | 62.5 |
| Sp (%) | 78.57 | 92.86 | 67.86 | 89.29 | 78.57 | 85.71 | 75.0 |
| Acc (%) | 84.09 | 84.09 | 72.73 | 81.82 | 75.0 | 84.09 | 70.45 |
| PPV (%) | 71.43 | 84.62 | 59.09 | 78.57 | 64.71 | 76.47 | 58.82 |
| NPV (%) | 95.65 | 83.87 | 86.36 | 83.33 | 81.48 | 88.89 | 77.78 |
| LR+ | 4.375 | 9.625 | 2.528 | 6.417 | 3.208 | 5.688 | 2.5 |
| LR- | 0.080 | 0.337 | 0.276 | 0.35 | 0.398 | 0.219 | 0.5 |
| OR | 55 | 28.6 | 9.15 | 18.33 | 8.067 | 26 | 5 |