Figures
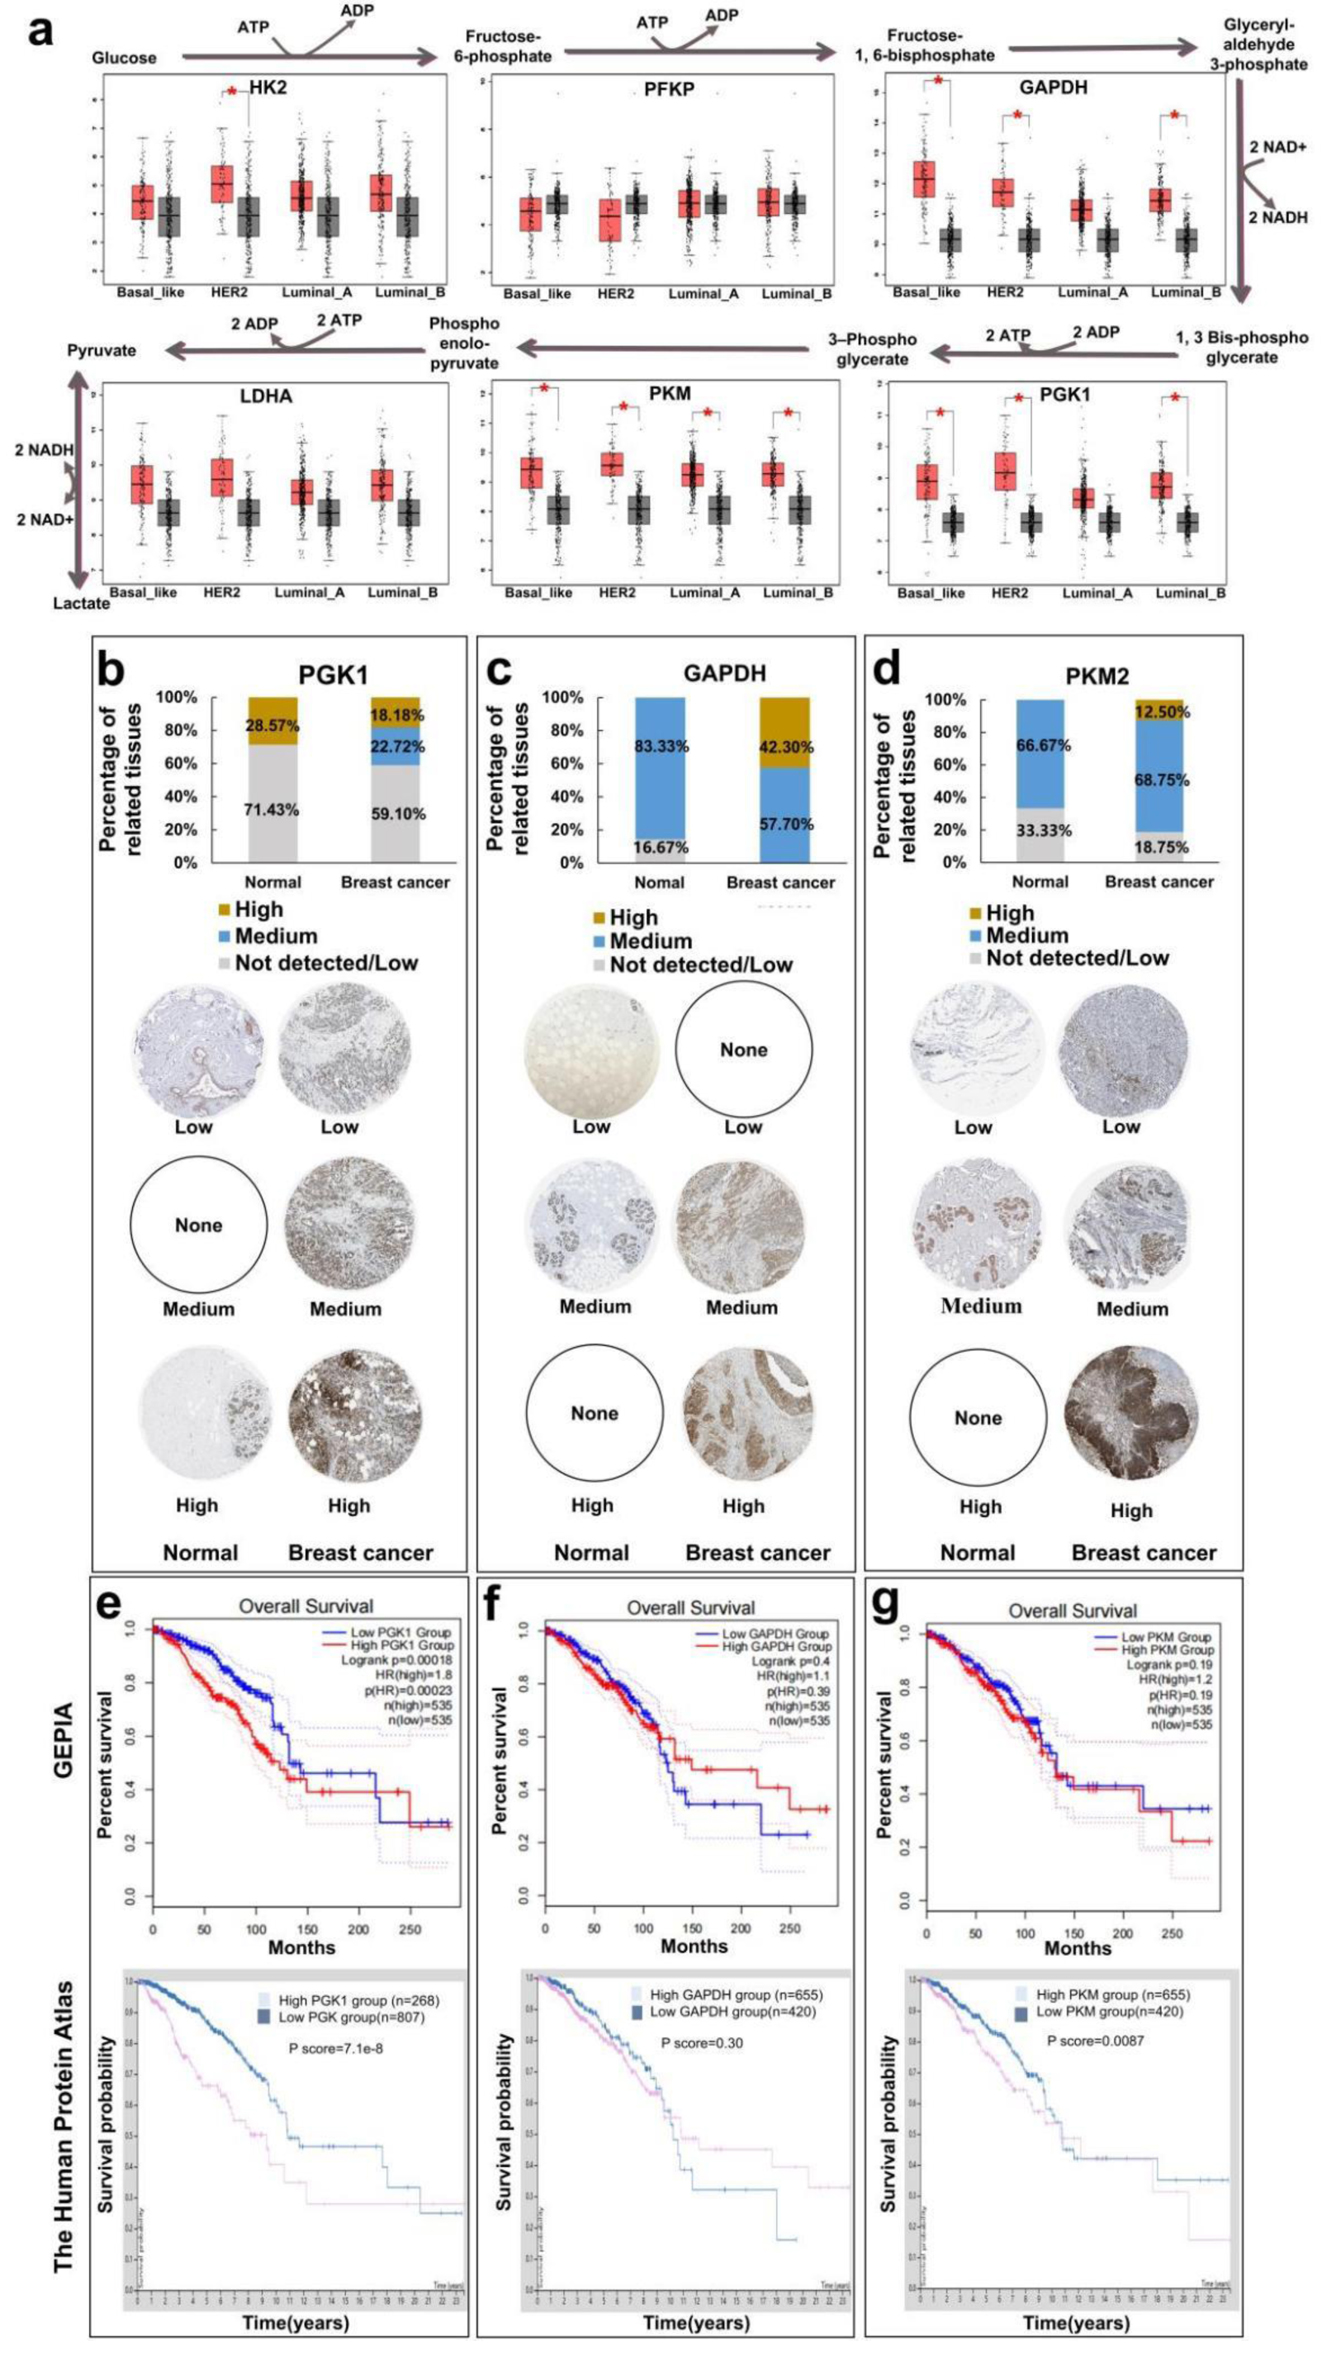
↓ Figure 1. Analysis of survival and prognosis of
glycolytic enzymes in different breast cancers by database. (a) Relationship between expression levels
of glycolytic metabolic enzyme (HK2, PFKP, GAPDH, LDHA, PKM, and PGK1) of breast cancer. (b) Human
Protein Atlas analyzes the immunohistochemical expression of PGK1 enzymes in breast cancer. (c)
Immunohistochemical expression of GAPDH enzymes in breast cancer. (d) Immunohistochemical expression of
PKM2 enzymes in breast cancer. (e) GEPIA and Human Protein Atlas analysis of relationship between
expression levels of glycolytic metabolic enzyme PGK1 and overall survival of breast cancer patients.
(f) Relationship between expression levels of glycolytic metabolic enzyme GAPDH and overall survival of
breast cancer patients. (g) Relationship between expression levels of glycolytic metabolic enzyme PKM2
and overall survival of breast cancer patients. GAPDH: glyceraldehyde-3-phosphate dehydrogenase; GEPIA:
The Gene Expression Profiling Interactive Analysis; HK2: hexokinase 2; LDHA: lactate dehydrogenase A;
PFKP: phosphofructokinase; PGK1: phosphoglycerate kinase 1; PKM: M-type pyruvate kinase.
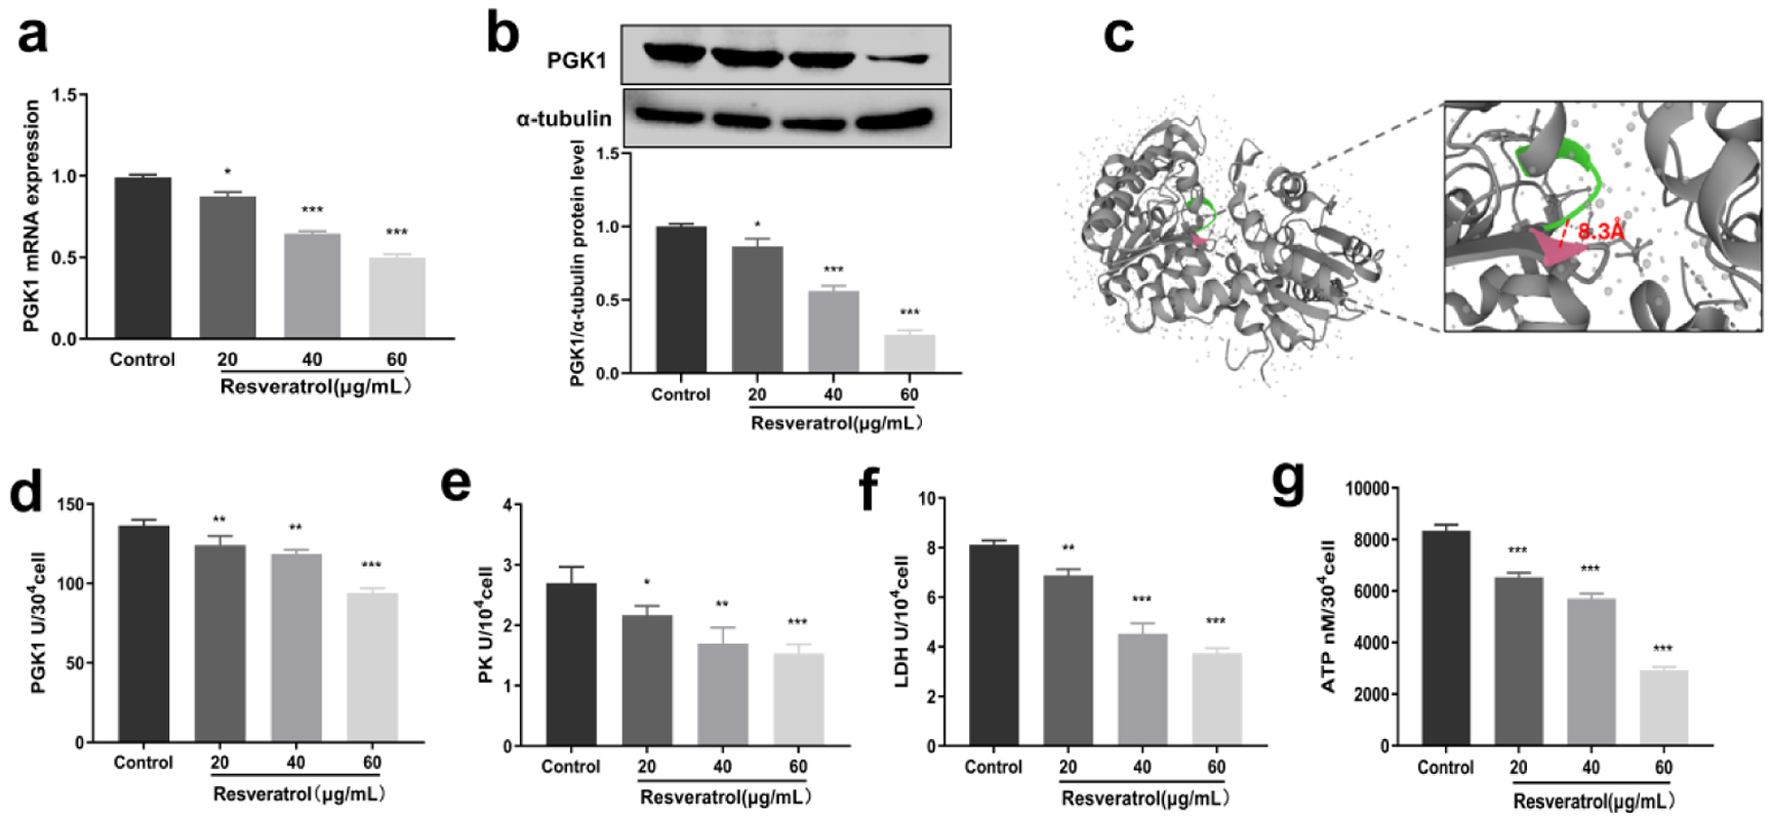
↓ Figure 2. Inhibitory effect of resveratrol on
PGK1 and glycolytic enzymes. (a) Inhibition of PGK1 mRNA expression by resveratrol. (b) Inhibition of
PGK1 protein expression by resveratrol, and α-tubulin was used as loading control. (c) Molecular
docking of resveratrol with PGK1. (d) Inhibitory effect of resveratrol on PGK1 enzyme activity. (e)
Inhibitory effect of resveratrol on PK enzyme activity. (f) Inhibitory effect of resveratrol on LDH
enzyme activity. (g) Inhibitory effect of resveratrol on ATP content. LDH: lactate dehydrogenase; PGK1:
phosphoglycerate kinase 1; PK: pyruvate kinase.
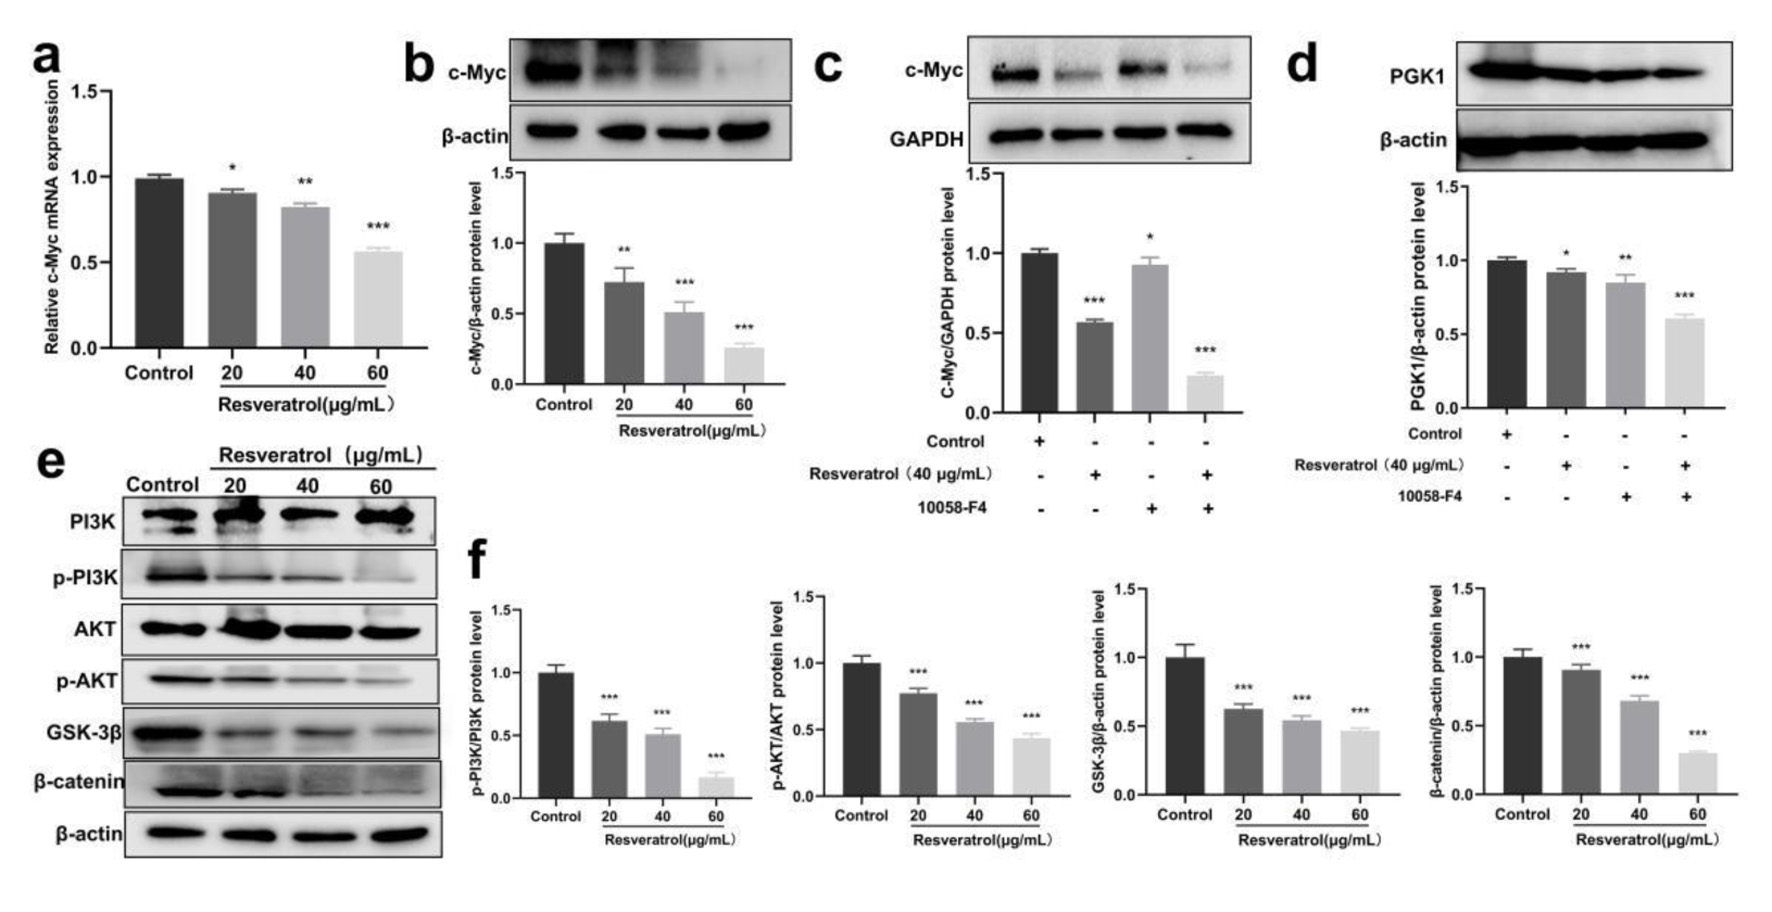
↓ Figure 3. Resveratrol inhibits PGK1-related
c-Myc/PI3K/AKT axis. (a) Resveratrol (20, 40, and 60 µg/mL) on the expression of c-Myc mRNA in
BT-549 cells. (b) Resveratrol (20, 40, and 60 µg/mL) on the expression of c-Myc protein in BT-549
cells. (c) c-Myc protein expression induced by resveratrol (40 µg/mL) and 10058-F4 (90 µM)
alone and in combination. (d) PGK1 protein expression induced by resveratrol (40 µg/mL) and
10058-F4 (90 µM) alone and in combination. (e) Western blot detection for phosphorylation-related
proteins in the PI3K/AKT/GSK-3β/β-catenin pathway. (f) Quantification of Figure 3e. *P <
0.05, **P < 0.01, ***P < 0.001. PGK1: phosphoglycerate kinase 1; PI3K: phosphatidylinositol
3-kinase.
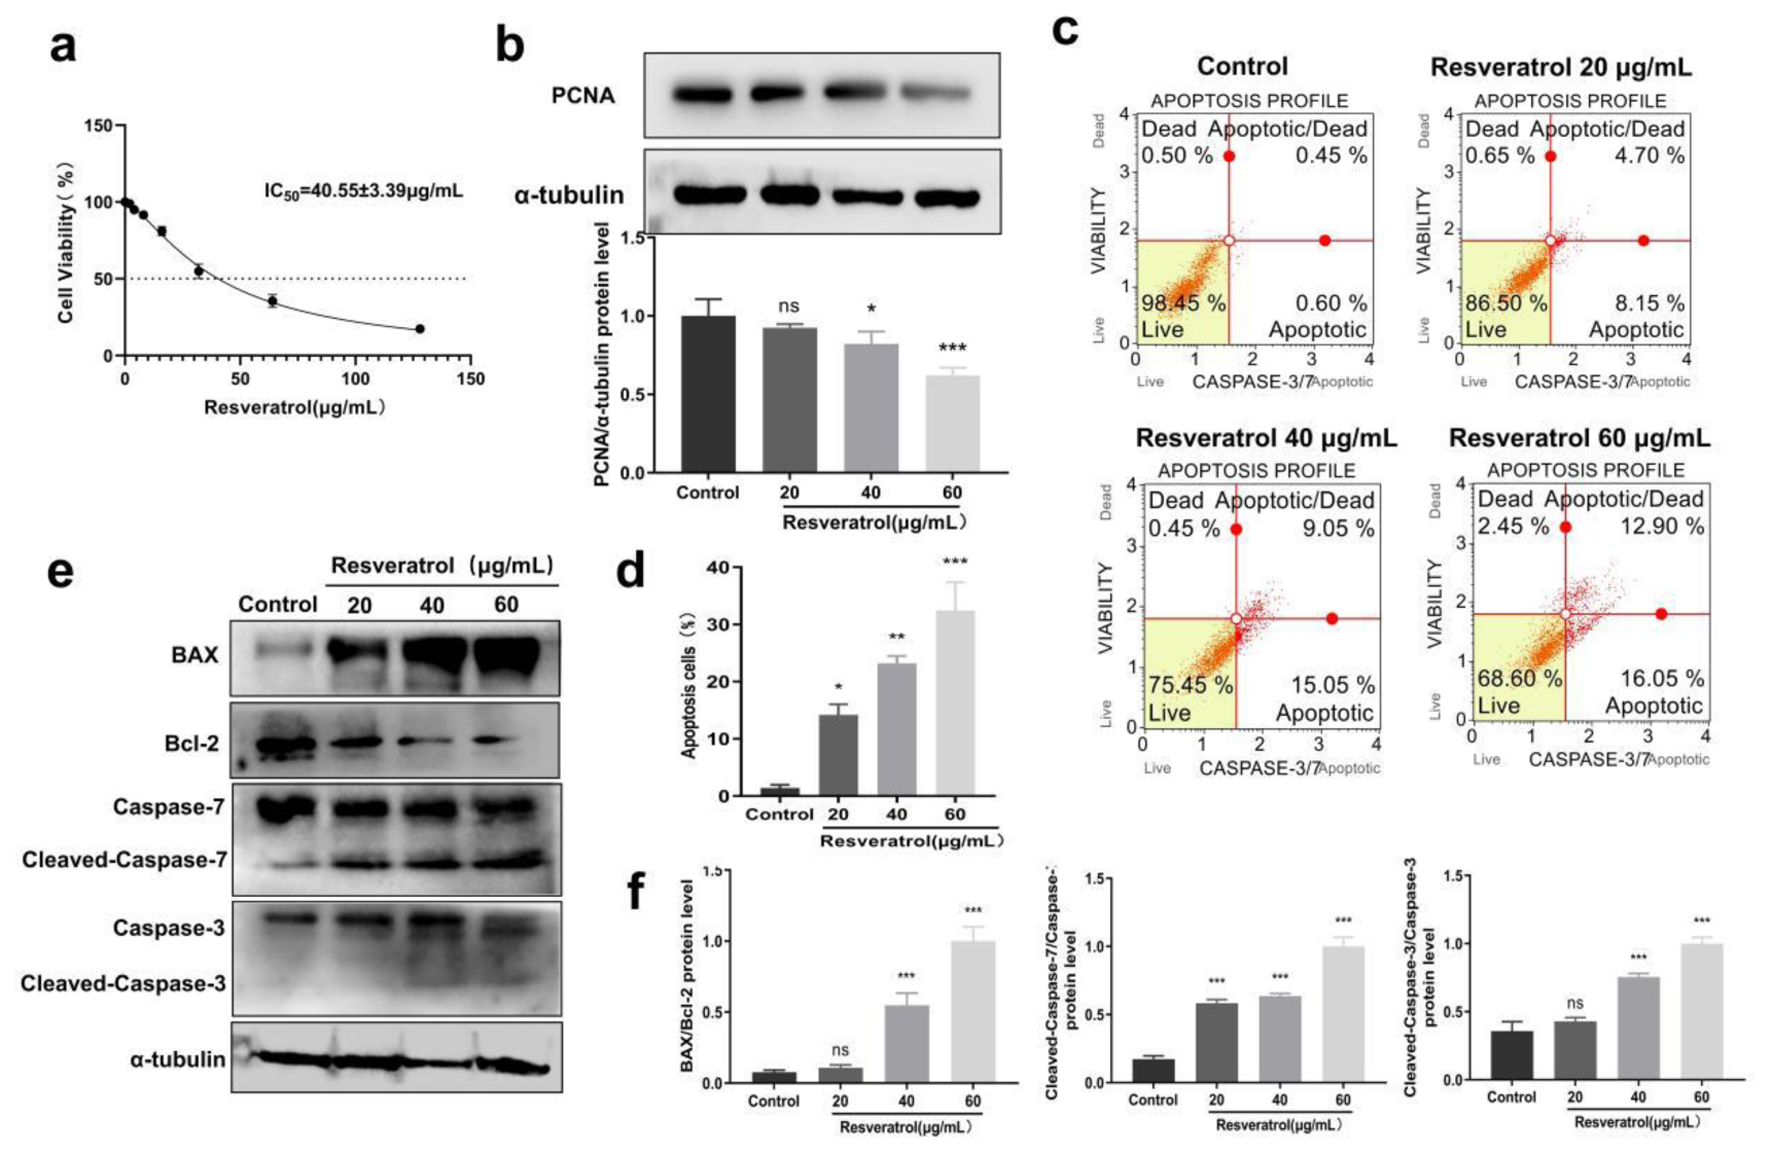
↓ Figure 4. Resveratrol inhibits cell
proliferation and induces apoptosis in breast cancer. (a) Inhibitory effects of resveratrol on BT-549
cells detected by MTT methods, and IC50 values were calculated through Graphpad Prism. (b)
Resveratrol (20, 40, and 60 µg/mL) on PCNA protein expression in BT-549 cells. (c) Resveratrol (20,
40, and 60 µg/mL) on apoptosis rate of BT-549 cells. (d) Quantification of Figure 4c. (e)
Resveratrol (20, 40, and 60 µg/mL) on the protein expression of BAX, Bcl-2, caspase-3/7 in BT-549
cells, and α-tubulin was used as loading control. (f) Quantification of Figure 4e. *P < 0.05,
**P < 0.01, ***P < 0.001. PCNA: proliferating cell nuclear antigen.
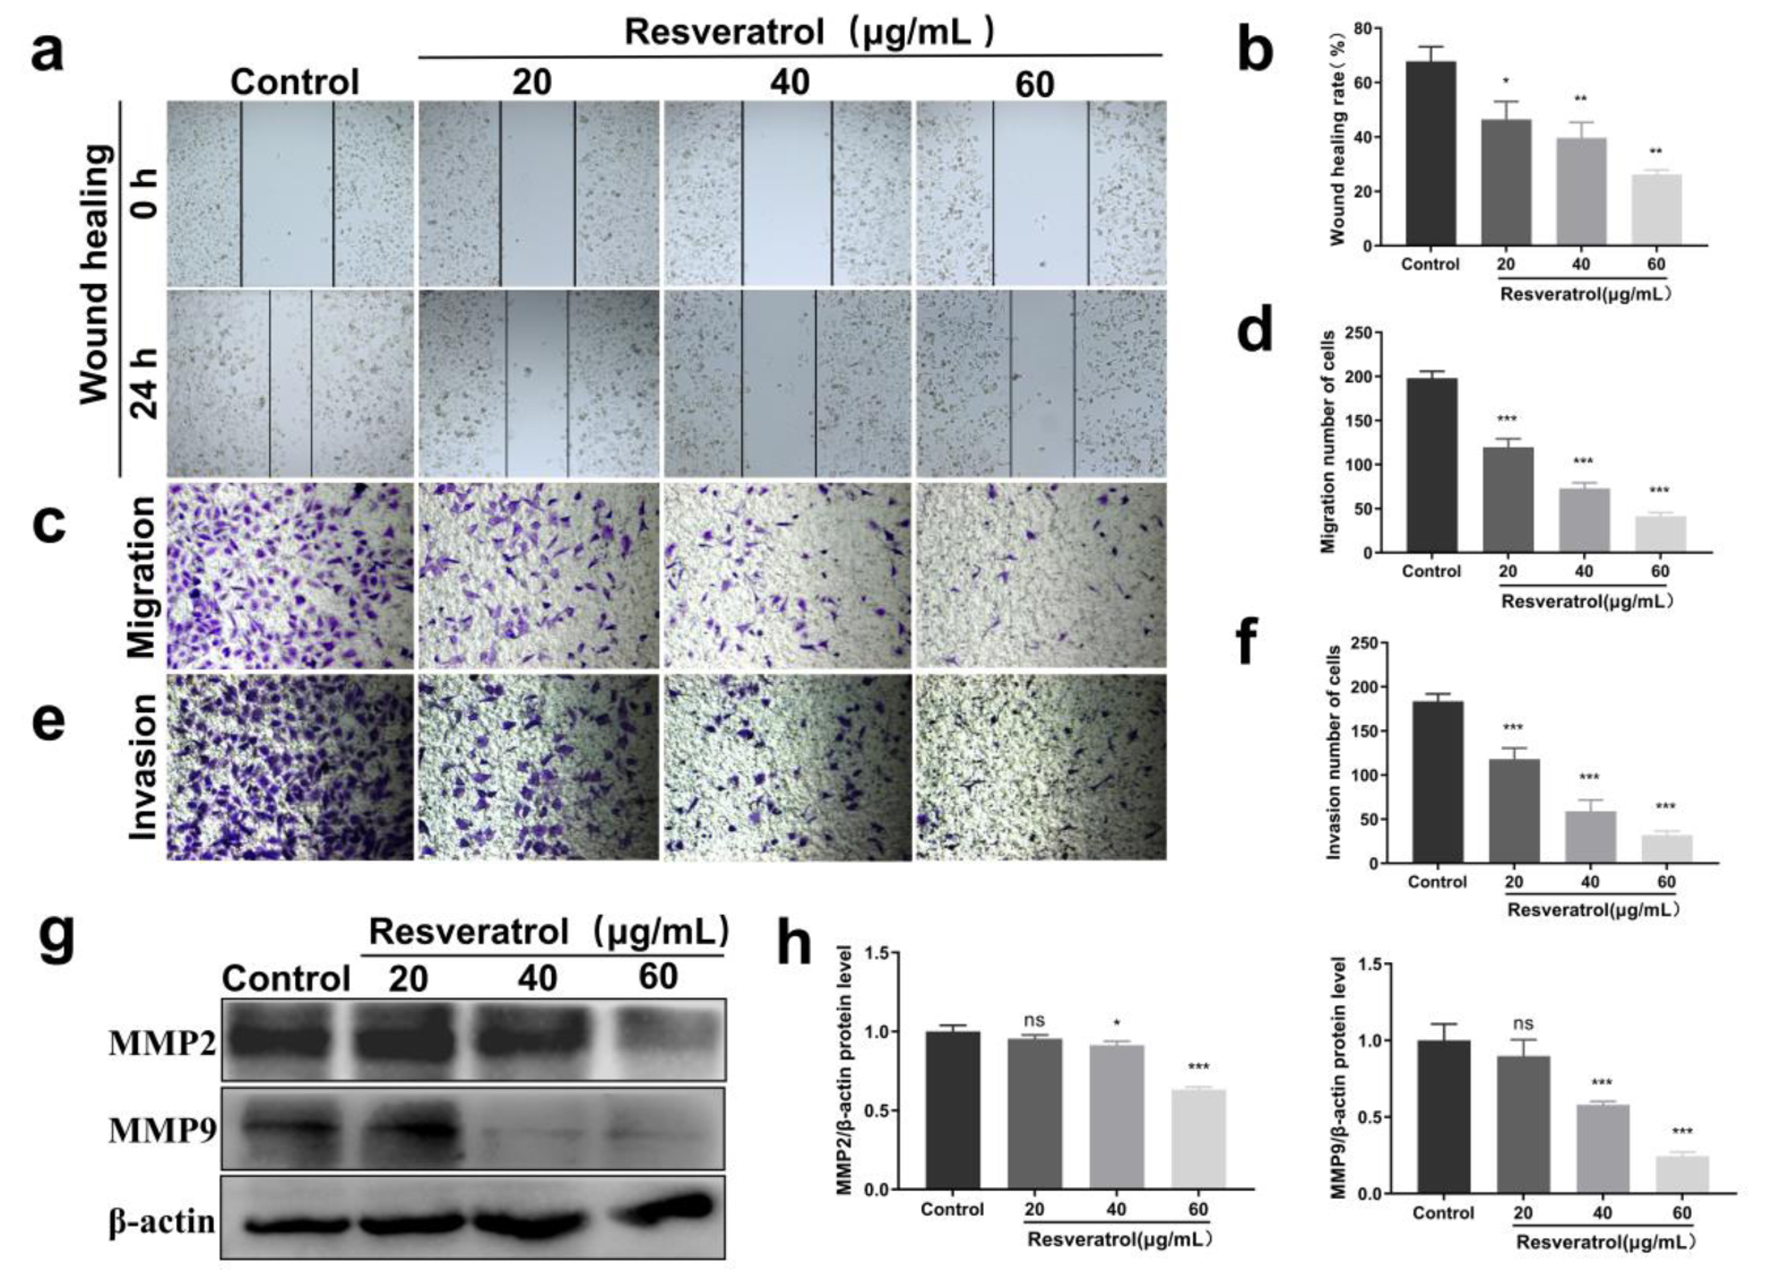
↓ Figure 5. Effects of resveratrol on migration
and invasion of BT-549 cells. (a) Scratch assay to detect the effect of resveratrol (20, 40, and 60
µg/mL) on the wound scratching ability of BT-549 cells. (b) Quantification of Figure 5a. (c)
Transwell assay to detect the effect of resveratrol (20, 40, and 60 µg/mL) on the migration ability
of BT-549 cells. (d) Quantitative results of Figure 5c. (e) Transwell assay to detect the effect of
resveratrol (20, 40, and 60 µg/mL) on the invasive metastatic ability of BT-549 cells. (f)
Quantitative results of Figure 5e. (g) Resveratrol (20, 40, and 60 µg/mL) on the expression of MMP2
and MMP9 proteins in BT-549 cells, and β-actin was used as loading control. (h) Quantitative
results of Figure 5g. *P < 0.05, **P < 0.01, ***P < 0.001. MMP: matrix metalloproteinase.
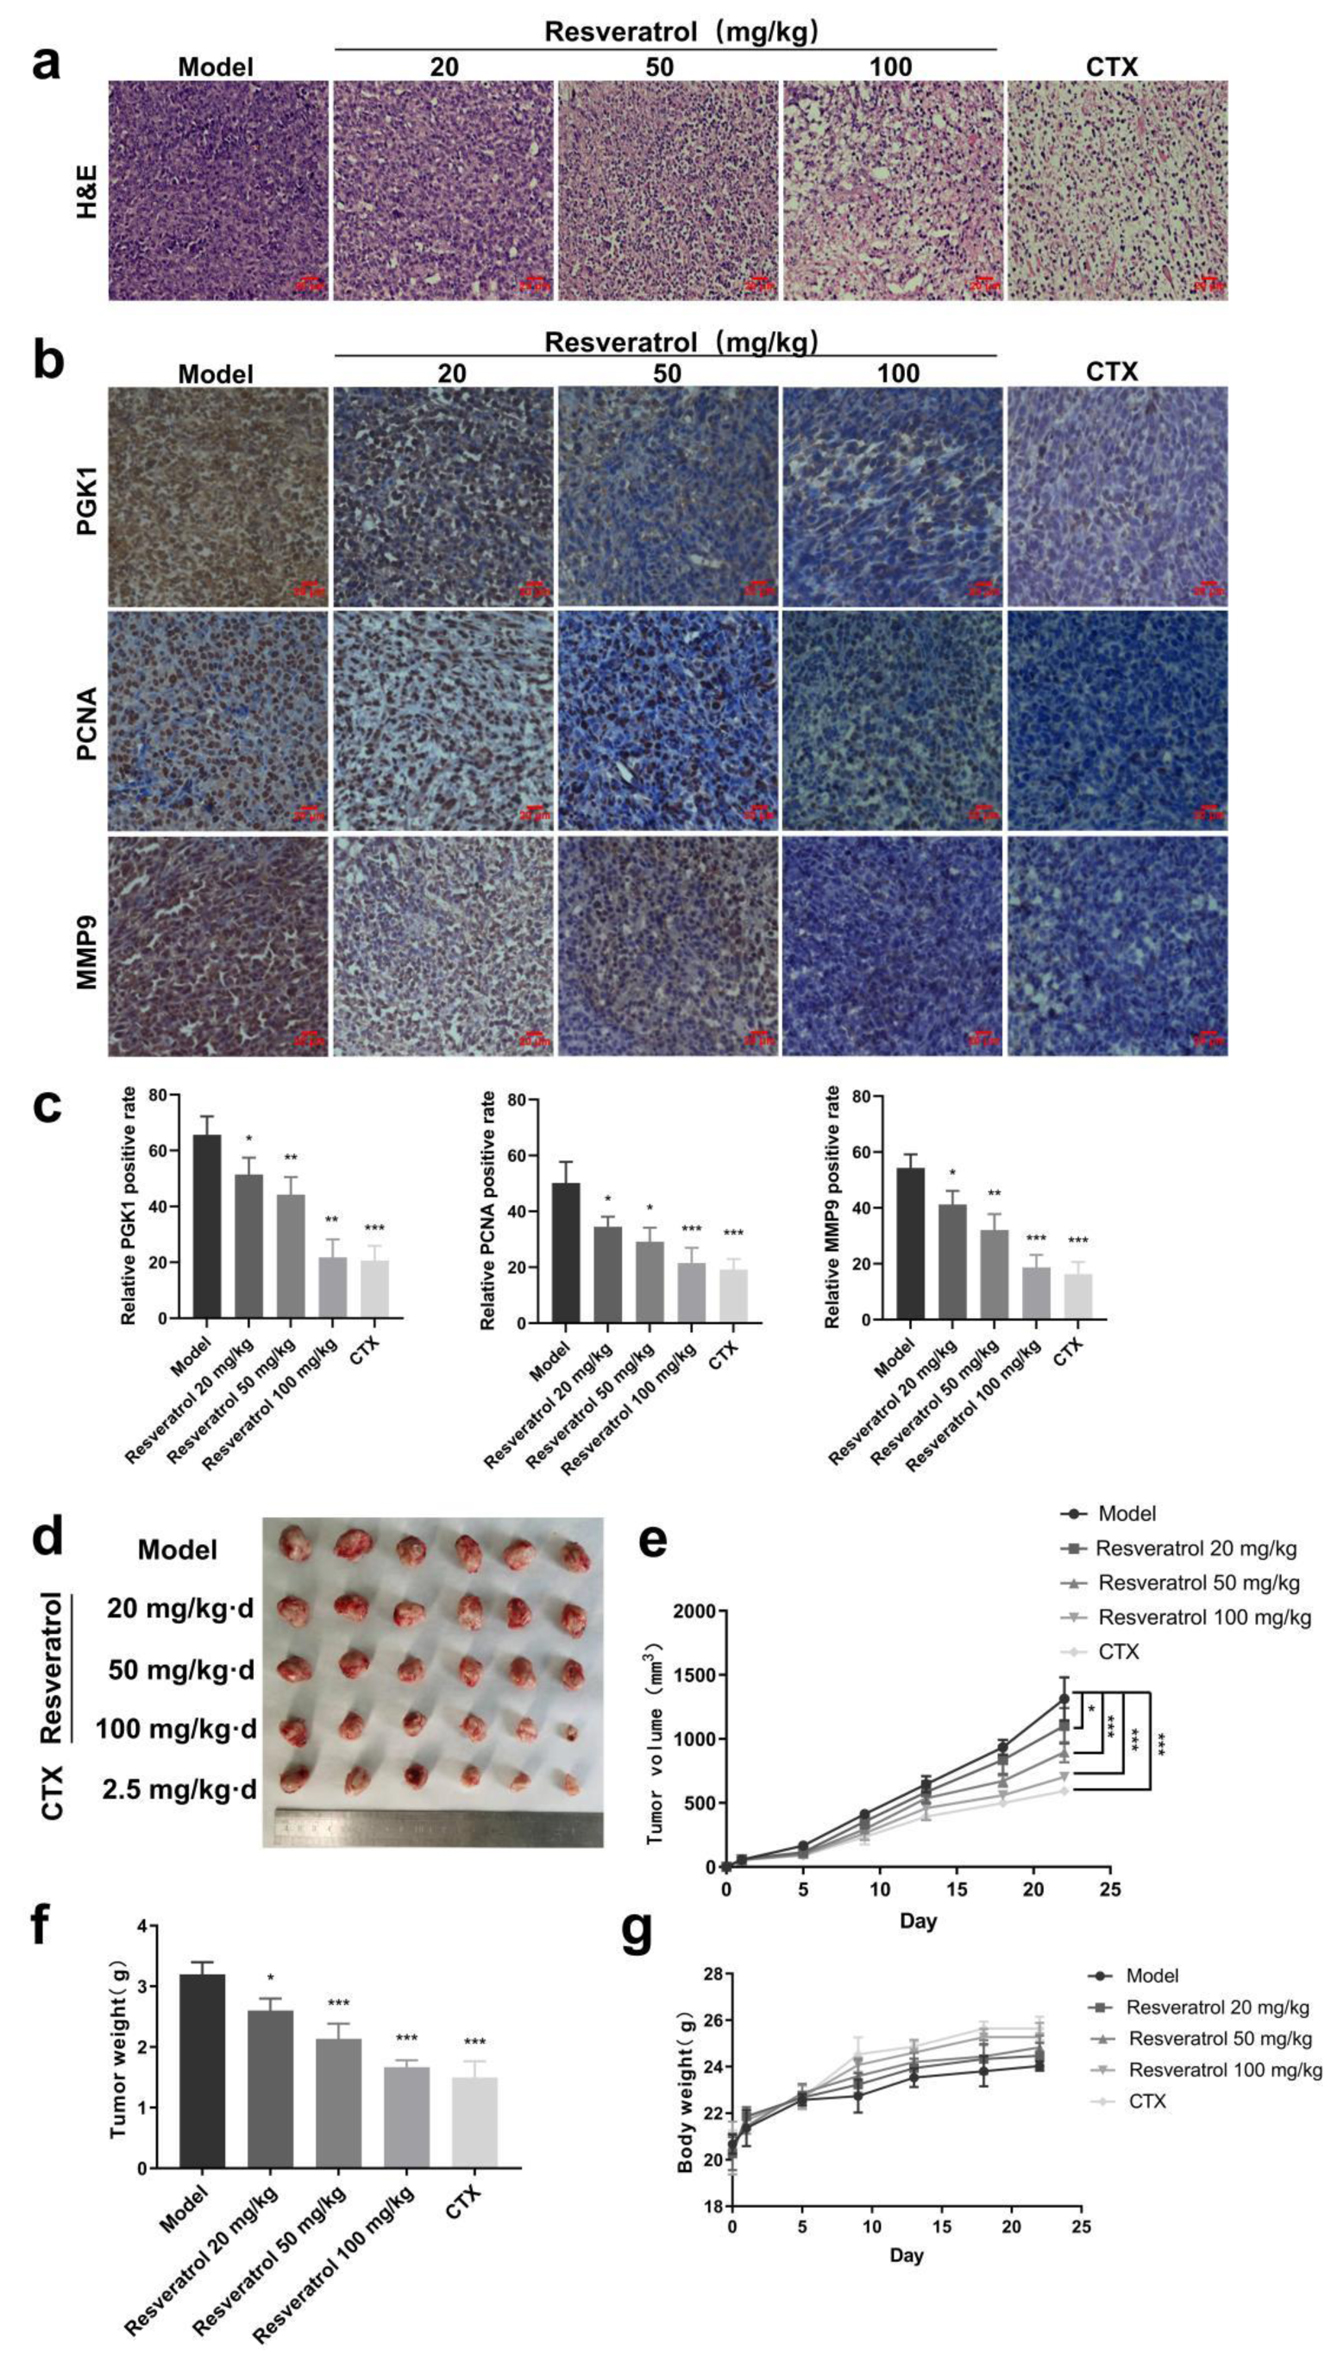
↓ Figure 6. Anti-tumor effect of resveratrol
in vivo. (a) Pathological examination of tumor tissue in vivo detected by H&E
staining. (b) IHC staining to detect the differences in the expression of relevant proteins in tumor
tissues. (c) Quantitative results of Figure 6b. (d) Effect of resveratrol (20, 50, and 100 mg/kg) and
CTX on the tumor volumes of loaded mise. (e) Quantitative results of Figure 6d. (f) Effect of
resveratrol (20, 50, and 100 mg/kg) and CTX on tumor weight in hormonal mice. (g) Effects of resveratrol
(20, 50, and 100 mg/kg) and CTX on the body weights of the mise. *P < 0.05, **P < 0.01, ***P <
0.001. CTX: cyclophosphamide; H&E: hematoxylin and eosin; IHC: immunohistochemistry.