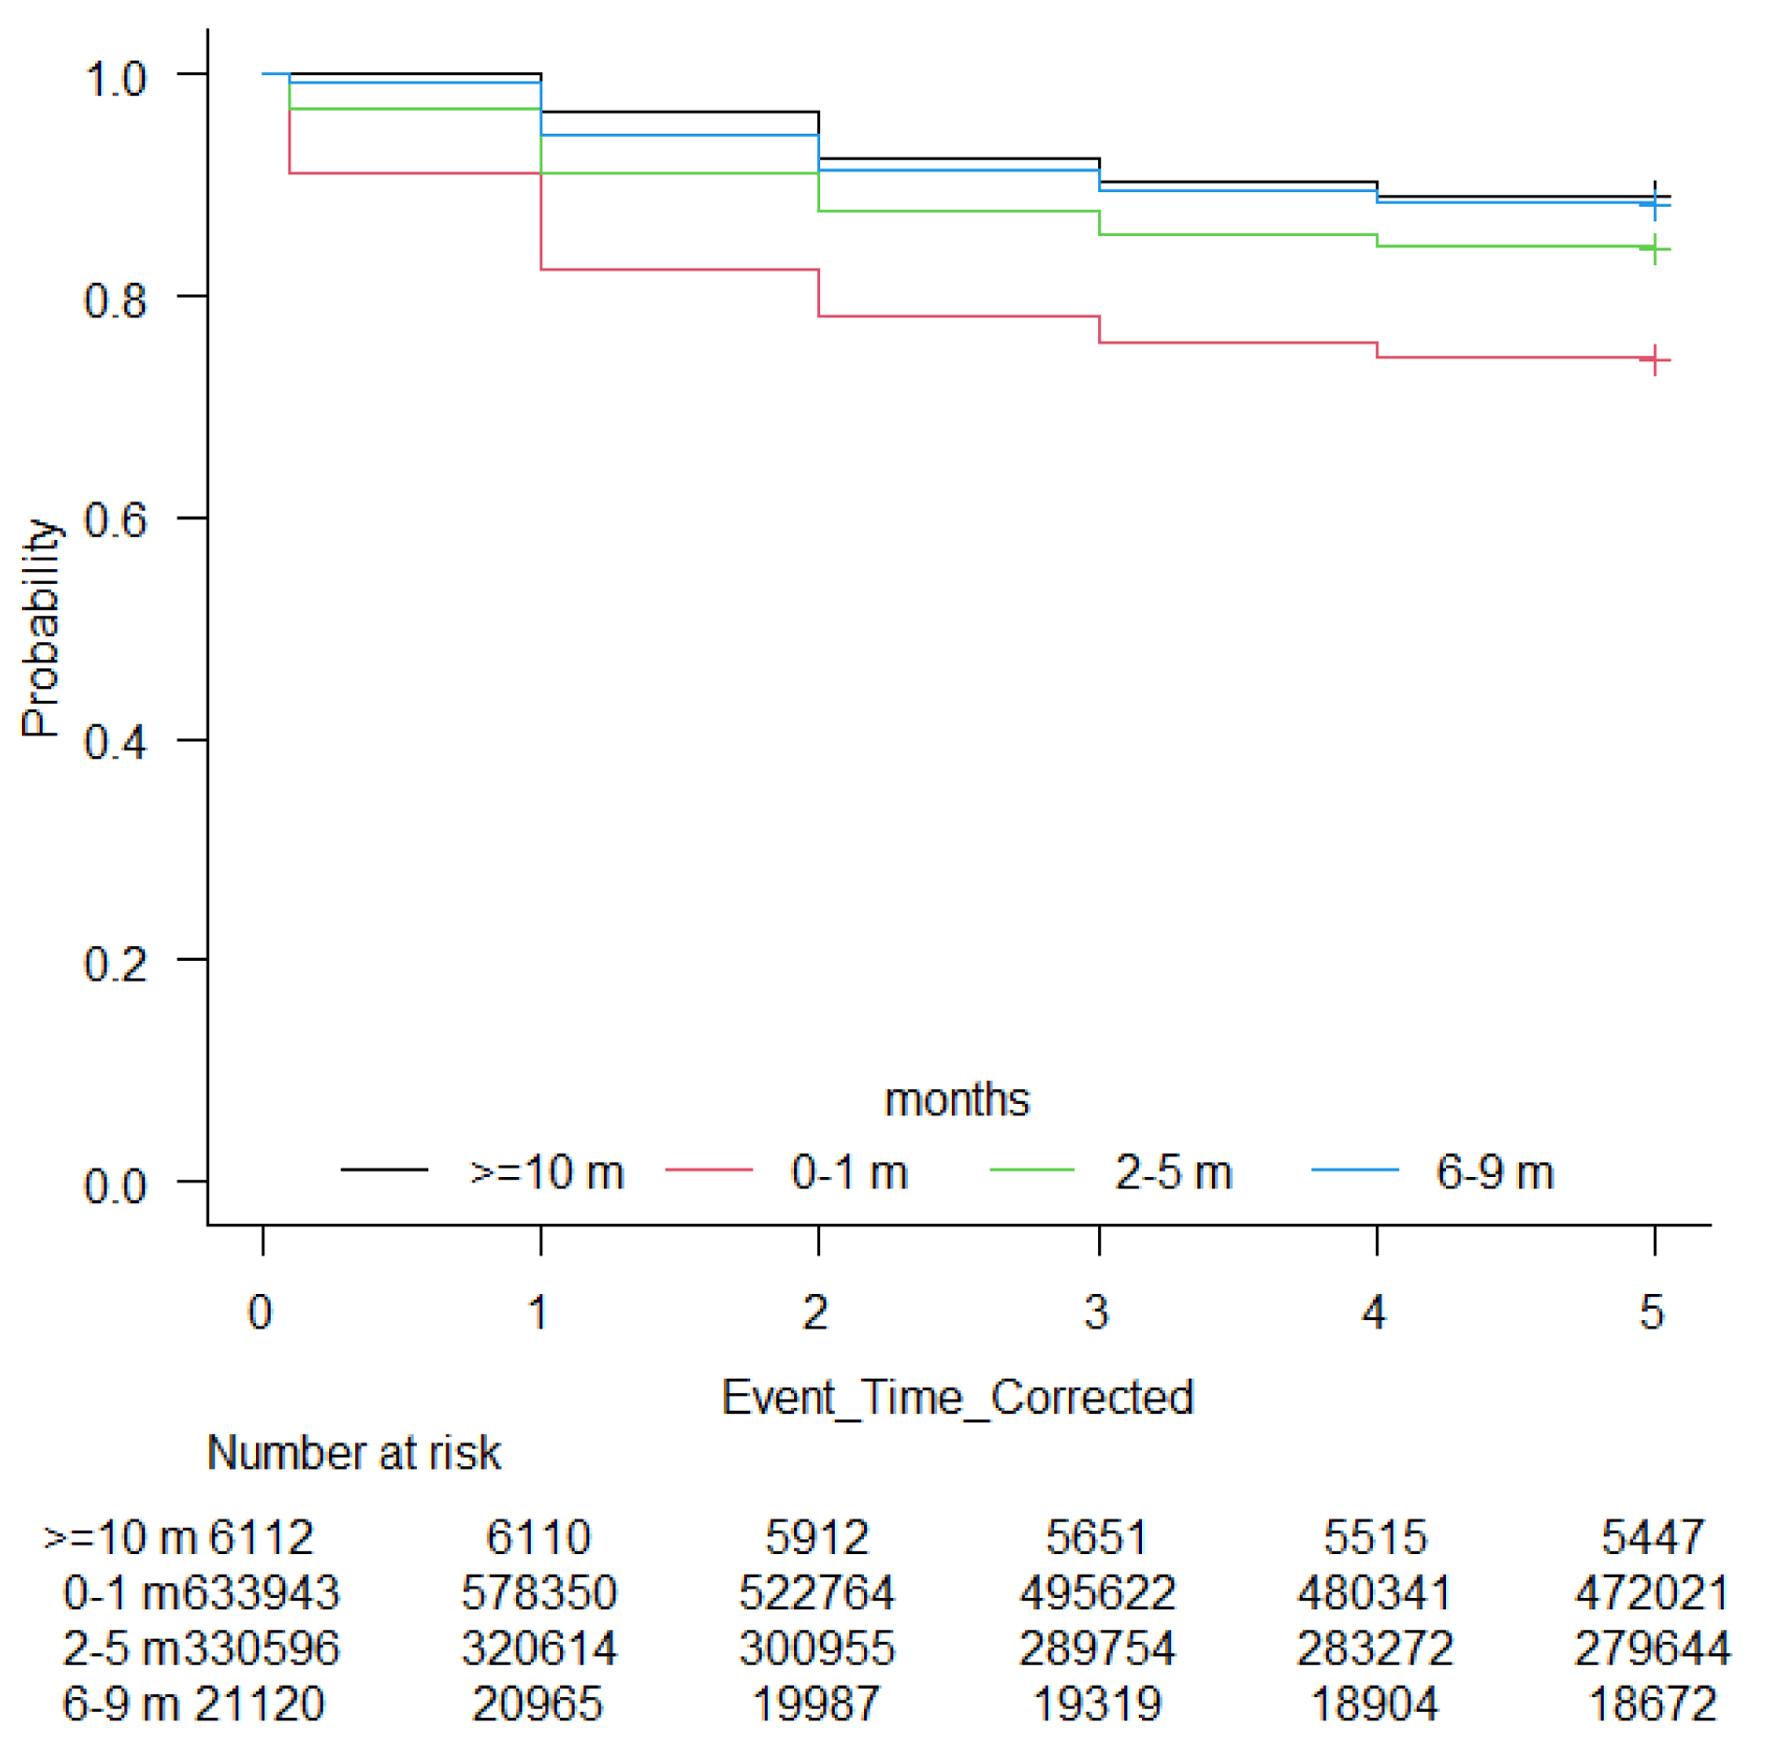
↓ Figure 1. Kaplan-Meier curve showing overall
survival by time-to-treatment initiation (TTI).
| World Journal of Oncology, ISSN 1920-4531 print, 1920-454X online, Open Access |
| Article copyright, the authors; Journal compilation copyright, World J Oncol and Elmer Press Inc |
| Journal website https://wjon.elmerpub.com |
Original Article
Volume 16, Number 3, June 2025, pages 286-294
Time-to-Treatment Initiation and Its Effect on All-Cause Mortality: Insights From the Surveillance, Epidemiology, and End Results Database
Figure
Tables
| Variable | 0 - 1 months | 2 - 5 months | 6 - 9 months | ≥ 10 months | P |
|---|---|---|---|---|---|
| Age | |||||
| < 65 | 286,531 (45.2%) | 147,921 (44.7%) | 9,528 (45.1%) | 2,771 (45.3%) | < 0.001 |
| 65+ | 347,412 (54.8%) | 182,675 (55.3%) | 11,592 (54.9%) | 3,341 (54.7%) | |
| Sex | < 0.001 | ||||
| Female | 400,453 (63.2%) | 158,809 (48.0%) | 4,716 (22.3%) | 1,261 (20.6%) | |
| Male | 233,490 (36.8%) | 171,787 (52.0%) | 16,404 (77.7%) | 4,851 (79.4%) | |
| Marital status | < 0.001 | ||||
| Married | 353,961 (55.8%) | 190,602 (57.7%) | 11,718 (55.5%) | 3,268 (53.5%) | |
| Separated/divorced | 69,932 (11.0%) | 36,421 (11.0%) | 2,244 (10.6%) | 563 (9.2%) | |
| Single/widowed | 210,050 (33.1%) | 103,573 (31.3%) | 7,158 (33.9%) | 2,281 (37.3%) | |
| Race/ethnicity | < 0.001 | ||||
| Non-Hispanic White | 440,604 (69.5%) | 216,209 (65.4%) | 12,348 (58.5%) | 3,542 (58.0%) | |
| Non-Hispanic unknown race | 3,309 (0.5%) | 2,060 (0.6%) | 227 (1.1%) | 76 (1.2%) | |
| Non-Hispanic Black | 66,467 (10.5%) | 44,072 (13.3%) | 3,949 (18.7%) | 1,181 (19.3%) | |
| Non-Hispanic Asian or Pacific Islander | 53,564 (8.4%) | 26,169 (7.9%) | 1,594 (7.5%) | 456 (7.5%) | |
| Non-Hispanic American Indian/Alaska Native | 3,893 (0.6%) | 1,846 (0.6%) | 146 (0.7%) | 31 (0.5%) | |
| Hispanic (all races) | 66,106 (10.4%) | 40,240 (12.2%) | 2,856 (13.5%) | 826 (13.5%) | |
| Household income, inflation-adjusted | < 0.001 | ||||
| < $35,000 | 7,133 (1.1%) | 2,770 (0.8%) | 149 (0.7%) | 47 (0.8%) | |
| $35,000 - $39,999 | 10,606 (1.7%) | 4,293 (1.3%) | 253 (1.2%) | 68 (1.1%) | |
| $40,000 - $44,999 | 23,332 (3.7%) | 10,177 (3.1%) | 600 (2.8%) | 190 (3.1%) | |
| $45,000 - $49,999 | 27,272 (4.3%) | 12,407 (3.8%) | 781 (3.7%) | 245 (4.0%) | |
| $50,000 - $54,999 | 30,602 (4.8%) | 14,190 (4.3%) | 824 (3.9%) | 209 (3.4%) | |
| $55,000 - $59,999 | 52,314 (8.3%) | 25,424 (7.7%) | 1,473 (7.0%) | 432 (7.1%) | |
| $60,000 - $64,999 | 40,911 (6.5%) | 20,717 (6.3%) | 1,325 (6.3%) | 385 (6.3%) | |
| $65,000 - $69,999 | 66,670 (10.5%) | 37,650 (11.4%) | 2,565 (12.1%) | 757 (12.4%) | |
| $70,000 - $74,999 | 70,561 (11.1%) | 40,390 (12.2%) | 2,653 (12.6%) | 754 (12.3%) | |
| $75,000+ | 304,516 (48.0%) | 162,565 (49.2%) | 10,497 (49.7%) | 3,025 (49.5%) | |
| Unknown/missing/no match/not 1990-2021 | 26 (0.0%) | 13 (0.0%) | 0 (0.0%) | 0 (0.0%) | |
| Region | < 0.001 | ||||
| Non-metropolitan | 83,724 (13.2%) | 36,173 (10.9%) | 2,022 (9.6%) | 535 (8.8%) | |
| Metropolitan | 550,219 (86.8%) | 294,423 (89.1%) | 19,098 (90.4%) | 5,577 (91.2%) | |
| Stage | < 0.001 | ||||
| In situ | 51 (0.0%) | 8 (0.0%) | 1 (0.0%) | 0 (0.0%) | |
| Localized | 309,355 (48.8%) | 203,458 (61.5%) | 14,767 (69.9%) | 4,257 (69.6%) | |
| Regional | 176,547 (27.8%) | 87,852 (26.6%) | 4,444 (21.0%) | 1,085 (17.8%) | |
| Distant | 140,973 (22.2%) | 35,844 (10.8%) | 1,451 (6.9%) | 466 (7.6%) | |
| Unknown/unstaged | 7,017 (1.1%) | 3,434 (1.0%) | 457 (2.2%) | 304 (5.0%) | |
| Grade | < 0.001 | ||||
| Well-differentiated/unknown | 423,915 (66.9%) | 215,536 (65.2%) | 14,461 (68.5%) | 4,395 (71.9%) | |
| Moderately differentiated | 126,946 (20.0%) | 75,809 (22.9%) | 4,911 (23.3%) | 1,284 (21.0%) | |
| Poorly differentiated | 78,657 (12.4%) | 38,372 (11.6%) | 1,726 (8.2%) | 428 (7.0%) | |
| Anaplastic | 4,425 (0.7%) | 879 (0.3%) | 22 (0.1%) | 5 (0.1%) | |
| Radiation | < 0.001 | ||||
| No | 19,656 (3.1%) | 11,134 (3.4%) | 583 (2.8%) | 182 (3.0%) | |
| Yes | 614,287 (96.9%) | 319,462 (96.6%) | 20,537 (97.2%) | 5,930 (97.0%) | |
| Chemotherapy | < 0.001 | ||||
| No | 378,930 (59.8%) | 245,170 (74.2%) | 18,795 (89.0%) | 5,503 (90.0%) | |
| Yes | 255,013 (40.2%) | 85,426 (25.8%) | 2,325 (11.0%) | 609 (10.0%) | |
| Surgery | < 0.001 | ||||
| No | 186,609 (29.4%) | 113,480 (34.3%) | 10,243 (48.5%) | 3,131 (51.2%) | |
| Yes | 447,334 (70.6%) | 217,116 (65.7%) | 10,877 (51.5%) | 2,981 (48.8%) | |
| Cancer type | < 0.001 | ||||
| Lung | 142,456 (22.5%) | 66,023 (20.0%) | 3,319 (15.7%) | 809 (13.2%) | |
| Breast | 258,357 (40.8%) | 112,258 (34.0%) | 2,631 (12.5%) | 708 (11.6%) | |
| Prostate | 78,211 (12.3%) | 120,748 (36.5%) | 14,066 (66.6%) | 4,224 (69.1%) | |
| Colon | 154,919 (24.4%) | 31,567 (9.5%) | 1,104 (5.2%) | 371 (6.1%) |
| Cancer type | 0 - 1 months | 2 - 5 months | 6 - 9 months | ≥ 10 months |
|---|---|---|---|---|
| Data presented as event/total. | ||||
| Overall | 165,616/633,943 (26.1%) | 52,608/330,596 (15.9%) | 2,543/21,120 (12.0%) | 694/6,112 (11.4%) |
| Lung | 82,175/142,456 (57.70%) | 30,206/66,023 (45.80%) | 1,309/3,319 (39.40%) | 298/809 (36.80%) |
| Breast | 25,532/254,357 (9.90%) | 8,345/112,258 (7.40%) | 366/2,631 (13.90%) | 98/708 (13.80%) |
| Prostate | 41,825/154,919 (27.00%) | 8,347/31,567 (26.40%) | 335/1,104 (30.30%) | 93/371 (25.10%) |
| Colon | 156,516/633,943 (26.10%) | 52,608/330,596 (15.90%) | 2,543/21,120 (12.00%) | 694/6,112 (11.40%) |
| Variable | HR (95 % CI) | SE | P |
|---|---|---|---|
| CI: confidence interval; HR: hazard ratio; Ref: reference; SE: standard error; TTI: time-to-treatment initiation. | |||
| TTI (months) | |||
| 0 - 1 | Ref | - | - |
| 2 - 5 | 0.90 (0.88 - 0.92) | 0.01 | < 0.001 |
| 6 - 9 | 0.78 (0.72 - 0.85) | 0.03 | < 0.001 |
| ≥ 10 | 0.52 (0.45 - 0.61) | 0.04 | < 0.001 |
| Age | |||
| < 65 | Ref | - | - |
| ≥ 65 | 1.06 (1.05 - 1.08) | 0.01 | < 0.001 |
| Sex | |||
| Female | Ref | - | - |
| Male | 1.08 (1.07 - 1.09) | 0.01 | < 0.001 |
| Race | |||
| Non-Hispanic White | Ref | - | - |
| Non-Hispanic unknown | 0.97 (0.84 - 1.11) | 0.07 | 0.633 |
| Non-Hispanic Black | 1.03 (1.02 - 1.05) | 0.01 | < 0.001 |
| Non-Hispanic Asian/Pacific Islander | 0.94 (0.92 - 0.96) | 0.01 | < 0.001 |
| Non-Hispanic American Indian/Alaska Native | 0.98 (0.92 - 1.04) | 0.03 | 0.429 |
| Hispanic (all) | 0.99 (0.97 - 1.01) | 0.01 | 0.23 |
| Region | |||
| Non-metropolitan | Ref | - | - |
| Metropolitan | 0.93 (0.92 - 0.95) | 0.01 | < 0.001 |
| Marital status | |||
| Married | Ref | - | - |
| Separated | 1.04 (1.03 - 1.06) | 0.01 | < 0.001 |
| Single/unmarried/unknown/widowed | 1.06 (1.05 - 1.08) | 0.01 | < 0.001 |
| Income (USD) | |||
| < 35 k | Ref | - | - |
| 35 - 39 k | 0.95 (0.91 - 1.01) | 0.03 | 0.083 |
| 40 - 44 k | 1.00 (0.95 - 1.05) | 0.02 | 0.999 |
| 45 - 49 k | 0.99 (0.95 - 1.04) | 0.02 | 0.711 |
| 50 - 54 k | 0.99 (0.95 - 1.04) | 0.02 | 0.814 |
| 55 - 59 k | 1.02 (0.98 - 1.07) | 0.02 | 0.323 |
| 60 - 64 k | 0.97 (0.93 - 1.02) | 0.02 | 0.213 |
| 65 - 69 k | 0.93 (0.89 - 0.98) | 0.02 | 0.003 |
| 70 - 74 k | 1.08 (1.03 - 1.13) | 0.03 | 0.001 |
| ≥ 75 k | 1.04 (0.99 - 1.09) | 0.02 | 0.102 |
| Unknown/missing | 0.30 (0.08 - 1.21) | 0.21 | 0.09 |
| Cancer site | |||
| Lung | Ref | - | - |
| Breast | 0.81 (0.80 - 0.83) | 0.01 | < 0.001 |
| Prostate | 0.67 (0.66 - 0.69) | 0.01 | < 0.001 |
| Colon | 0.95 (0.94 - 0.97) | 0.01 | < 0.001 |
| Tumor grade | |||
| Well-differentiated | Ref | - | - |
| Moderately differentiated | 0.36 (0.35 - 0.37) | 0.01 | < 0.001 |
| Poorly differentiated | 0.52 (0.50 - 0.53) | 0.01 | < 0.001 |
| Anaplastic | 0.84 (0.77 - 0.91) | 0.04 | < 0.001 |
| Stage | |||
| In situ | Ref | - | - |
| Localized | 0.44 (0.03 - 6.08) | 0.59 | 0.538 |
| Regional | 0.67 (0.05 - 9.23) | 0.89 | 0.761 |
| Distant | 0.98 (0.07 - 13.62) | 1.32 | 0.989 |
| Unknown/unstaged | 0.58 (0.04 - 8.11) | 0.78 | 0.688 |
| Radiation | |||
| No | Ref | - | - |
| Yes | 1.00 (0.94 - 1.07) | 0.03 | 0.969 |
| Chemotherapy | |||
| No | Ref | - | - |
| Yes | 0.91 (0.89 - 0.93) | 0.01 | < 0.001 |
| Surgery | |||
| No | Ref | - | - |
| Yes | 0.84 (0.83 - 0.85) | 0.01 | < 0.001 |
| Time-varying covariates | |||
| Stage (time-varying) | |||
| In situ | Ref | - | - |
| Localized | 0.85 (0.10 - 7.32) | 0.94 | 0.885 |
| Regional | 0.77 (0.09 - 6.62) | 0.85 | 0.813 |
| Distant | 0.70 (0.08 - 6.04) | 0.77 | 0.75 |
| Unknown/unstaged | 0.82 (0.10 - 7.05) | 0.9 | 0.858 |
| Grade (time-varying) | |||
| Well-differentiated | Ref | - | - |
| Moderately differentiated | 1.31 (1.30 - 1.33) | 0.01 | < 0.001 |
| Poorly differentiated | 1.22 (1.20 - 1.23) | 0.01 | < 0.001 |
| Anaplastic | 1.03 (0.99 - 1.08) | 0.02 | 0.109 |
| Chemotherapy (time-varying) | |||
| No | Ref | - | - |
| Yes | 1.03 (1.02 - 1.04) | 0.01 | < 0.001 |
| Radiation (time-varying) | |||
| No | Ref | - | - |
| Yes | 0.97 (0.95 - 1.00) | 0.01 | 0.039 |
| TTI (months, time-varying) | |||
| 0 - 1 | Ref | - | - |
| 2 - 5 | 1.02 (1.01 - 1.03) | 0.01 | < 0.001 |
| 6 - 9 | 1.08 (1.04 - 1.12) | 0.02 | < 0.001 |
| ≥ 10 | 1.23 (1.16 - 1.31) | 0.04 | < 0.001 |