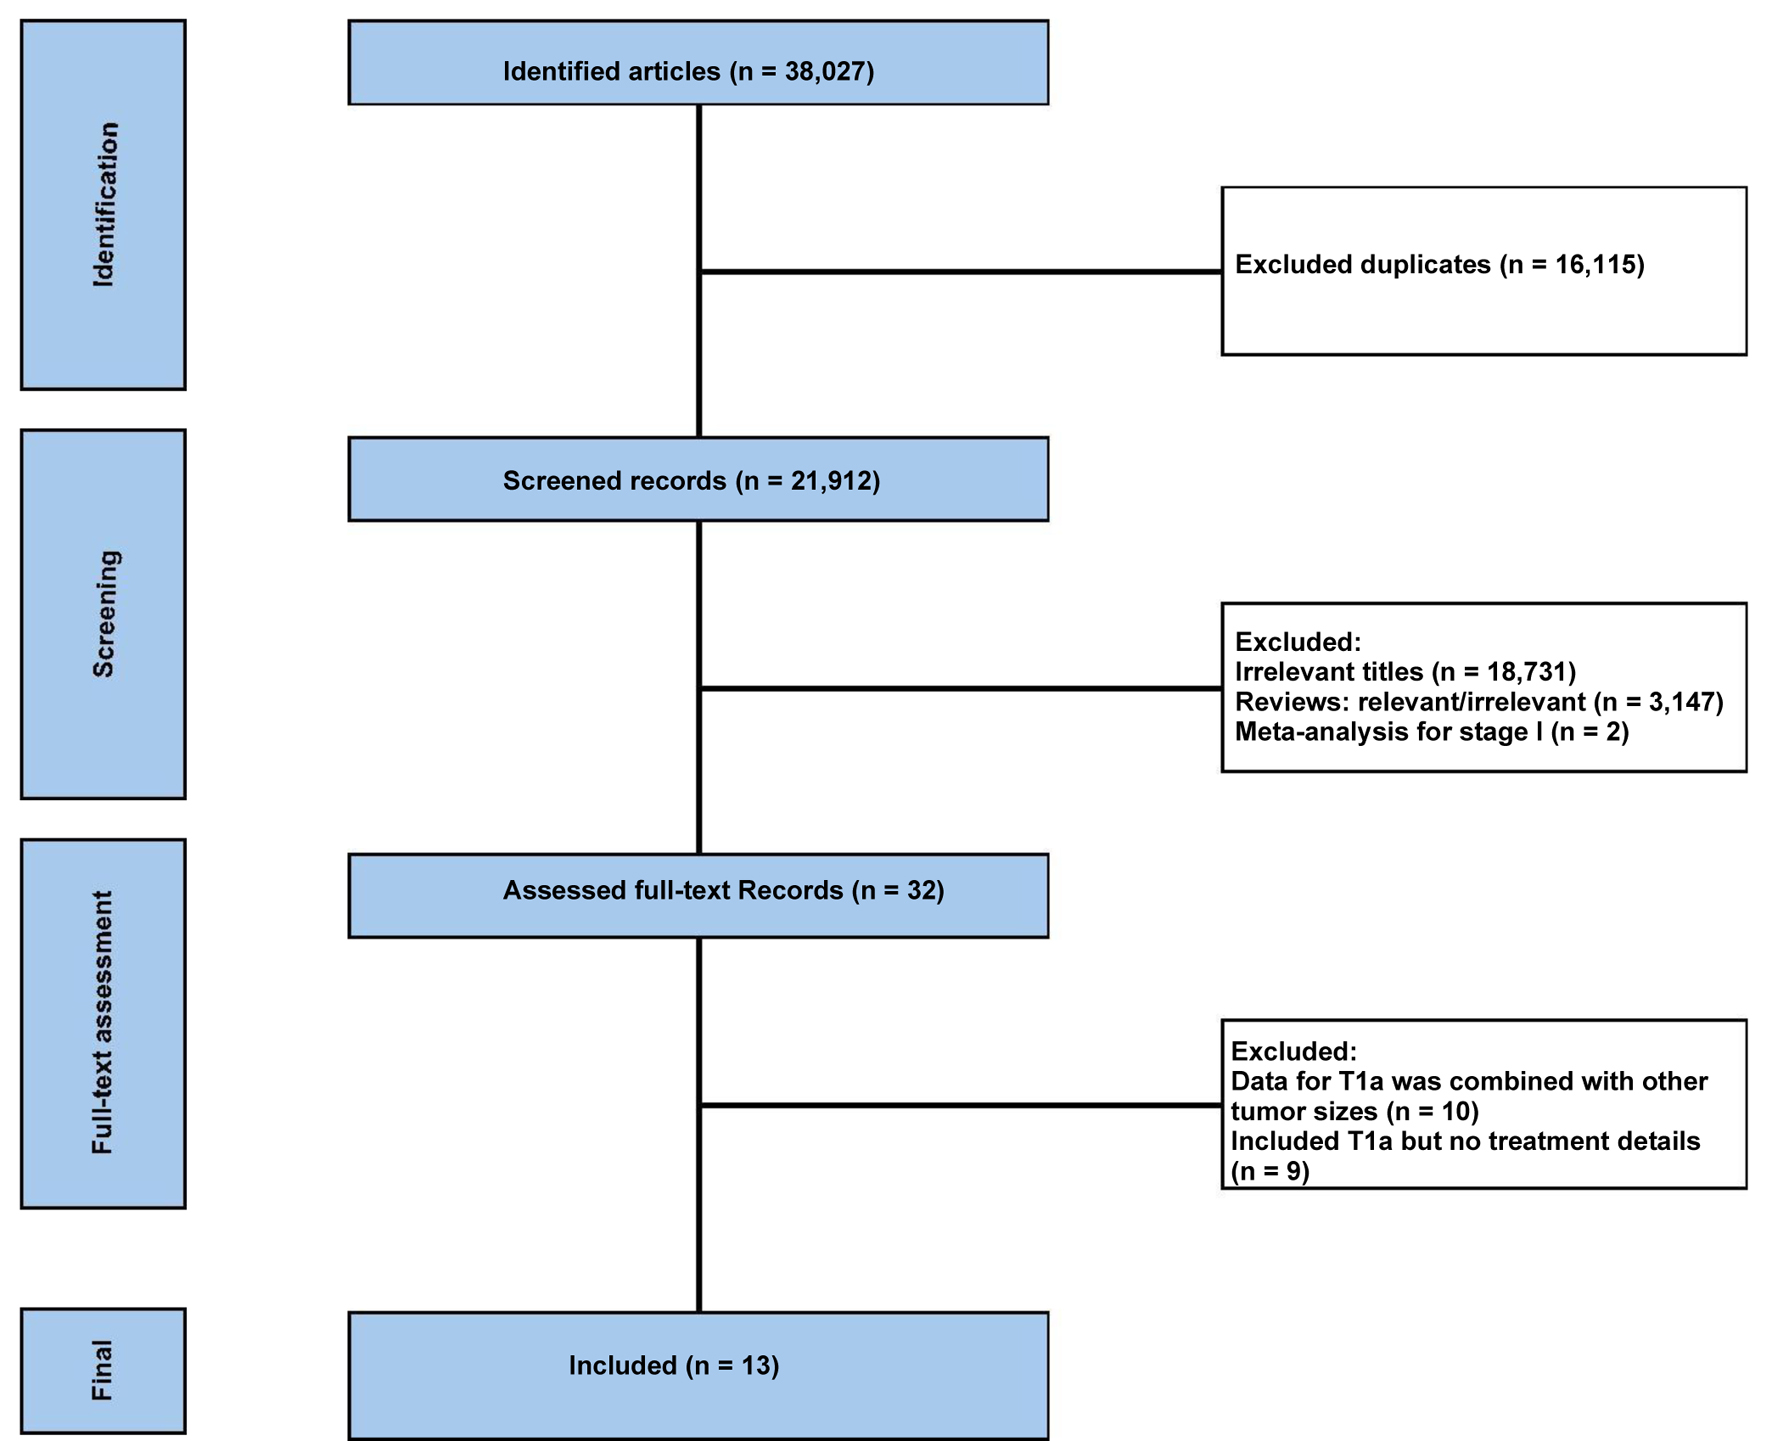
↓ Figure 1. The flowchart of the study selection
process.
| World Journal of Oncology, ISSN 1920-4531 print, 1920-454X online, Open Access |
| Article copyright, the authors; Journal compilation copyright, World J Oncol and Elmer Press Inc |
| Journal website https://wjon.elmerpub.com |
Original Article
Volume 16, Number 3, June 2025, pages 276-285
Adjuvant Therapy Benefits for Patients With Human Epidermal Growth Factor Receptor 2-Positive T1aN0M0 Breast Cancer: A Systematic Review and Meta-Analysis
Figures
Tables
| Study | Year | Design | N | Grade, N (%) | ER+, N (%) |
|---|---|---|---|---|---|
| ER+: endocrine receptor-positive; Group A, B, and C: who received no adjuvant therapy, received chemotherapy alone, and received chemotherapy and trastuzumab, respectively; HER2: human epidermal growth factor receptor 2; MIBC: microinvasive breast cancer; NR: not reported or could not be extracted; TH: paclitaxel + trastuzumab. | |||||
| Joensuu et al [18] | 2003 | Retrospective | 69 (T1a-b) | NR | NR |
| Curigliano et al [19] | 2009 | Retrospective | 85 | NR | NR |
| Livi et al [20] | 2012 | Retrospective | 28 | NR | NR |
| Gamucci et al [21] | 2013 | Retrospective | 96 (T1a-c) | NR | NR |
| Fehrenbacher et al [22] | 2014 | Prospective, cohort | 116 | I and II: 60 (52), III: 21 (18), unknown: 35 (30) | 60 (52) |
| Vaz-Luis et al [23] | 2014 | Prospective, cohort | 216 | NR | 135 (62) |
| van Ramshorst et al [24] | 2016 | Retrospective | 385 (54 (14%) patients had MIBC) | NR | NR |
| Dall et al [25] | 2017 | Prospective | 97 | NR | NR |
| de Nonneville et al [26] | 2017 | Retrospective | 138 | NR | NR |
| Musolino et al [27] | 2017 | Retrospective | 121 | NR | NR |
| He et al [28] | 2020 | Retrospective | 135 | I/II/III Group A: 6 (2.4)/75 (30)/167 (67); group B: 3 (2)/37 (20)/138 (76); group C: 0 (0)/31 (20)/124 (79) |
Group A: 158 (63); group B: 99 (49); group C: 96 (61) |
| Kubo et al [29] | 2019 | Retrospective | 489 | NR | 178 (36) |
| Tarantino et al [30] | 2024 | Phase II, randomized | T1a: T-DM1 61, TH 20 | NR | T1a to T2: 75% |
| Study | Follow-up, years | Adjuvant therapy and survival outcomes, N (%) | Comments | |||
|---|---|---|---|---|---|---|
| No CT or H | CT only | H only | CT and H | |||
| BCSS: breast cancer-specific survival; CI: confidence interval; CT: chemotherapy; DDFS: distant disease-free survival; DFS: disease-free survival; ER: endocrine receptor; H: trastuzumab; HR: hazard ratio; OS: overall survival; TH: paclitaxel plus trastuzumab. | ||||||
| Joensuu et al [18] | 9.5 | 0 | 0 | 0 | ||
| Adjuvant therapy, N (%) | T1ab: 69 (100) | |||||
| DDFS at 9 years (T1a) | 100% | 0 | 0 | 0 | ||
| Curigliano et al [19] | 4.5 | |||||
| DFS at 5 years | ||||||
| ER+ | 88% | Only 25.5% received CT | ||||
| ER- | 93% | Only 43.7% received CT | ||||
| Livi et al [20] | 4.9 | |||||
| Adjuvant therapy, N (%) | 28 (100) | 0 | 0 | 0 | ||
| DFS at 3 years | 100% | 0 | 0 | 0 | ||
| DDFS at 3 years | 100% | |||||
| Gamucci et al [21] | 5.6 | |||||
| Adjuvant therapy, N (%) | 0 | 0 | 0 | 3 (T1a-c) | The number in T1a was not reported | |
| DFS at 5-year | 100% | All HER2-positive T1a, regardless of adjuvant therapy | ||||
| Fehrenbacher et al [22] | 5.8 | |||||
| Adjuvant therapy, N (%) | 100 (86.2) | 9 (7.8) | 1 (0.9) | 6 (5.2) | ||
| Locoregional-free survival at 5 years | 98% | 100% | 100% | 100% | ||
| DFS at 5 years | 97% | 100% | 100% | 100% | ||
| DDFS at 5 years | 99% | 100% | 100% | 100% | ||
| Dall et al [25] | 3.3 | |||||
| Adjuvant therapy, N (%) | 0 | 0 | 0 | 97 (100) | ||
| DFS at 3 years | 100% | |||||
| DFS at 5 years | 96% | |||||
| Musolino et al [27] | 9.6 | |||||
| Adjuvant therapy, N (%) | 121 | 0 | 0 | 0 | ||
| DFS at 5 years | 90% | |||||
| Kubo et al [29] | 6.3 | |||||
| Adjuvant therapy, N (%) | 369 (75) | 58 (12) | 23 (5) | 39 (8) | ||
| DFS at 3 years | 98% | HR (95% CI) for treated vs. untreated patients: 1.29 (0.51 - 3.25), P = 0.59 | Lack of OS or DFS treatment effect, regardless of ER status | |||
| DFS at 5 years | 96% | |||||
| OS at 3 years | 99.7% | HR (95% CI) for treated vs. untreated patients: 1.58 (0.27 - 9.11), P = 0.61 | ||||
| OS at 5 years | 99.1% | |||||
| He et al [28] | 10.25 | |||||
| Adjuvant therapy, N (%) | 101 (75) | 7 (5) | 0 | 27 (20) | ||
| DFS at 10 years | 92.6% | Groups A, B, and C: T1a | ||||
| DDFS at 10 years | 94.9% | Groups A, B, and C: T1a | ||||
| BCSS at 10 years | 97.4% | Groups A, B, and C: T1a | ||||
| OS at 10 years | 91.3% | Groups A, B, and C: T1a | ||||
| Tarantino et al [30] | 5.8 | |||||
| Adjuvant therapy, N (%) | ||||||
| iDFS at 5 years | ||||||
| T-DM1 | 97.7% | |||||
| TH | 90% | |||||
| CT with or without H | ||||||
| Vaz-Luis et al [23] | 5.5 | |||||
| Adjuvant therapy in ER+, N (%) | 102 (75) | 33 (25) | ||||
| DDFS at 5 years | 96% | 100% | ||||
| Adjuvant therapy in ER-, N (%) | 49 (60) | 32 (40) | ||||
| DDFS at 5 years | 93% | 100% | ||||
| OS at 5 years | 93% | 100% | ||||
| van Ramshorst et al [24] | 5.1 | |||||
| Adjuvant therapy, N (%) | 357 (93) | 28 (7) | ||||
| BCSS at 8 years | 95% | 100% | T1a: treated vs. untreated: HR = 0.05, P = 0.62 T1a vs. T1c: HR = 0.39 (95% CI: 0.18 - 0.83), P = 0.02 |
|||
| OS at 8 years | 85% | 100% | T1a: treated vs. untreated: HR = 0.05, P = 0.47 T1a vs. T1c: HR = 0.58 (95% CI: 0.34 - 0.97), P = 0.04 |
|||
| Treatment effect on BCSS and OS was similar in T1a, T1b, and T1c | ||||||
| de Nonneville et al [26] | No adjuvant: 5.3 Adjuvant: 3.2 |
|||||
| Adjuvant therapy, N (%) | 95 (67) | 43 (33) | ||||
| DFS at 3 years | 94% | 100% | ||||
| DFS at 5 years | 91% | 85% | Treated vs. untreated: P = 0.91 | |||