World Journal of Oncology, ISSN 1920-4531 print, 1920-454X online, Open Access
Article copyright, the authors; Journal compilation copyright, World J Oncol and Elmer Press Inc
Journal website https://wjon.elmerpub.com

Original Article

Volume 16, Number 3, June 2025, pages 254-268


Co-expression of HER2/EGFRvIII/CD44 and Claudin 18.2/CD109 as Novel Prognostic Indicators in Stomach Adenocarcinoma

Figures

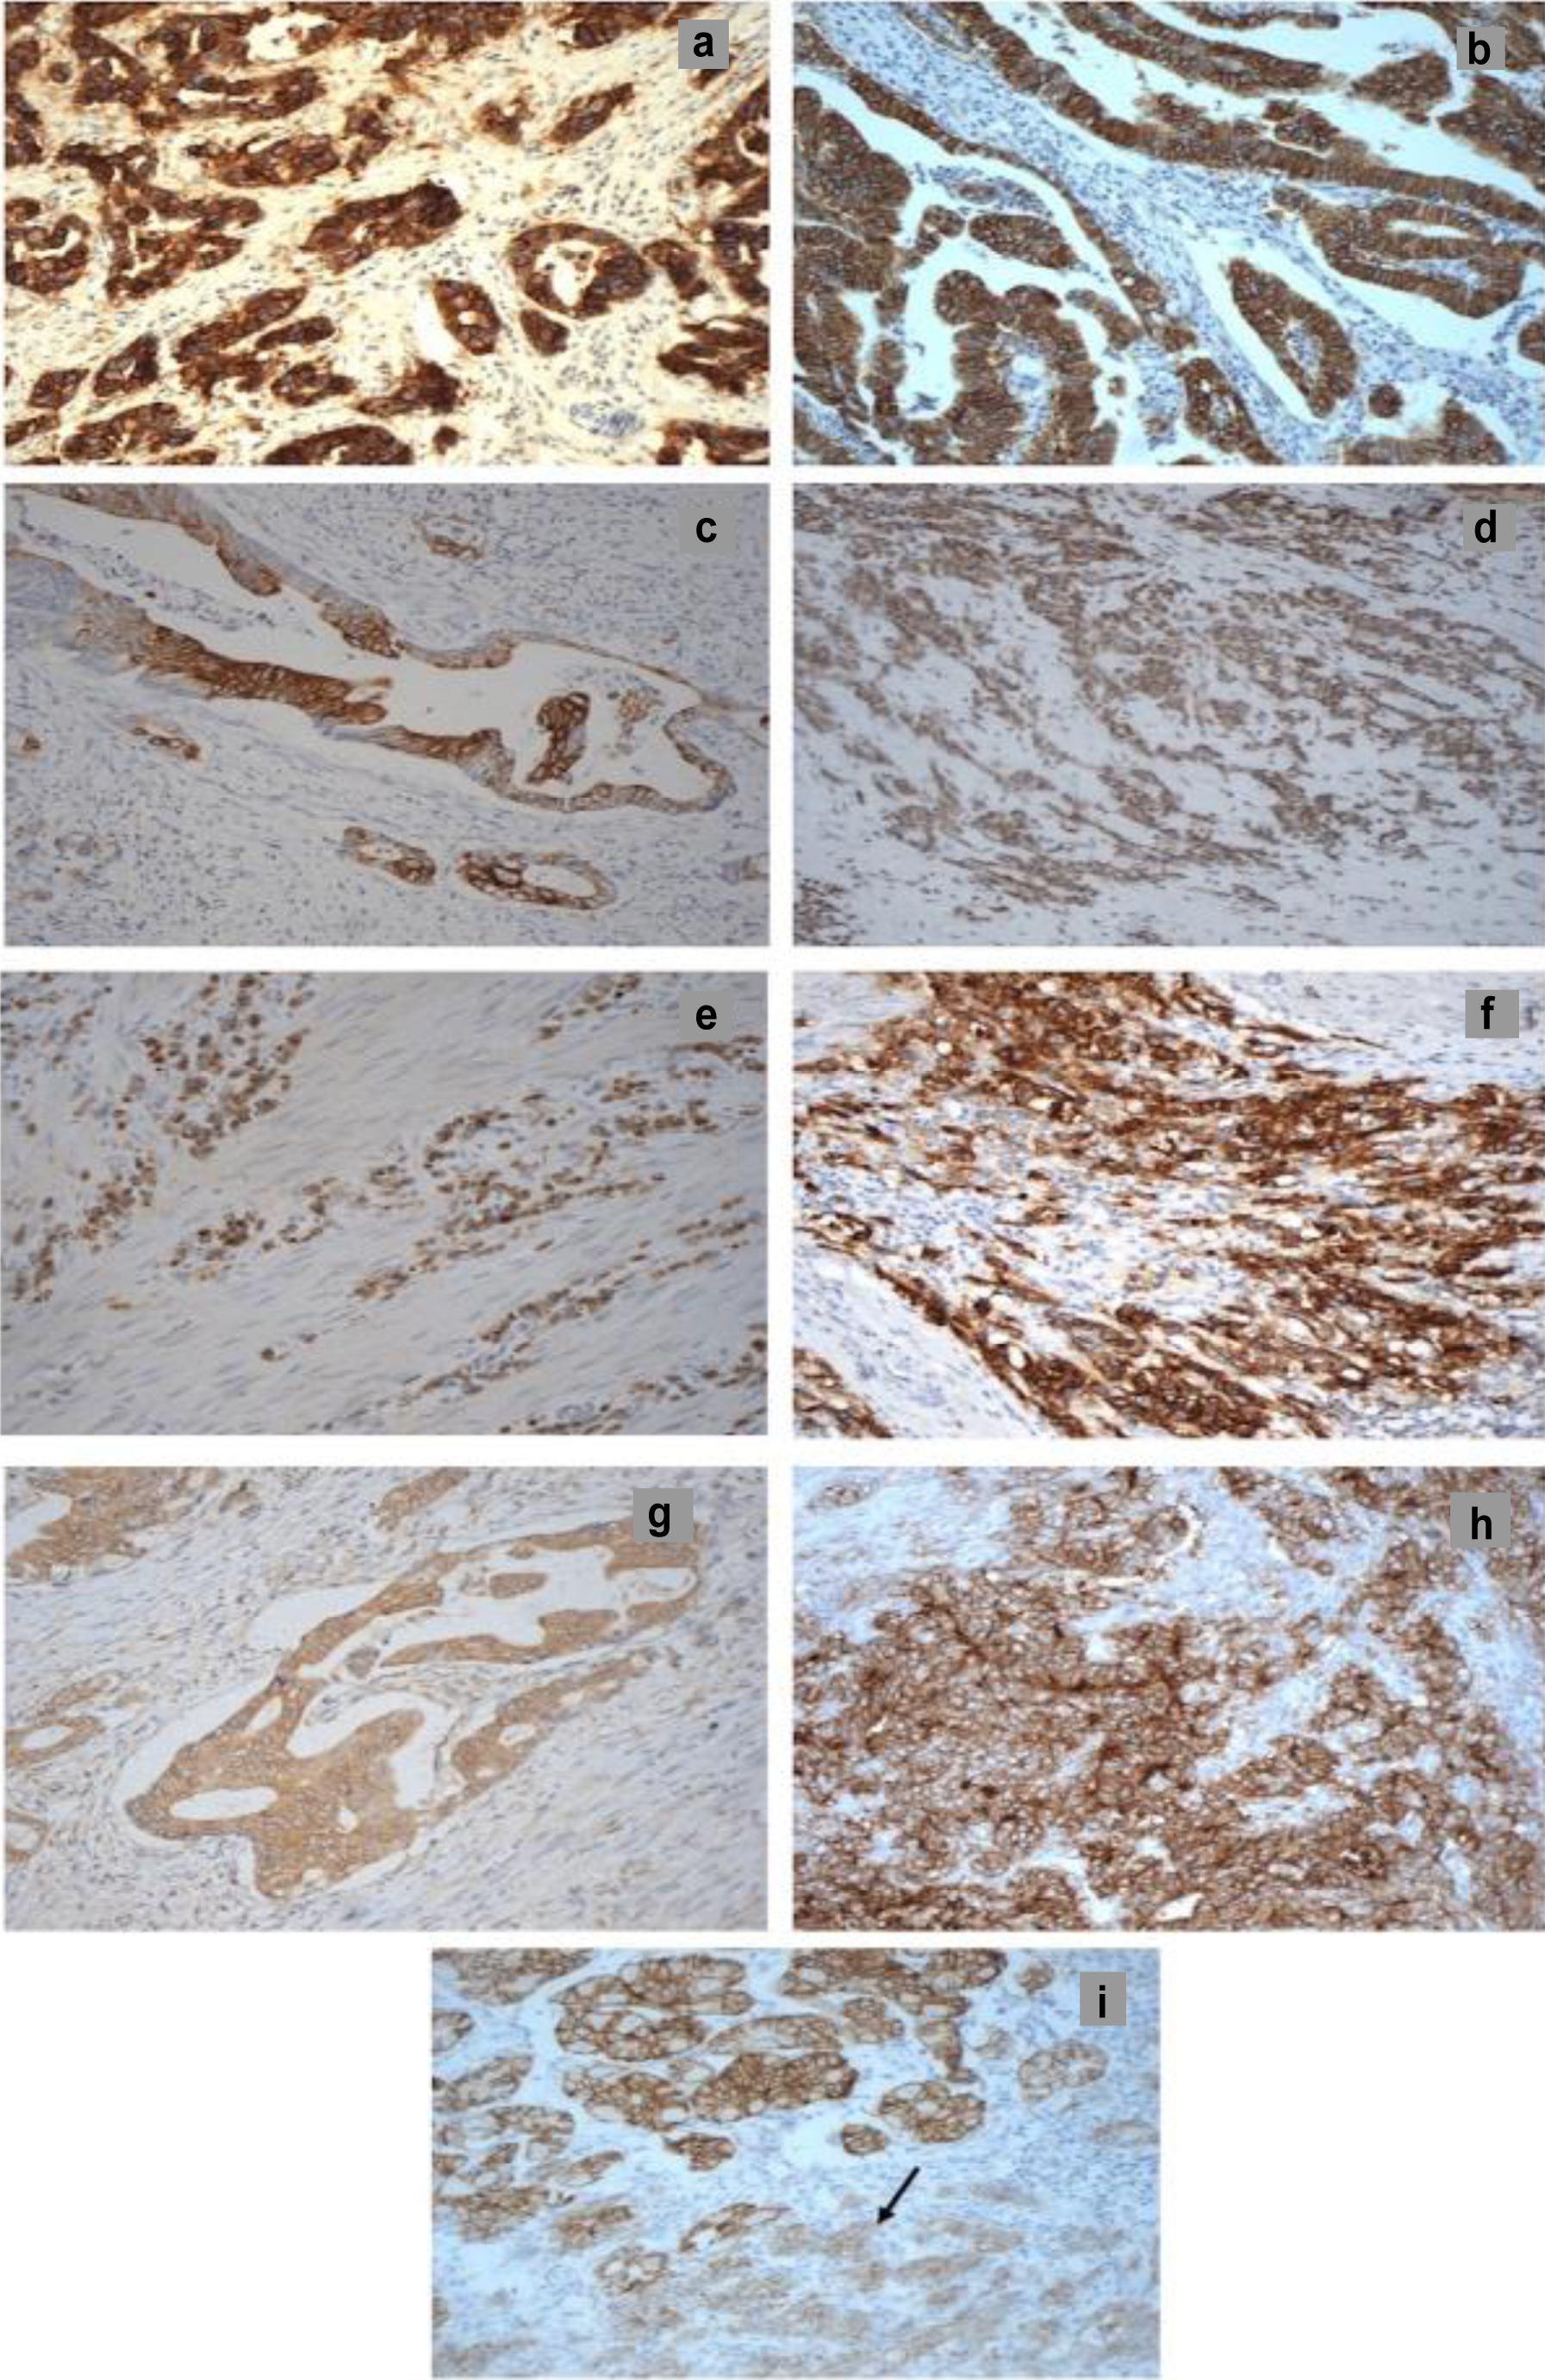
↓  Figure 1. The immunohistochemical staining of HER family members, EGFRvIII, CD44, CD109, and CLDN18.2 in whole tumor specimens from patients with stomach adenocarcinoma (× 200 magnification). (a) EGFR 3+ membranous/cytoplasmic, (b) HER2 3+ membranous, (c) HER3 2+/3+ membranous, (d) HER4 1+ nuclear/cytoplasmic, (e) EGFRvIII 2+ cytoplasmic, (f) CD44 3+ membranous, (g) CD109 1+ membranous/cytoplasmic, (h) CLDN18.2 2+/3+ membranous, and (i) CLDN18.2 3+ in normal tissue and 2+ in tumor (arrow). CD44: cluster of differentiation 44; CD109: cluster of differentiation 109; CLDN18.2: claudin 18.2; EGFR: epidermal growth factor receptor; EGFRvIII: epidermal growth factor receptor variant III; HER2: human epidermal growth factor receptor.
Figure 1.
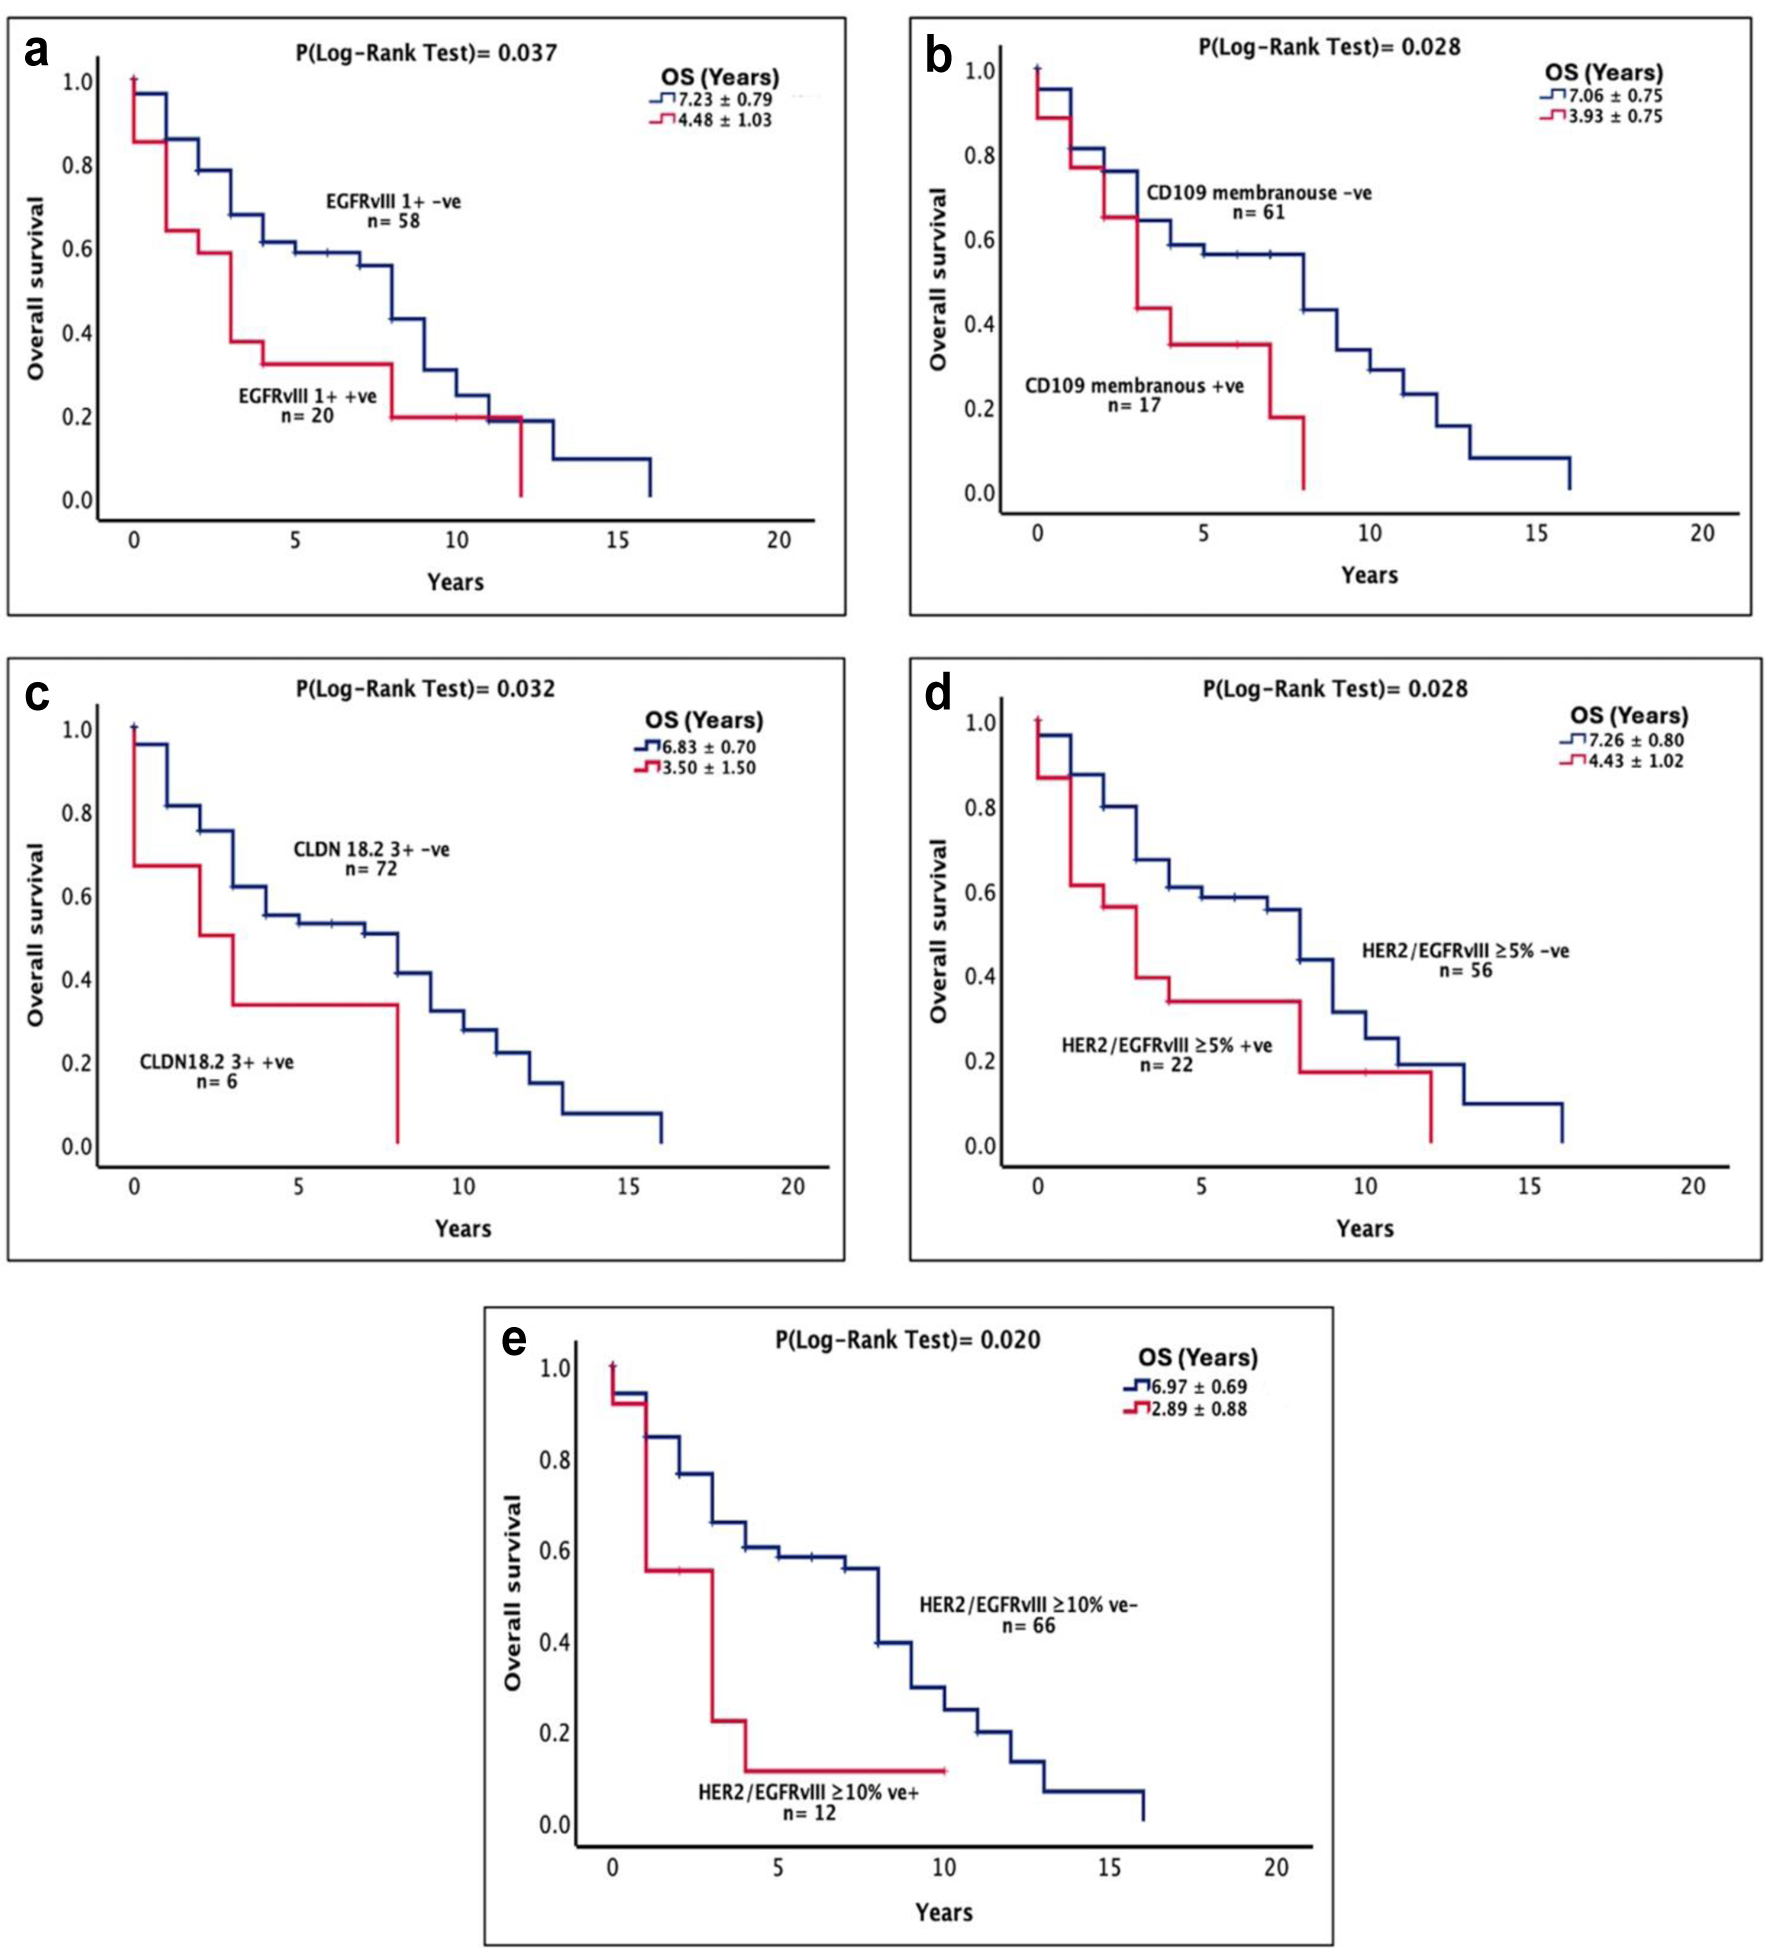
↓  Figure 2. The prognostic significance and the association between the sub-categories of receptor expression and the OS of stomach cancer patients expressing EGFRvIII intensity 1+ (a), CD109 membranous expression (b), CLDN18.2 intensity 3+ (c), HER2/EGFRvIII at cut-off value of ≥ 5% (d), and HER2/EGFRvIII at cut-off value of ≥ 10% (e). A log-rank test value of P ≤ 0.05 was considered statistically significant. CD109: cluster of differentiation 109; CLDN18.2: claudin 18.2; EGFRvIII: epidermal growth factor receptor variant III; HER2: human epidermal growth factor receptor 2; OS: overall survival.
Figure 2.
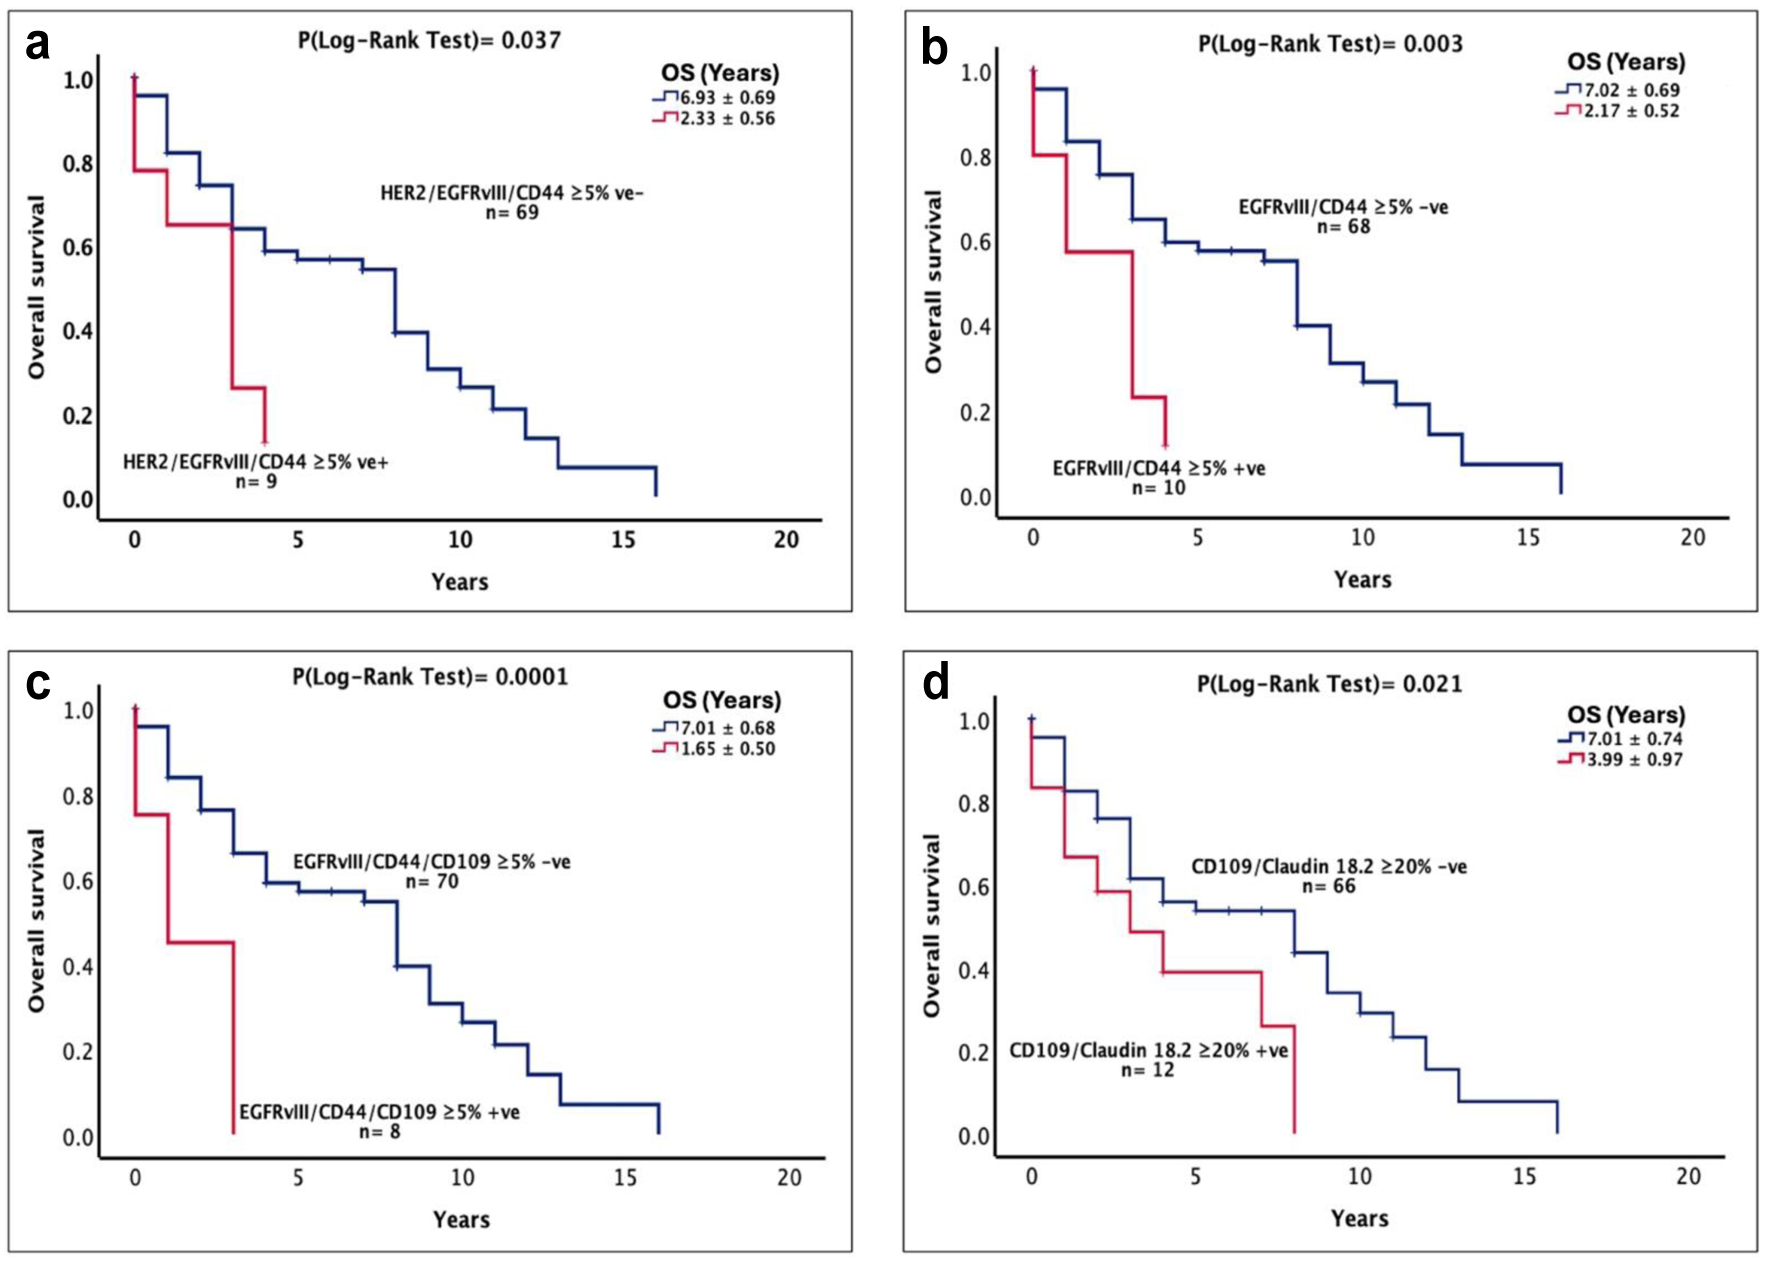
↓  Figure 3. The prognostic significance and the association between the sub-categories of receptor expression and the OS of stomach cancer patients expressing HER2/EGFRvIII/CD44 at cut-off value of ≥ 5% (a), EGFRvIII/CD44 at cut-off value of ≥ 5% (b), EGFRvIII/CD44/CD109 at cut-off value of ≥ 5% (c), and CD109/CLDN18.2 at a cut-off value of ≥ 20% (d) in patients with stomach cancer. A log-rank test value of P ≤ 0.05 was considered statistically significant. CD44: cluster of differentiation 44; CLDN18.2: claudin 18.2; EGFRvIII: epidermal growth factor receptor variant III; HER2: human epidermal growth factor receptor 2; OS: overall survival.
Figure 3.

Tables

↓  Table 1. Patient Clinicopathological Characteristics and Association With Overall Survival Using Kaplan-Meier Analysis and Log-Rank Test in 78 Stomach Tumor Specimens
 
Characteristics Number of patients (%) Overall survival in years (mean ± SE) 95% CI P-value
*Statistically significant. CI: confidence interval; SE: standard error.
Age 0.369
  < 60 12 (15.4) 7.0 ± 1.5 4.0 - 10.0
  ≥ 60
Gender 66 (84.6) 6.3 ± 0.7 5.0 - 7.5 0.277
  Male
Lauren classification 55 (70.5) 6.9 ± 0.8 5.3 - 8.5 0.394
  Intestinal type 39 (50.6) 6.1 ± 0.8 4.5 - 7.7
  Diffuse type/mixed type
T-stage 38 (44.2) 7.2 ± 0.9 5.3 - 9.1 0.185
  T1 + T2 39 (50.0) 7.2 ± 0.8 5.6 - 8.9
  T3 + T4
Grade 39 (50.0) 5.2 ± 0.7 3.8 - 6.7 0.353
  < G3 22 (28.2) 5.6 ± 1.1 3.4 - 7.7
  G3
Lymph node invasion 56 (71.8) 6.7 ± 0.7 5.2 - 8.1 0.030*
  Absent 32 (41.0) 8.4 ± 1.8 6.1 - 10.7
  Present
Lymphatic invasion 46 (59.0) 5.3 ± 0.7 4.0 - 6.7 0.575
  Absent 32 (41.0) 6.9 ± 0.9 5.1 - 8.6
  Present
Vascular invasion 46 (59.0) 6.4 ± 0.9 4.4 - 8.3 0.057
  Absent 57 (73.1) 7.1 ± 0.8 5.6 - 8.6
  Present
Perineural invasion 21 (26.9) 4.4 ± 0.8 2.9 - 5.9 0.019*
  Absent 50 (64.1) 7.3 ± 0.8 5.9 - 8.8
  Present 28 (35.9) 3.9 ± 0.7 2.5 - 5.3


↓  Table 2. Immunohistochemical Expression/Co-Expression of HER Family Members, EGFRvIII, CD44, CD109, and CLDN18.2
 
Receptor expression
Scoring criteria Wt-EGFR HER2 HER3 HER4 EGFRvIII CD44 CD109 CLDN18.2
Percentage of positive tumor cells, %
  ≥ 5% 10 (12.8) 64 (82.1) 7 (9.0) 26 (33.3) 26 (33.3) 32 (41.0) 47 (60.3) 31 (39.7)
  ≥ 10% 6 (7.7) 60 (76.9) 4 (5.1) 19 (24.4) 17 (21.8) 31 (39.7) 44 (56.4) 24 (30.8)
  ≥ 20% 3 (3.8) 53 (67.9) 2 (2.6) 15 (19.2) 10 (12.8) 24 (34.6) 34 (43.6) 17 (21.8)
  ≥ 50% 1 (1.3) 28 (35.9) 0 4 (5.1) 7 (9.0) 13 (15.7) 20 (23.3) 13 (16.7)
Intensity
  1+ 8 (10.3) 34 (43.6) 4 (5.1) 25 (32.1) 20 (25.6) 14 (17.9) 47 (60.3) 19 (24.4)
  2+ 0 32 (41.0) 4 (5.1) 1 (1.3) 11 (14.1) 16 (20.5) 1 (1.3) 14 (17.9)
  3+ 2 (2.6) 6 (7.7) 2 (2.6) 0 0 14 (17.9) 0 6 (7.7)
Sub-cellular localization
  Membranous 3 (3.8) 10 (12.8) 5 (6.4) 0 0 32 (41.0) 17 (19.8) 31 (39.7)
  Cytoplasmic 10 (12.8) 61 (78.2) 3 (2.8) 17 (21.8) 25 (32.1) 0 47 (60.3) 0
  Nuclear 0 0 0 22 (28.2) 2 (2.6) 0 0 0
Co-expression
Markers ≥ 5% cut-off ≥ 10% cut-off ≥ 20% cut-off ≥ 50% cut-off
CD: cluster of differentiation; CLDN18.2: claudin 18.2; EGFRvIII: epidermal growth factor receptor variant III; HER2: human epidermal growth factor receptor 2; wt: wild-type.
Wt-EGFR/HER2 7 (9.0) 4 (5.1) 1 (1.3) 0
Wt-EGFR/CD109 8 (10.3) 6 (7.7) 3 (3.8) 1 (1.3)
HER2/HER4 21 (26.9) 14 (17.9) 11 (14.1) 1 (1.3)
HER2/EGFRvIII 22 (28.2) 12 (15.4) 4 (5.1) 0
HER2/CD44 26 (33.3) 21 (26.9) 16 (20.5) 4 (5.1)
HER2/CD109 38 (48.7) 34 (43.6) 24 (30.8) 10 (12.8)
HER2/CLDN18.2 25 (32.1) 19 (24.4) 13 (16.7) 4 (5.1)
HER2/EGFRvIII/CD44 9 (11.5) 4 (5.1) 4 (5.1) 0
HER2/EGFRvIII/CD109 13 (16.7) 5 (6.4) 1 (1.3) 0
HER2/CD44/CD109 20 (25.6) 16 (20.5) 10 (12.8) 3 (3.8)
HER2/CD44/CLDN18.2 13 (16.7) 9 (11.5) 3 (3.8) 0
HER2/CD44/CD109/CLDN18.2 12 (15.4) 9 (11.5) 2 (2.6) 0
HER2/ CD109/CLDN18.2 20 (25.6) 16 (20.5) 9 (11.5) 2 (2.6)
HER4/EGFRvIII 7 (9.0) 1 (1.3) 0 0
HER4/CD44 15 (19.2) 8 (10.3) 7 (9.0) 0
HER4/CD109 19 (24.4) 16 (20.5) 8 (10.3) 1 (1.3)
HER4/CLDN18.2 13 (16.7) 8 (10.3) 4 (5.1) 0
HER4/CD44/CD109 11 (14.1) 7 (9.0) 5 (6.4) 0
HER4/CD44/CLDN18.2 8 (10.3) 3 (3.8) 0 0
HER4/CD109/CLDN18.2 13 (16.7) 8 (10.3) 3 (3.8) 0
HER4/CD44/CD109/CLDN18.2 8 (10.3) 3 (3.6) 0 0
EGFRvIII/CD44 10 (12.8) 4 (5.1) 4 (5.1) 1 (1.3)
EGFRvIII/CD109 14 (17.9) 6 (7.7) 2 (2.6) 0
EGFRvIII/CLDN18.2 10 (12.8) 2 (2.6) 0 0
EGFRvIII/CD44/CD109 8 (10.3) 3 (3.8) 1 (1.3) 0
EGFRvIII/CD109/CLDN18.2 7 (9.0) 2 (2.6) 0 0
CD44/CD109 24 (30.8) 20 (25.6) 13 (16.7) 5 (6.4)
CD44/CLDN18.2 15 (19.2) 11 (14.1) 3 (3.8) 2 (2.6)
CD44/CD109/CLDN18.2 14 (17.9) 10 (12.8) 2 (2.6) 1 (1.3)
CD109/CLDN18.2 25 (32.1) 21 (26.0) 12 (15.4) (6.4)


↓  Table 3. Association Between Clinicopathological Characteristics and Protein Expression Using Chi-Square Test (FET)
 
Receptor (sub-categories) Clinicopathological parameters Chi-square test (FET)
Number of patients with receptor expression
CD: cluster of differentiation; CLDN18.2: claudin 18.2; EGFRvIII: epidermal growth factor receptor variant III; FET: Fisher’s exact t-test; HER2: human epidermal growth factor receptor 2; wt: wild-type.
Age
< 60 ≥ 60
HER2/CLDN18.2 (≥ 5%) 0 25 0.010 (0.007)
HER2/CLDN18.2 (≥ 10%) 0 19 0.033 (0.032)
HER2/CD109/CLDN18.2 (≥ 5%) 0 20 0.027 (0.030)
Lauren classification
Intestinal type Diffuse/mixed type
HER2/CD44/CLDN18.2 (≥ 5%) 3 10 0.026 (0.034)
T-stage
T1 + T2 T3 + T4
HER2 (intensity 1+) 12 22 0.022 (0.039)
EGFRvIII (≥ 5%) 6 20 0.0008 (0.002)
EGFRvIII (cytoplasmic) 6 19 0.002 (0.003)
EGFRvIII (intensity 1+) 5 15 0.010 (0.018)
HER2/HER4 (≥ 5%) 15 6 0.022 (0.040)
HER2/EGFRvIII (≥ 5%) 6 16 0.012 (0.022)
Vascular invasion
Absent Present
Wt-EGFR (≥ 10%) 1 5 0.001 (0.005)
Wt-EGFR (membranous) 0 3 0.004 (0.017)
EGFRvIII (cytoplasmic) 14 11 0.020 (0.029)
EGFRvIII (intensity 1+) 11 9 0.035 (0.044)
Wt-EGFR/CD109 (≥ 5%) 3 5 0.017 (0.029)
Wt-EGFR/CD109 (≥ 10%) 1 5 0.001 (0.005)
Lymphatic invasion
Absent Present
Wt-EGFR (≥ 5%) 0 10 0.005 (0.004)
Wt-EGFR (cytoplasmic) 0 10 0.005 (0.004)
Wt-EGFR (intensity 1+) 0 8 0.013 (0.018)
EGFRvIII (≥ 5%) 5 21 0.006 (0.007)
EGFRvIII (cytoplasmic) 5 20 0.010 (0.013)
EGFRvIII (intensity 1+) 3 17 0.006 (0.008)
Wt-EGFR/HER2 (≥ 5%) 0 7 0.021 (0.037)
Wt-EGFR/CD109 (≥ 5%) 0 8 0.013 (0.018)
HER2/EGFRvIII (≥ 5%) 4 18 0.010 (0.011)
HER4/EGFRvIII (≥ 5%) 0 7 0.021 (0.037)
Perineural invasion
Absent Present
CLDN18.2 (≥ 20%) 7 10 0.026 (0.043)
Grade
< G3 G3
HER2 (membranous) 7 3 0.002 (0.004)
HER2 (intensity 1+) 5 29 0.020 (0.024)
CD109 (≥ 10%) 17 27 0.020 (0.024)
CD109 (membranous) 10 7 0.002 (0.004)
HER2/CD109 (≥ 5%) 16 22 0.008 (0.011)
HER2/CD109 (≥ 10%) 16 18 0.001 (0.002)


↓  Table 4. Association Between Expression of HER Family Members and Overall Survival in Univariate and Multivariate Analysis
 
Expression Univariate Multivariate
Hazard ratio 95% CI P-value Hazard ratio 95% CI P-value
CD: cluster of differentiation; CI: confidence interval; CLDN18.2: claudin 18.2; EGFRvIII: epidermal growth factor receptor variant III; HER2: human epidermal growth factor receptor 2; NS: non-significant.
EGFRvIII intensity 1+ NS NS
CD109 membranous 2.04 1.02 - 4.07 0.042 2.27 1.06 - 3.87 0.022
CLDN18.2 intensity 3+ 2.36 0.90 - 5.65 0.050 2.62 1.09 - 3.87 0.031
HER2/EGFRvIII ≥ 5% 1.89 1.02 - 3.49 0.041 1.96 1.06 - 3.65 0.031
HER2/EGFRvIII ≥ 10% 2.24 1.06 - 4.73 0.033 2.45 1.15 - 5.21 0.020
EGFRvIII/CD44 ≥ 5% 2.97 1.33 - 6.61 0.008 2.97 1.33 - 6.61 0.008
CD109/CLDN18.2 ≥ 20% 2.16 1.05 - 4.43 0.035 2.06 1.00 - 4.25 0.048
HER2/EGFRvIII/CD44 ≥ 5% 2.68 1.16 - 6.20 0.021 2.68 1.16 - 6.20 0.021
EGFRvIII/CD44/CD109 ≥ 5% 4.21 1.79 - 9.98 0.0009 4.21 1.79 - 9.98 0.0009