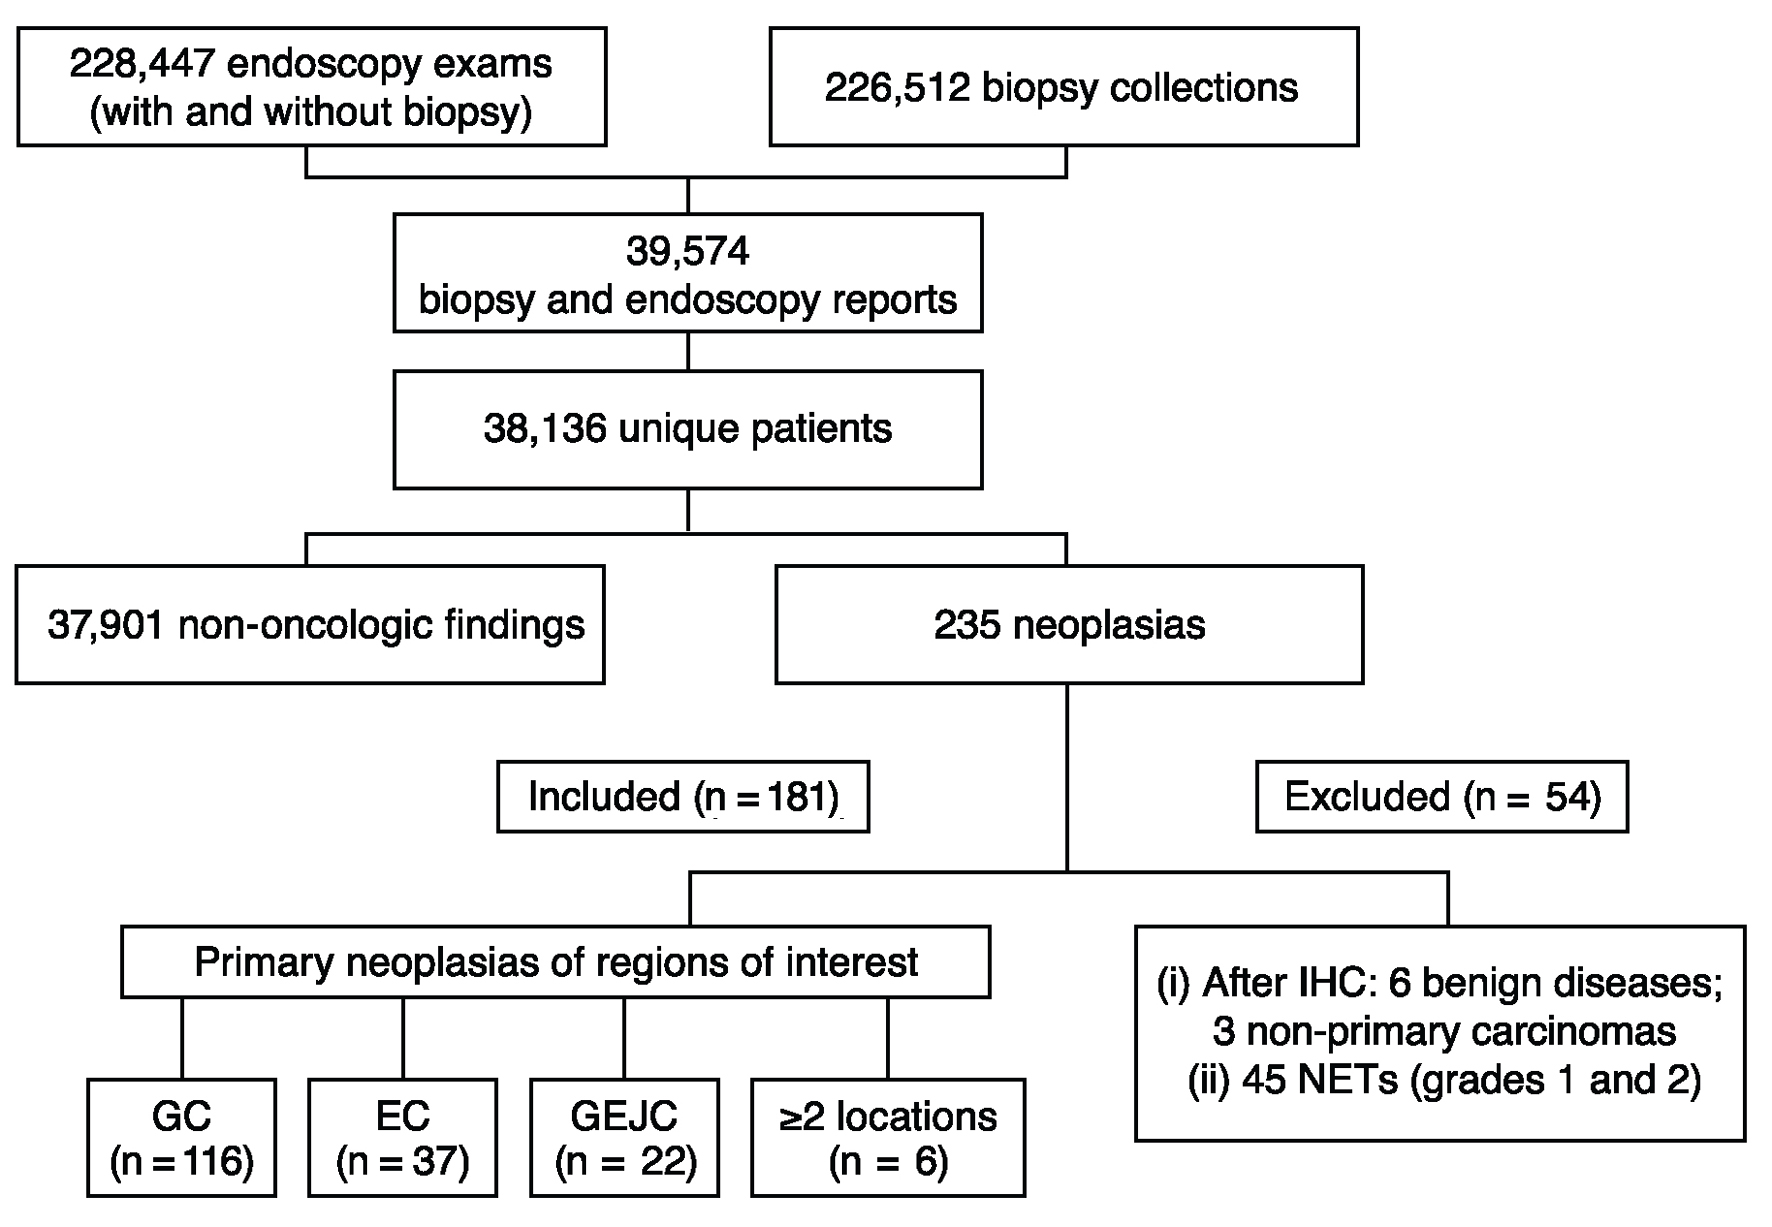
↓ Figure 1. Flowchart of data extraction and
filtering. EC: esophageal cancer; GC: gastric cancer; GEJC: gastroesophageal junction cancer; IHC:
immunohistochemistry; NET: neuroendocrine tumor.
| World Journal of Oncology, ISSN 1920-4531 print, 1920-454X online, Open Access |
| Article copyright, the authors; Journal compilation copyright, World J Oncol and Elmer Press Inc |
| Journal website https://wjon.elmerpub.com |
Original Article
Volume 17, Number 1, February 2026, pages 25-33
Proportional Frequency and Clinical Characteristics of Gastric, Esophageal, and Gastroesophageal Junction Cancers in a Private Medical Group in Brazil
Figure
Tables
| Characteristic | GC (n = 116) | EC (n = 37) | GEJC (n = 22) | ≥ 2 locations (n = 6) | P value |
|---|---|---|---|---|---|
| aFor continuous variables, P values were obtained using the Kruskal-Wallis test. bFor categorical variables, P values were obtained using the Chi-square test. EC: esophageal cancer; GC: gastric cancer; GEJC: gastroesophageal junction cancer; HER2: human epidermal growth factor receptor 2; IQR: interquartile range; MMR: mismatch repair; MSI: microsatellite instability. | |||||
| Age at diagnosis, years, median (IQR) | 72 (60 - 79) | 65 (59 - 74) | 65 (59 - 76) | 64 (62 - 65) | 0.200a |
| Age category at diagnosis, n (%) | 0.120a | ||||
| < 40 years | 8 (6.9) | 0 (0) | 1 (4.5) | 0 (0) | |
| 40 - 49 years | 4 (3.4) | 5 (13.5) | 2 (9.1) | 1 (16.7) | |
| 50 - 59 years | 16 (13.8) | 5 (13.5) | 3 (13.6) | 0 (0) | |
| 60 - 69 years | 27 (23.3) | 10 (27.0) | 7 (31.8) | 4 (66.7) | |
| 70 - 79 years | 34 (29.3) | 15 (40.5) | 6 (27.3) | 1 (16.7) | |
| ≥ 80 years | 27 (23.3) | 2 (5.4) | 3 (13.6) | 0 (0) | |
| Sex, n (%) | 0.057b | ||||
| Male | 62 (53.4) | 27 (73.0) | 17 (77.3) | 4 (66.7) | |
| Female | 54 (46.6) | 10 (27.0) | 5 (22.7) | 2 (33.3) | |
| Geographic region (state), n (%) | 0.600b | ||||
| Sao Paulo | 108 (93.1) | 36 (97.3) | 21 (95.5) | 5 (83.3) | |
| Rio de Janeiro | 2 (1.7) | 1 (2.7) | 1 (4.5) | 0 (0) | |
| Goias | 1 (0.9) | 0 (0) | 0 (0) | 0 (0) | |
| Distrito Federal | 5 (4.3) | 0 (0) | 0 (0) | 1 (16.7) | |
| Helicobacter pylori status, n (%) | 0.059b | ||||
| Positive | 13 (11.2) | 3 (8.1) | 3 (13.6) | 0 (0) | |
| Negative | 39 (33.6) | 5 (13.5) | 2 (9.1) | 1 (16.7) | |
| Not performed | 64 (55.2) | 29 (78.4) | 17 (77.3) | 5 (83.3) | |
| Biomarker (HER2, MMR/MSI) evaluation performed, n (%) | 28 (24.1) | 3 (8.1) | 2 (9.1) | 0 (0) | 0.065b |
| Lauren classification, n (%) | GC (n = 116) | GEJC (n = 22) | ≥ 2 locations (n = 6) |
|---|---|---|---|
| aIntestinal type included NOS adenocarcinoma, tubular adenocarcinoma, and mucinous adenocarcinoma with intestinal phenotype. bDiffuse type included only poorly cohesive carcinoma. GC: gastric cancer; GEJC: gastroesophageal junction cancer; NOS: not otherwise specified. | |||
| Intestinal typea | 68 (58.6) | 18 (81.8) | 4 (66.7) |
| Diffuse typeb | 34 (29.3) | 2 (9.1) | 1 (16.7) |
| Mixed type | 14 (12.1) | 2 (9.1) | 1 (16.7) |
| Histologic type, n (%) | EC (n = 37) |
|---|---|
| EC: esophageal cancer. | |
| Adenocarcinoma | 21 (56.8) |
| Squamous cell carcinoma | 15 (40.5) |
| Small cell carcinoma | 1 (2.7) |
| Diagnosis | Total patients, n | HER2 | MMR | ||
|---|---|---|---|---|---|
| Patients tested, n (%) | HER2-positivea, n (%) | Patients tested, n (%) | MMR deficienta, n (%) | ||
| aAmong patients tested. bFor one case, a fluorescence in situ hybridization test was not performed at the institution, so the results were considered uncertain. cFor one case, a retest for an equivocal result was not performed at the institution, so the results were considered uncertain. EC: esophageal cancer; GC: gastric cancer; GEJC: gastroesophageal junction cancer; HER2: human epidermal growth factor receptor 2; IHC: immunohistochemistry; MMR: mismatch repair. | |||||
| GC | 116 | 28b (24.1) | 2 (7.1) | 28c (24.1) | 2 (7.1) |
| EC | 37 | 3 (8.1) | 1 (33.3) | 3 (8.1) | 0 (0) |
| GEJC | 22 | 2 (9.1) | 1 (50.0) | 2 (9.1) | 0 (0) |