Figures
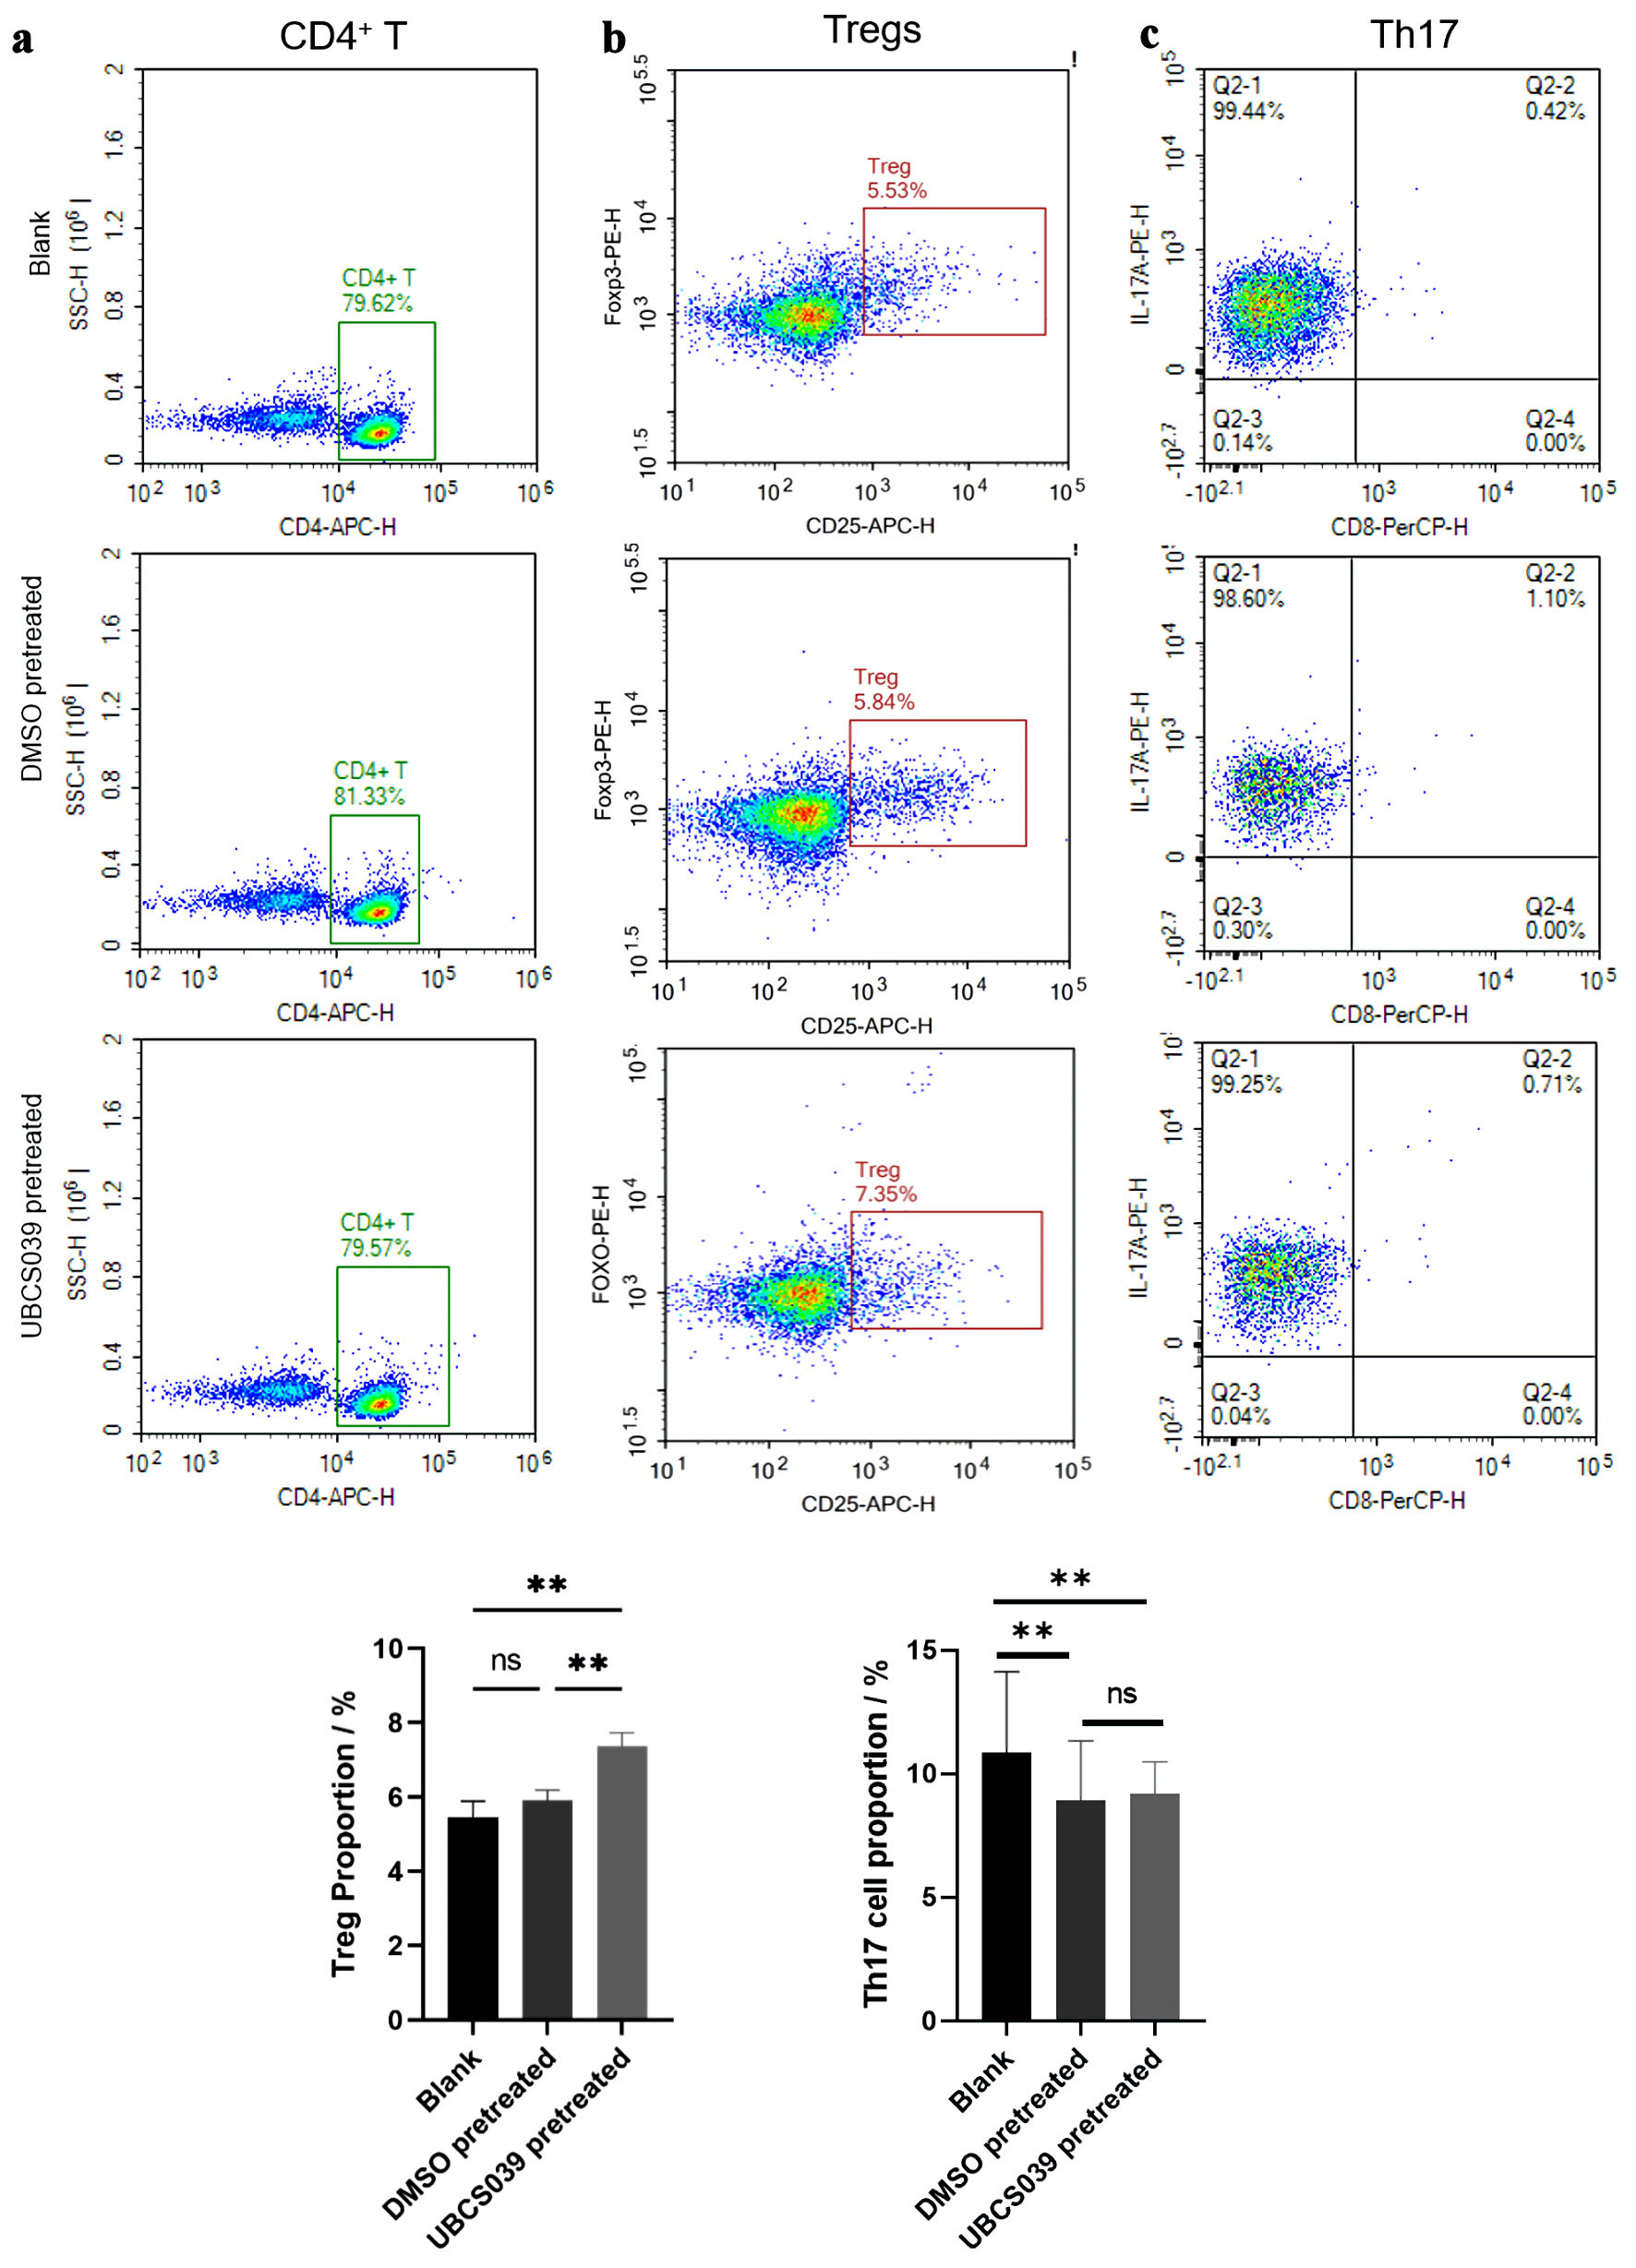
↓ Figure 1. The effect of UBCS039-pretreated
SMMC-7721 cells on CD4+ T-cell differentiation. SMMC-7721 cells were treated with UBCS039 or
DMSO or left untreated. The proportions of CD4+ T cells (a), Tregs (b), and Th17 cells (c)
among the cocultured cells were examined via flow cytometry. The proportions of Tregs
(CD4+CD25+FoxP3+) were significantly elevated in CD4+ T
cells following coculture with UBCS039-pretreated SMMC-7721 cells. **P < 0.01. Tregs: regulatory T
cells; ns: not significant; DMSO: dimethyl sulfoxide; Th17: T helper 17.
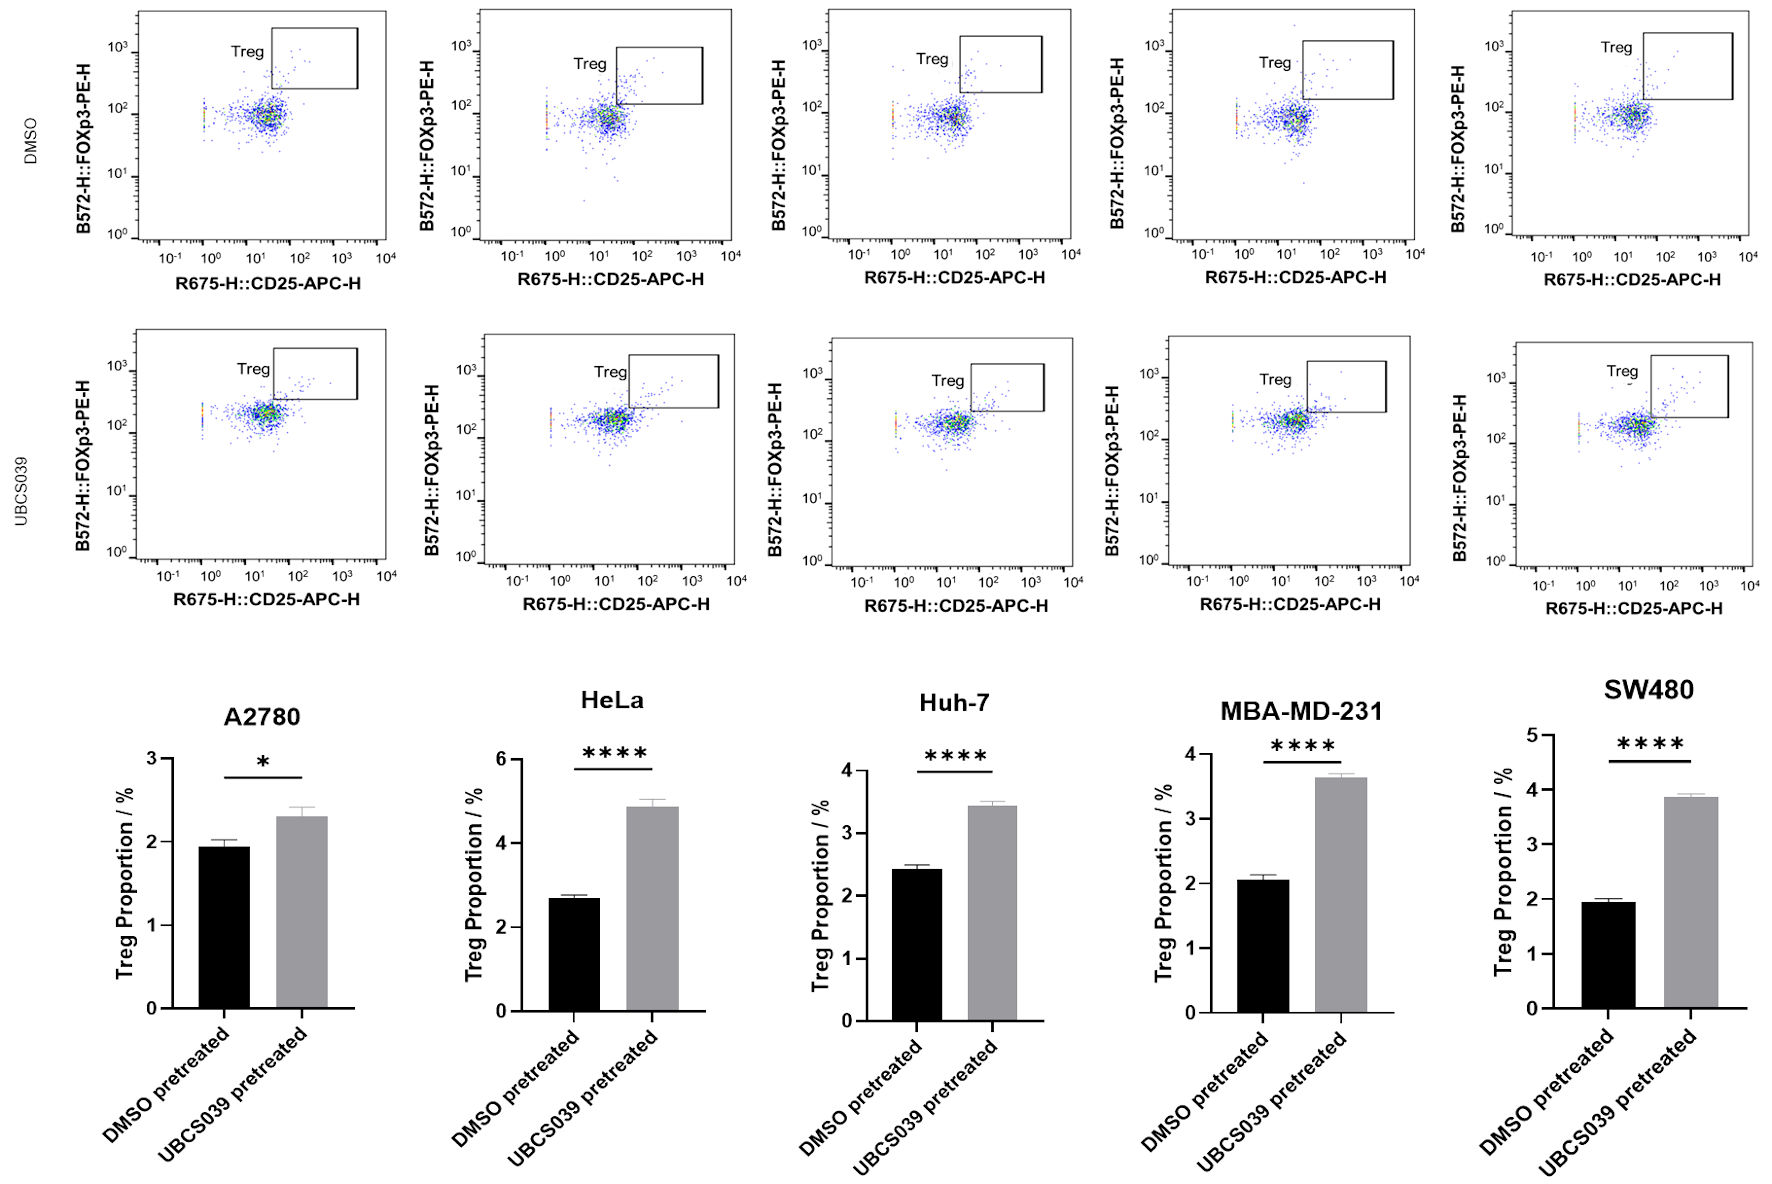
↓ Figure 2. Effects of UBCS039-pretreated A2780,
HeLa, Huh7, MBA-MD-231 and SW480 cells on CD4+ T-cell differentiation. These tumor cells were
treated with UBCS039 or DMSO. The proportions of Tregs among the cocultured cells were examined via flow
cytometry. The proportions of Tregs in CD4+ T cells were significantly elevated following
coculture with UBCS039-pretreated tumor cells. *P < 0.05, ****P < 0.0001. Tregs: regulatory T
cells; ns: not significant; DMSO: dimethyl sulfoxide.
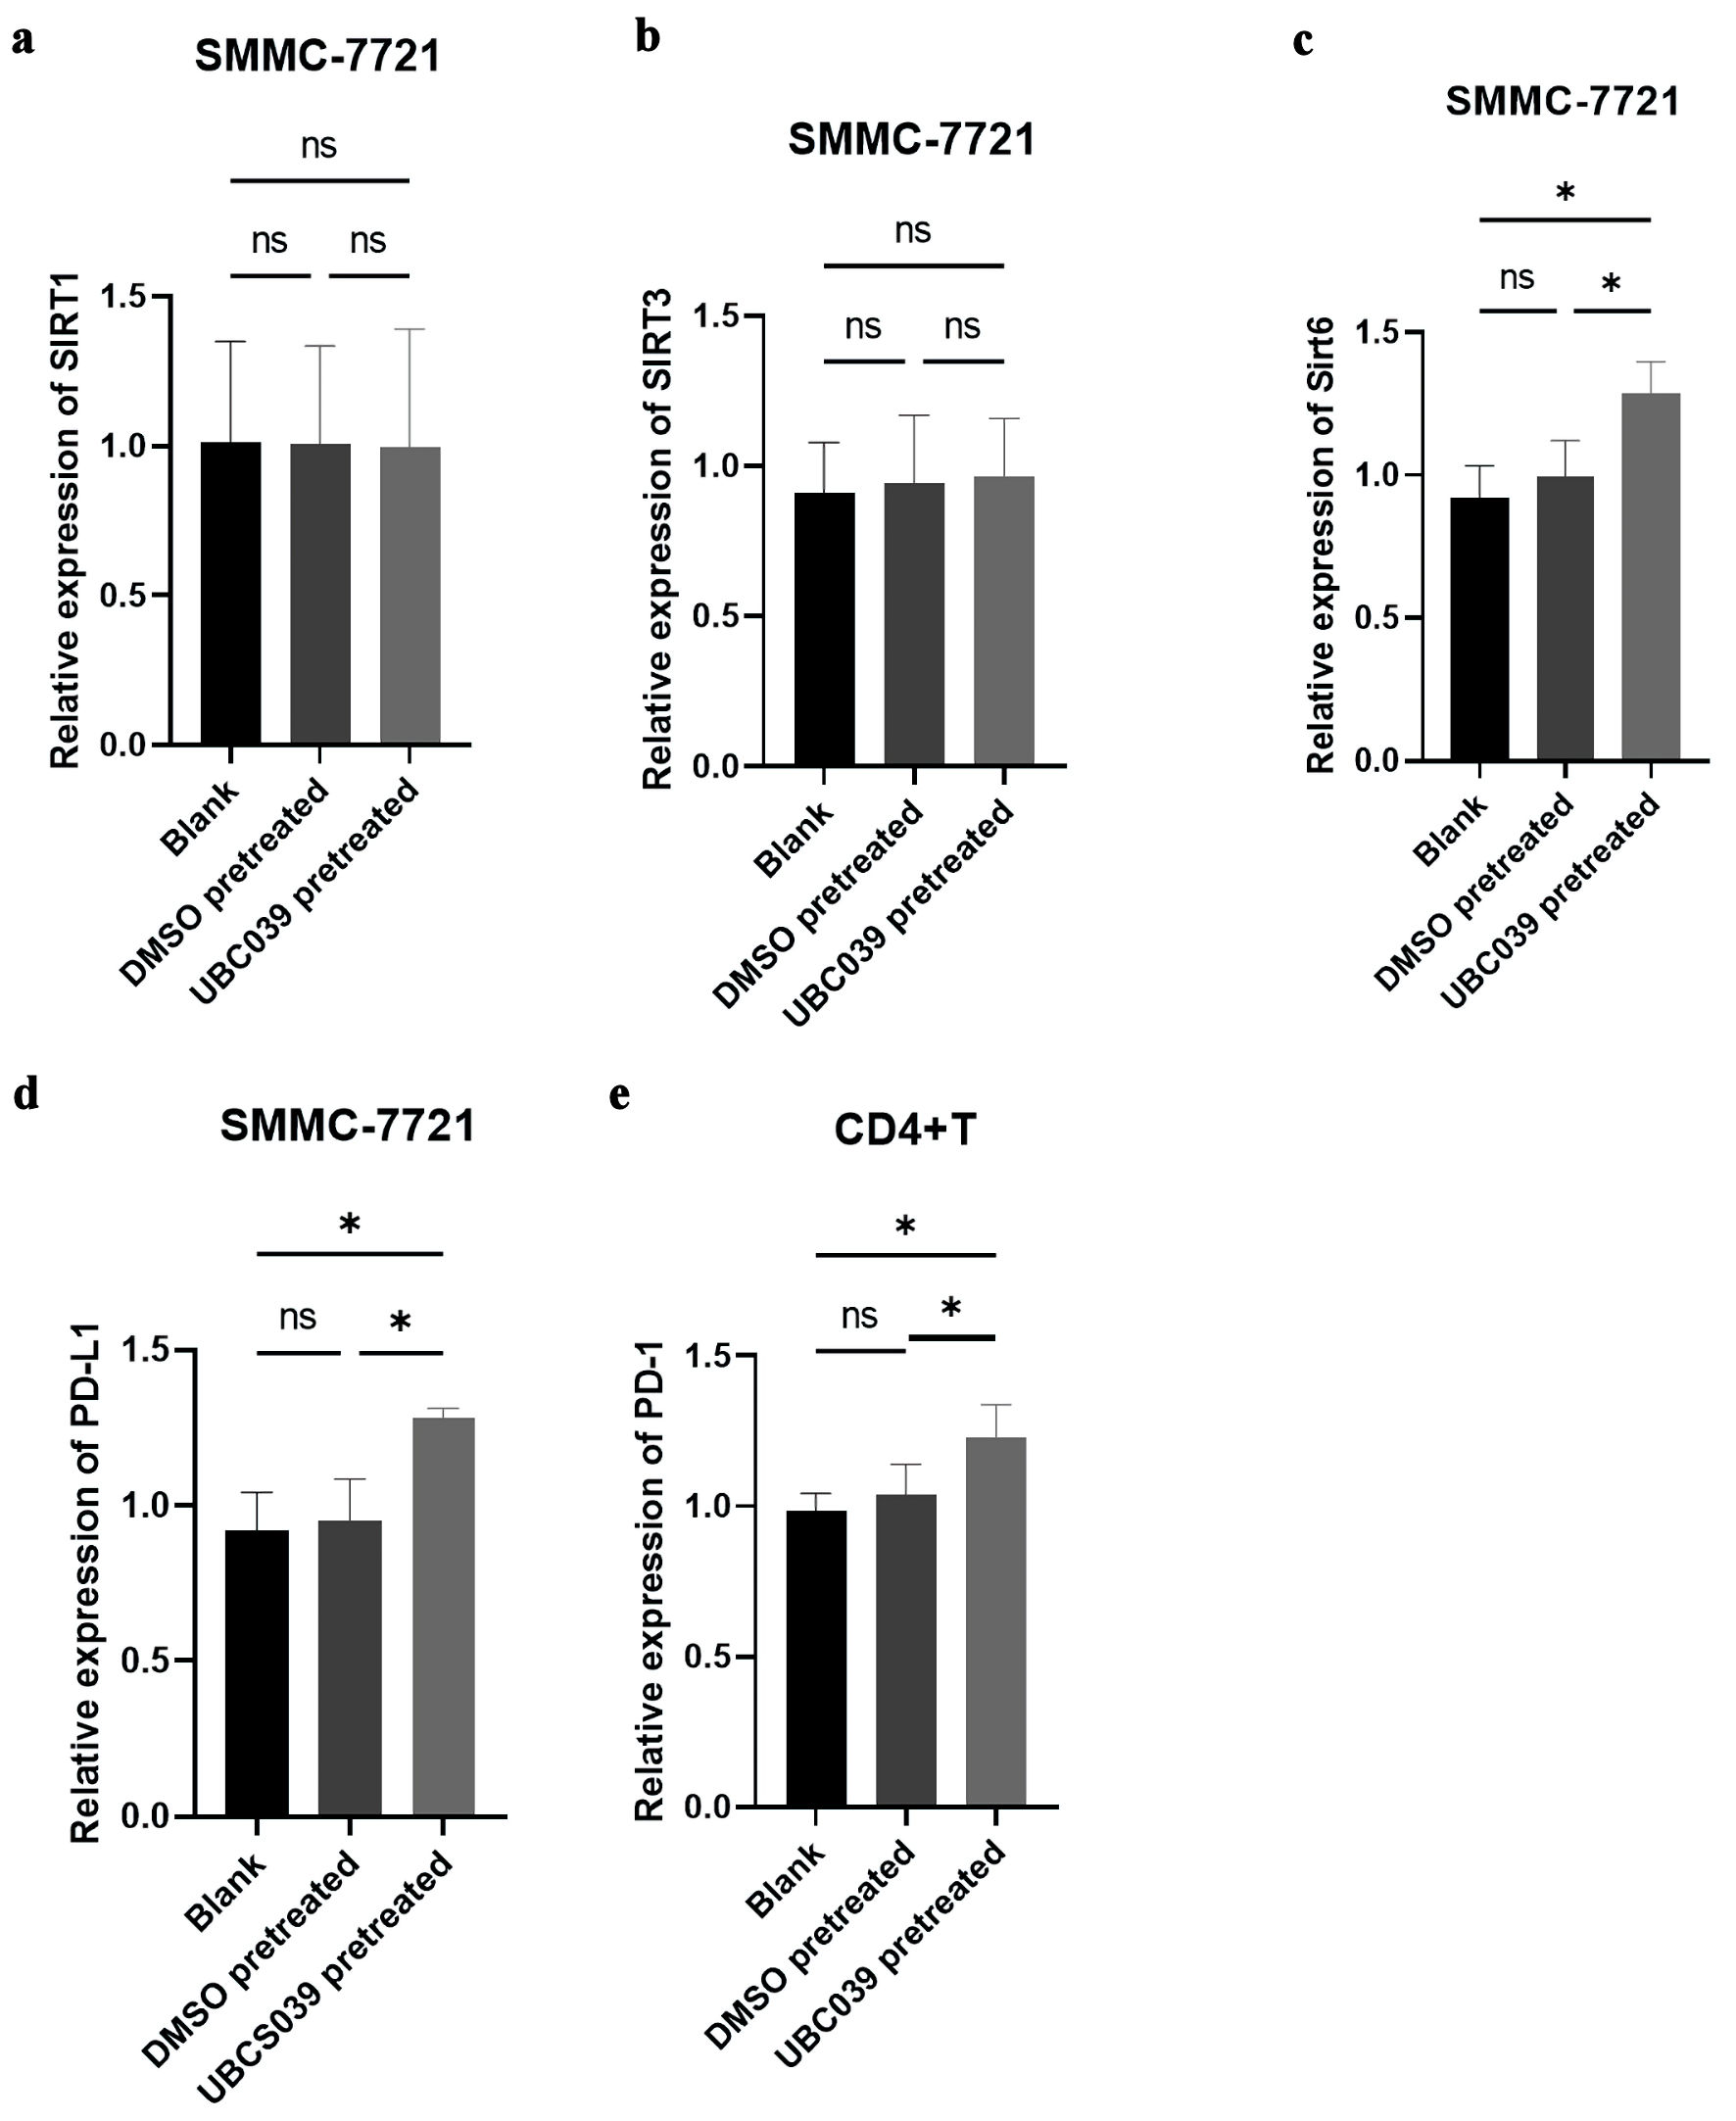
↓ Figure 3. Expression of several key genes in
cocultured UBCS039-pretreated SMMC-7721 cells and CD4+ T cells. The mRNA levels of (a) Sirt1,
(b) Sirt3, (c) Sirt6, and (d) PD-L1 in SMMC-7721 cells and the mRNA level of (e) PD-1 in CD4+
T cells were determined via real-time PCR. Sirt6 and PD-L1 expression was significantly increased in
SMMC-7721 cells treated with UBCS039, and PD-1 expression was significantly increased in CD4+
T cells cocultured with UBCS039-pretreated SMMC-7721 cells. *P < 0.05. Sirt: sirtuin; PD-1:
programmed cell death protein-1; PD-L1: programmed cell death-ligand 1; PCR: polymerase chain reaction;
ns: not significant.
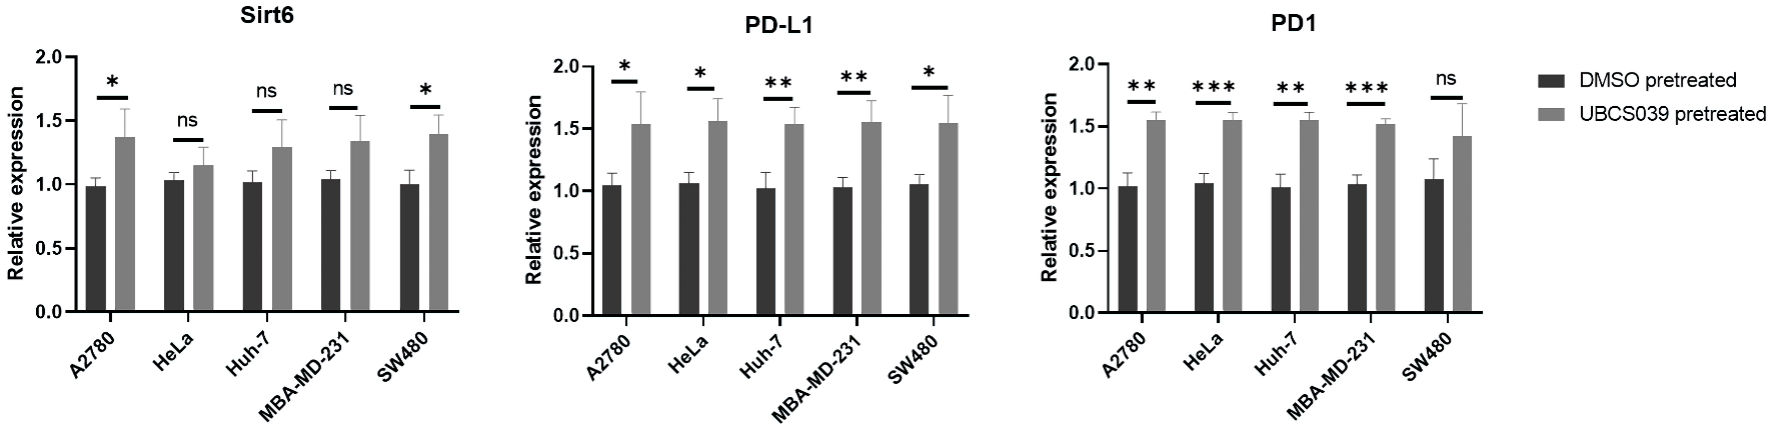
↓ Figure 4. Expression of several key genes in
cocultured UBCS039-pretreated A2780, HeLa, Huh7, MBA-MD-231 and SW480 cells and CD4+ T cells.
The mRNA levels of Sirt6 (a) and PD-L1 (b) in tumor cells and the mRNA level of PD-1 (c) in
CD4+ T cells were determined via real-time PCR. Sirt6 and PD-L1 expressions were
significantly increased in tumor cells pretreated with UBCS039, and PD-1 expression was significantly
increased in CD4+ T cells cocultured with UBCS039-pretreated tumor cells. *P < 0.05, **P
< 0.01, and ***P < 0.001. Sirt: sirtuin; PD-1: programmed cell death protein-1; PD-L1: programmed
cell death-ligand 1; PCR: polymerase chain reaction; ns: not significant.
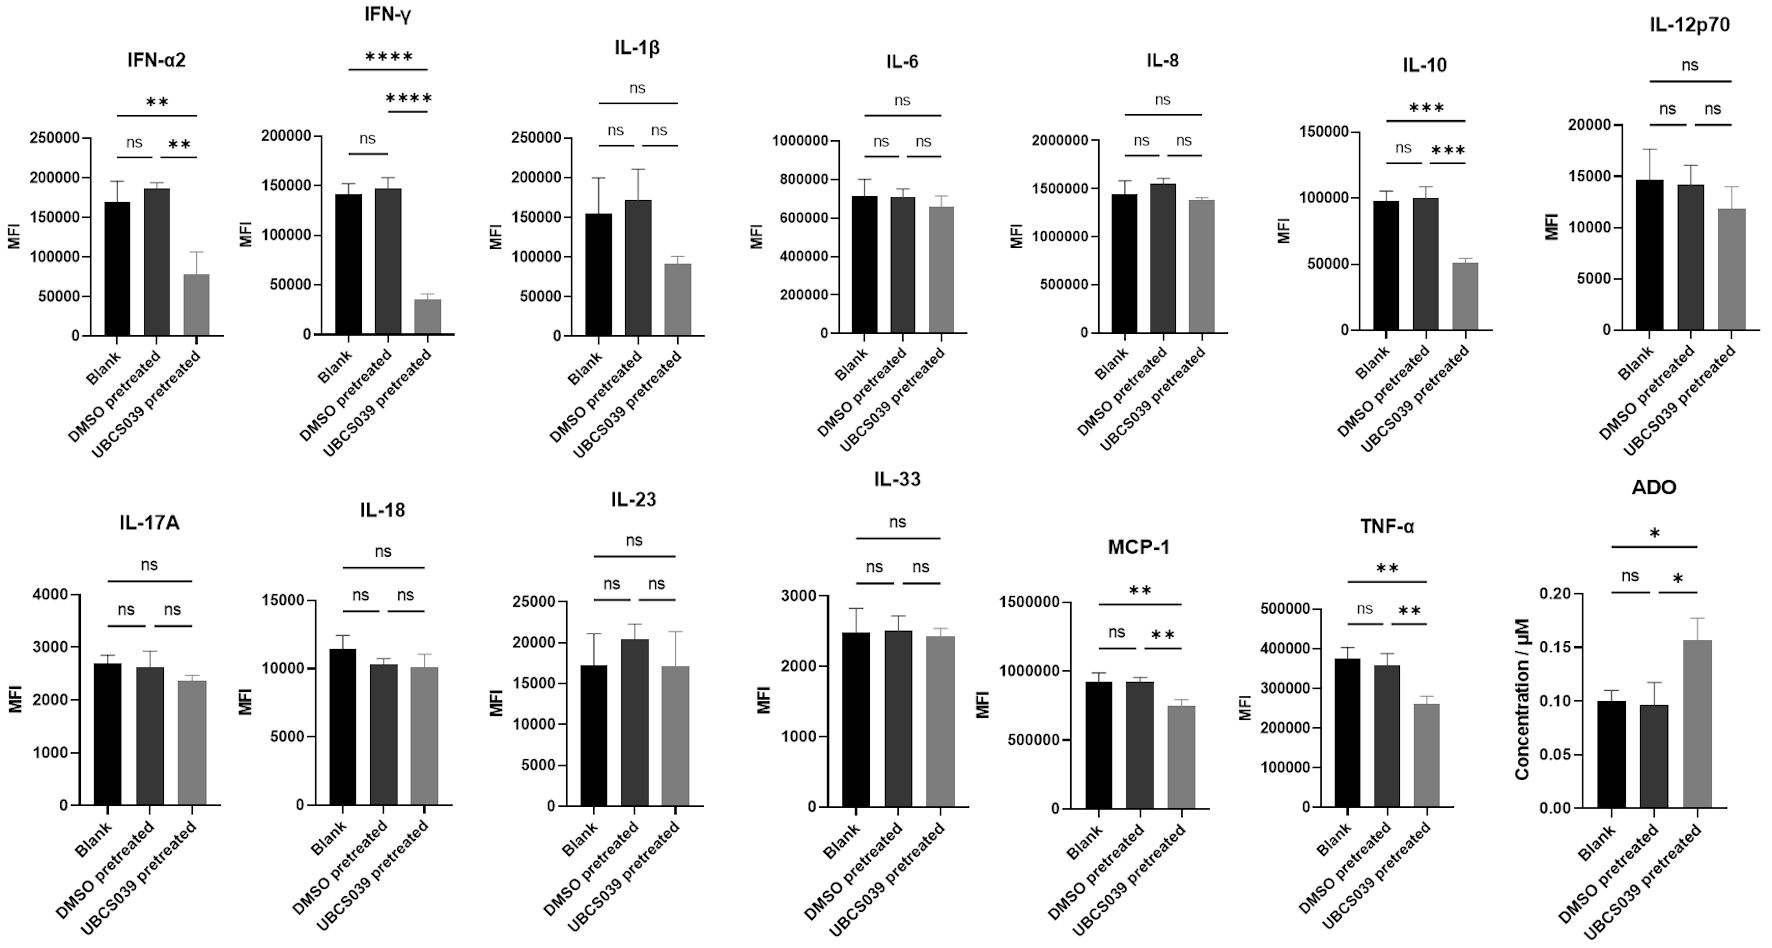
↓ Figure 5. Cytokine levels in the supernatants
of cocultures containing SMMC-7721 cells and CD4+ T cells. SMMC-7721 cells were treated with
UBCS039 or DMSO or left untreated. The pretreated SMMC-7721 cells were then cocultured with
CD4+ T cells. The culture medium was assessed via flow cytometry. The ADO level in the
culture medium was determined via ELISA. IFN-α2, IFN-γ, IL-10, MCP-1 and TNF-α levels
were lower in the culture media of cocultures containing UBCS039-pretreated SMMC-7721 cells and
CD4+ T cells, and ADO levels were significantly greater in the coculture media. *P < 0.05,
**P < 0.01, ***P < 0.001, and ****P < 0.0001. MFI: mean fluorescence intensity; IL:
interleukin; IFN: interferon; ADO: adenosine; ELISA: enzyme-linked immunosorbent assay; MCP-1: monocyte
chemoattractant protein-1; TNF: tumor necrosis factor; DMSO: dimethyl sulfoxide.
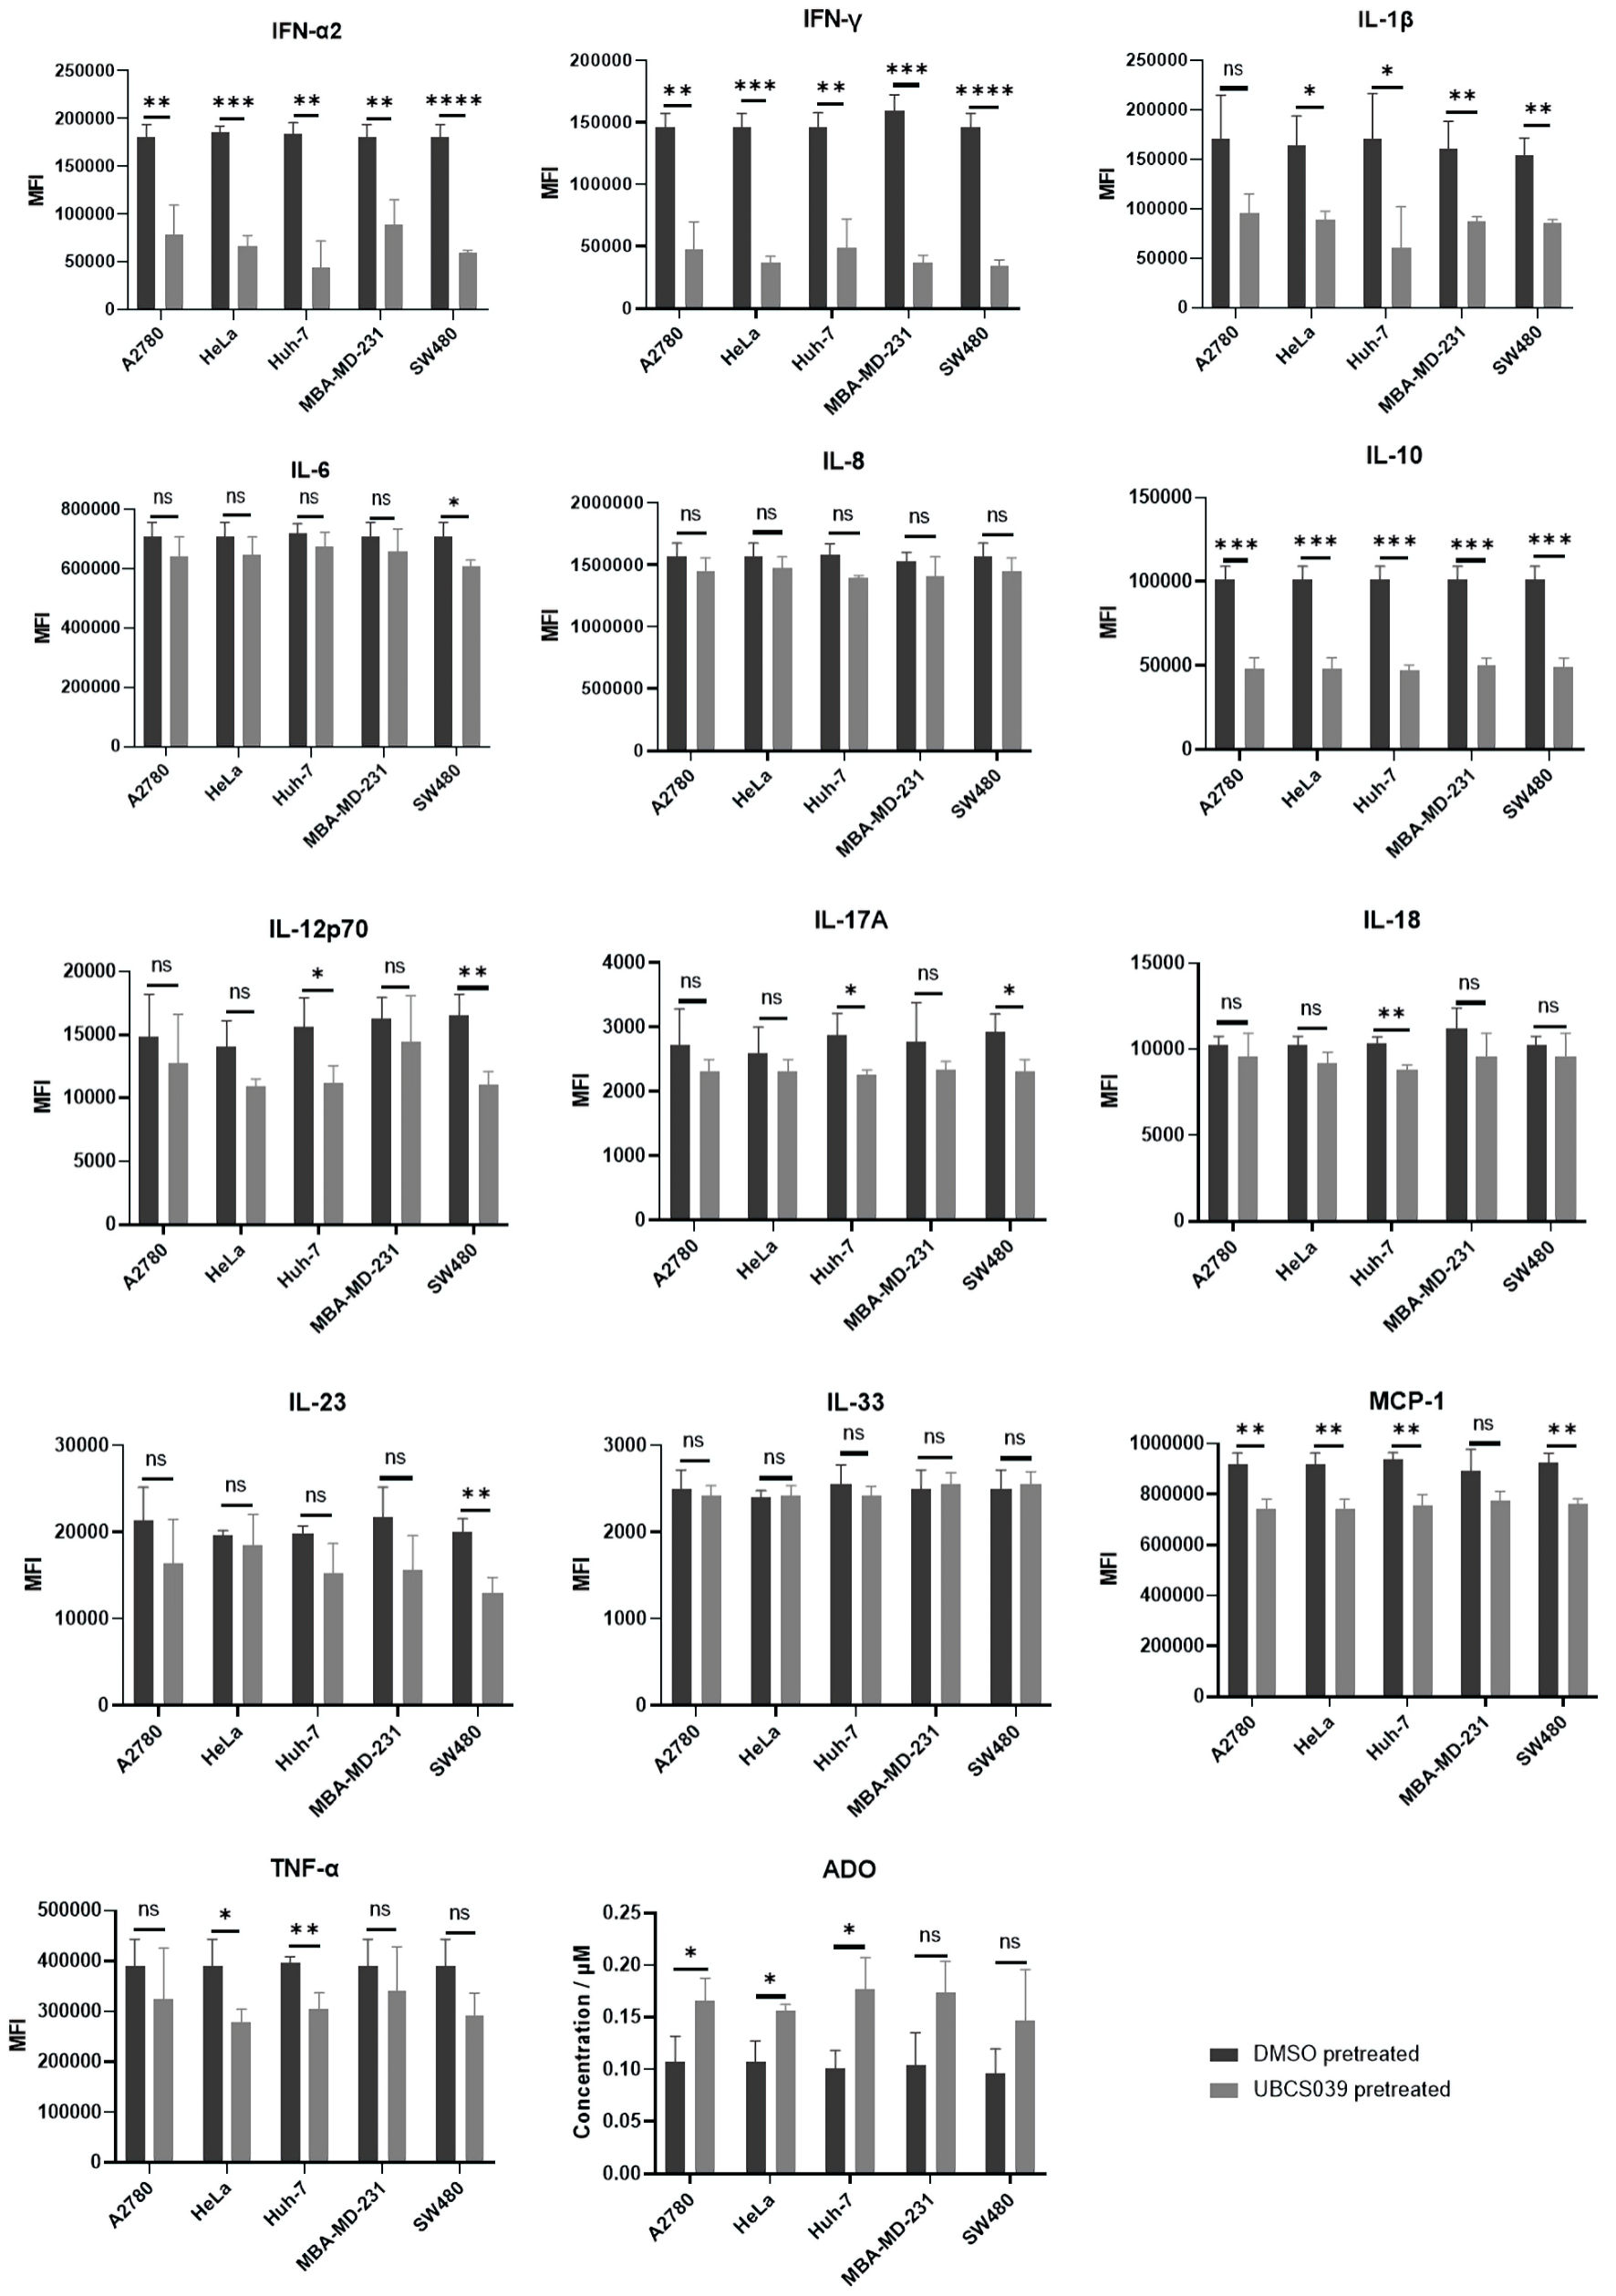
↓ Figure 6. Cytokine levels in the supernatants
of cocultures containing CD4+ T cells and A2780, HeLa, Huh7, MBA-MD-231 or SW480 cells. These
tumor cells were pretreated with UBCS039 or DMSO. The pretreated tumor cells were then cocultured with
CD4+ T cells. The culture medium was assessed via flow cytometry. The ADO level in the
culture medium was determined via ELISA. The levels of IFN-α2, IFN-γ and IL-10 were lower in
the culture media of cocultures containing UBCS039-pretreated tumor cells and CD4+ T cells,
and the ADO levels were significantly greater in the coculture media of CD4+ T cells and
UBCS039-pretreated A2780, HeLa and Huh-7 cells. *P < 0.05, **P < 0.01, ***P < 0.001, and ****P
< 0.0001. MFI: mean fluorescence intensity; IL: interleukin; IFN: interferon; ADO: adenosine; ELISA:
enzyme-linked immunosorbent assay; MCP-1: monocyte chemoattractant protein-1; TNF: tumor necrosis
factor; DMSO: dimethyl sulfoxide.
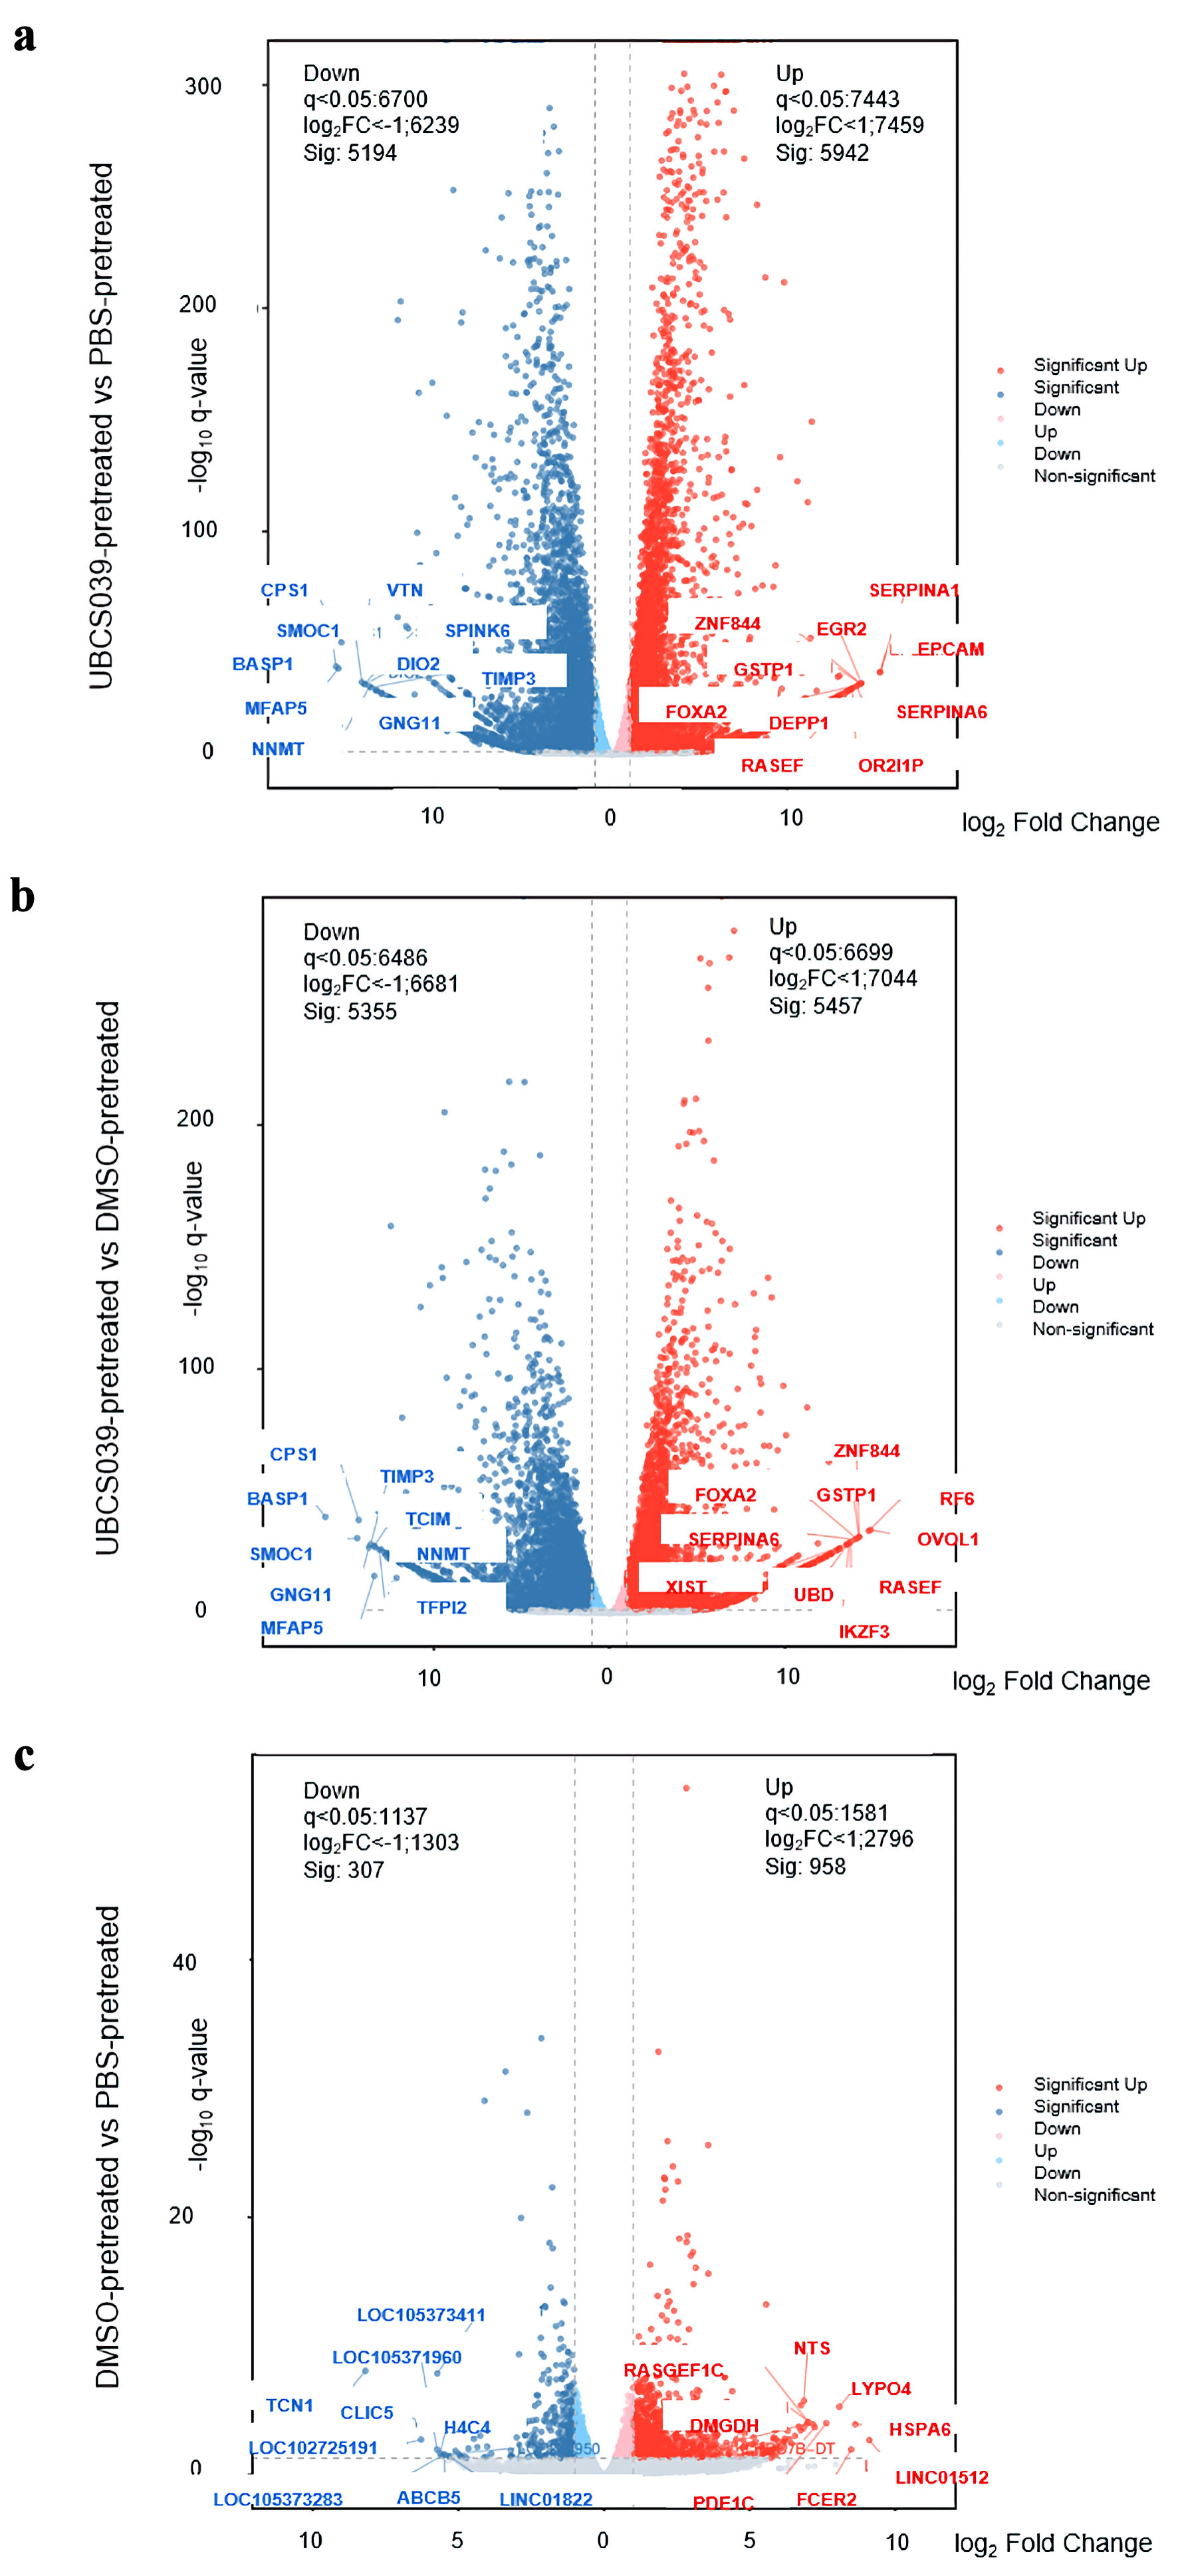
↓ Figure 7. Transcriptome analysis of
UBCS039-pretreated SMMC-7721 cells. Volcano plots were generated by plotting the log (base 2) of the
fold change (FC) and P values of the t test results (base 10) between the UBCS039-pretreated
SMMC-7721 cells and the untreated SMMC-7721 cells (a), UBCS039-pretreated SMMC-7721 cells and
DMSO-pretreated SMMC-7721 cells (b), and DMSO-pretreated SMMC-7721 cells and SMMC-7721 cells without
treatment (c). The analysis revealed significant changes in the gene expression profile of SMMC-7721
cells following UBCS039 treatment. DMSO: dimethyl sulfoxide.
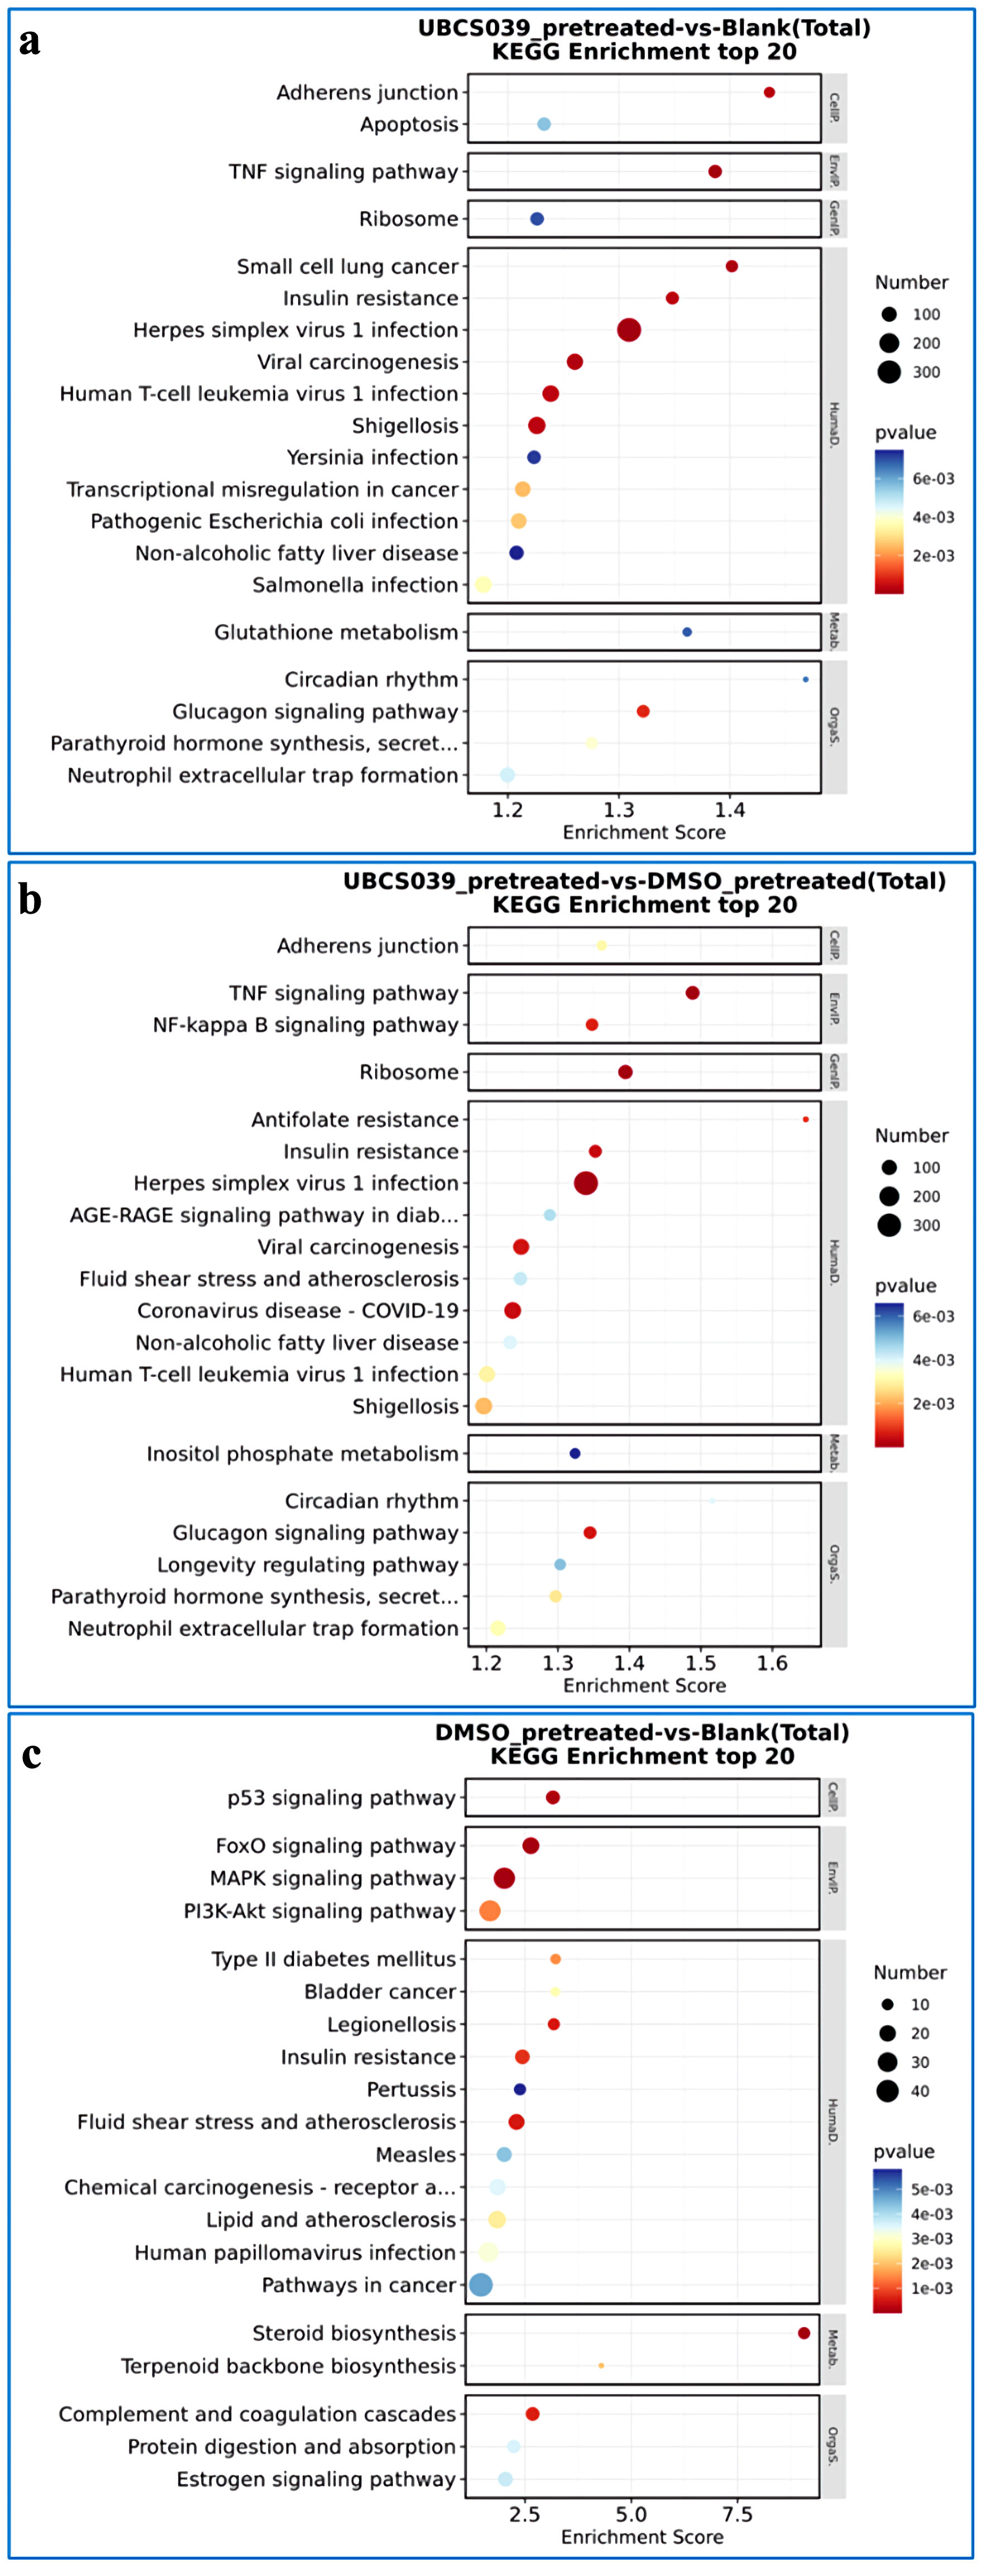
↓ Figure 8. KEGG enrichment analysis of
UBCS039-pretreated SMMC-7721 cells. KEGG enrichment analysis was performed based on DEGs between
UBCS039-pretreated SMMC-7721 cells and untreated SMMC-7721 cells (a), UBCS039-pretreated SMMC-7721 cells
and DMSO-pretreated SMMC-7721 cells (b), and DMSO-pretreated SMMC-7721 cells and untreated SMMC-7721
cells (c). The analysis revealed some significant changes in regulatory pathways in SMMC-7721 cells
following UBCS039 treatment. KEGG: Kyoto Encyclopedia of Genes and Genomes; DEGs: differentially
expressed genes; DMSO: dimethyl sulfoxide.