Figures
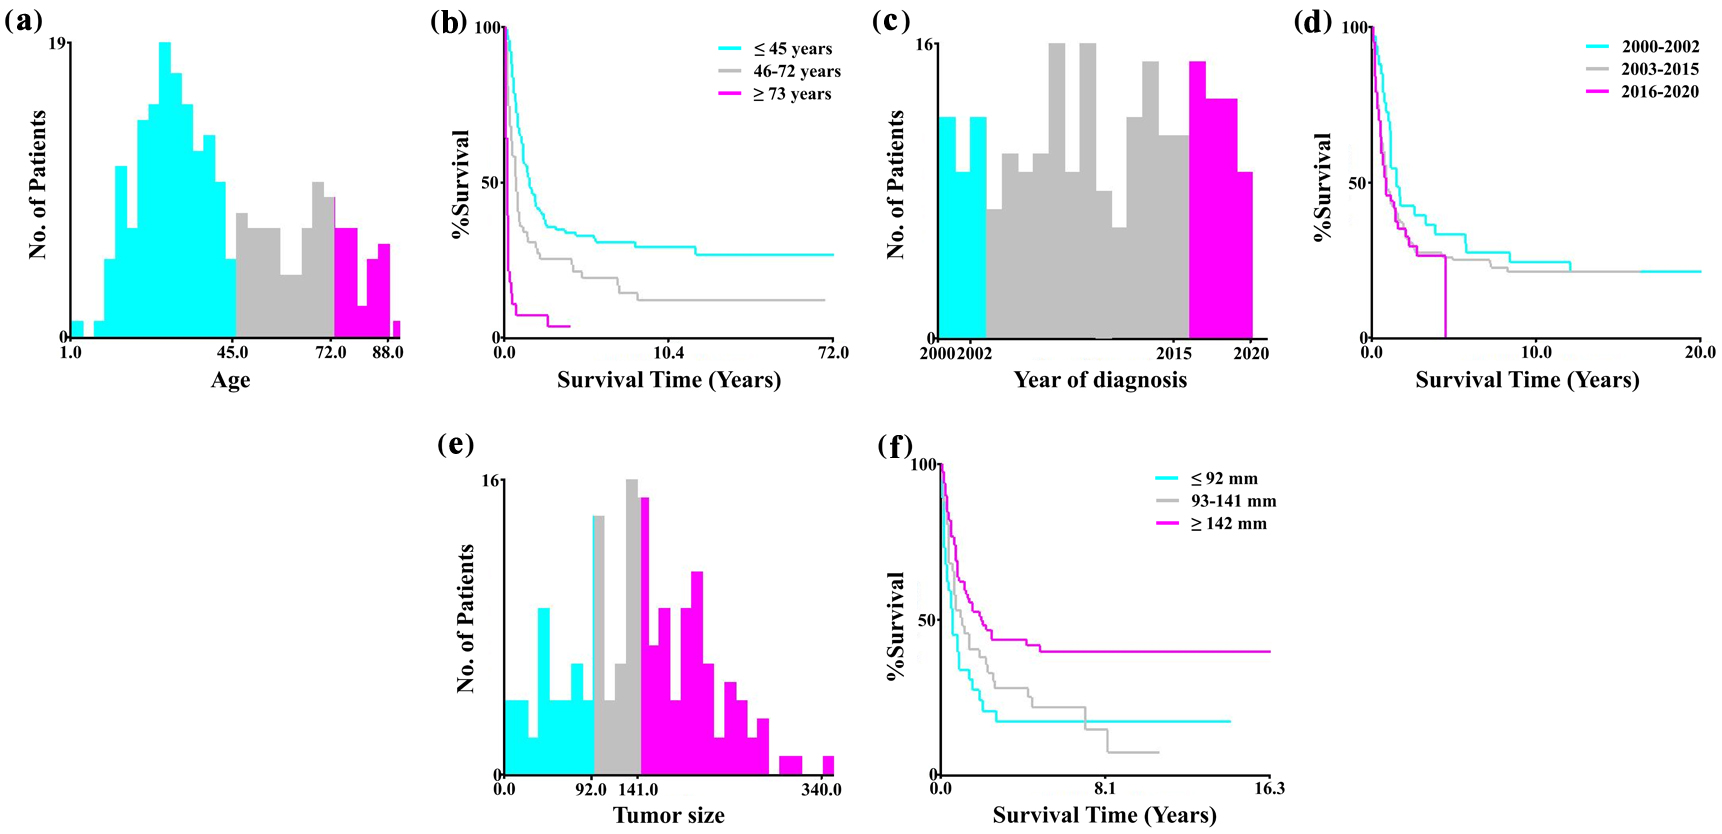
↓ Figure 1. Optimal cutoff values for age, year
of diagnosis, and tumor size using X-tile software analysis. (a, b) The optimal cutoff values of the
variable age were 45 and 72 years. (c, d) The optimal cutoff values of the variable year of diagnosis
were 2002 and 2015. (e, f) The optimal cutoff values of tumor size were 92 and 141 mm.
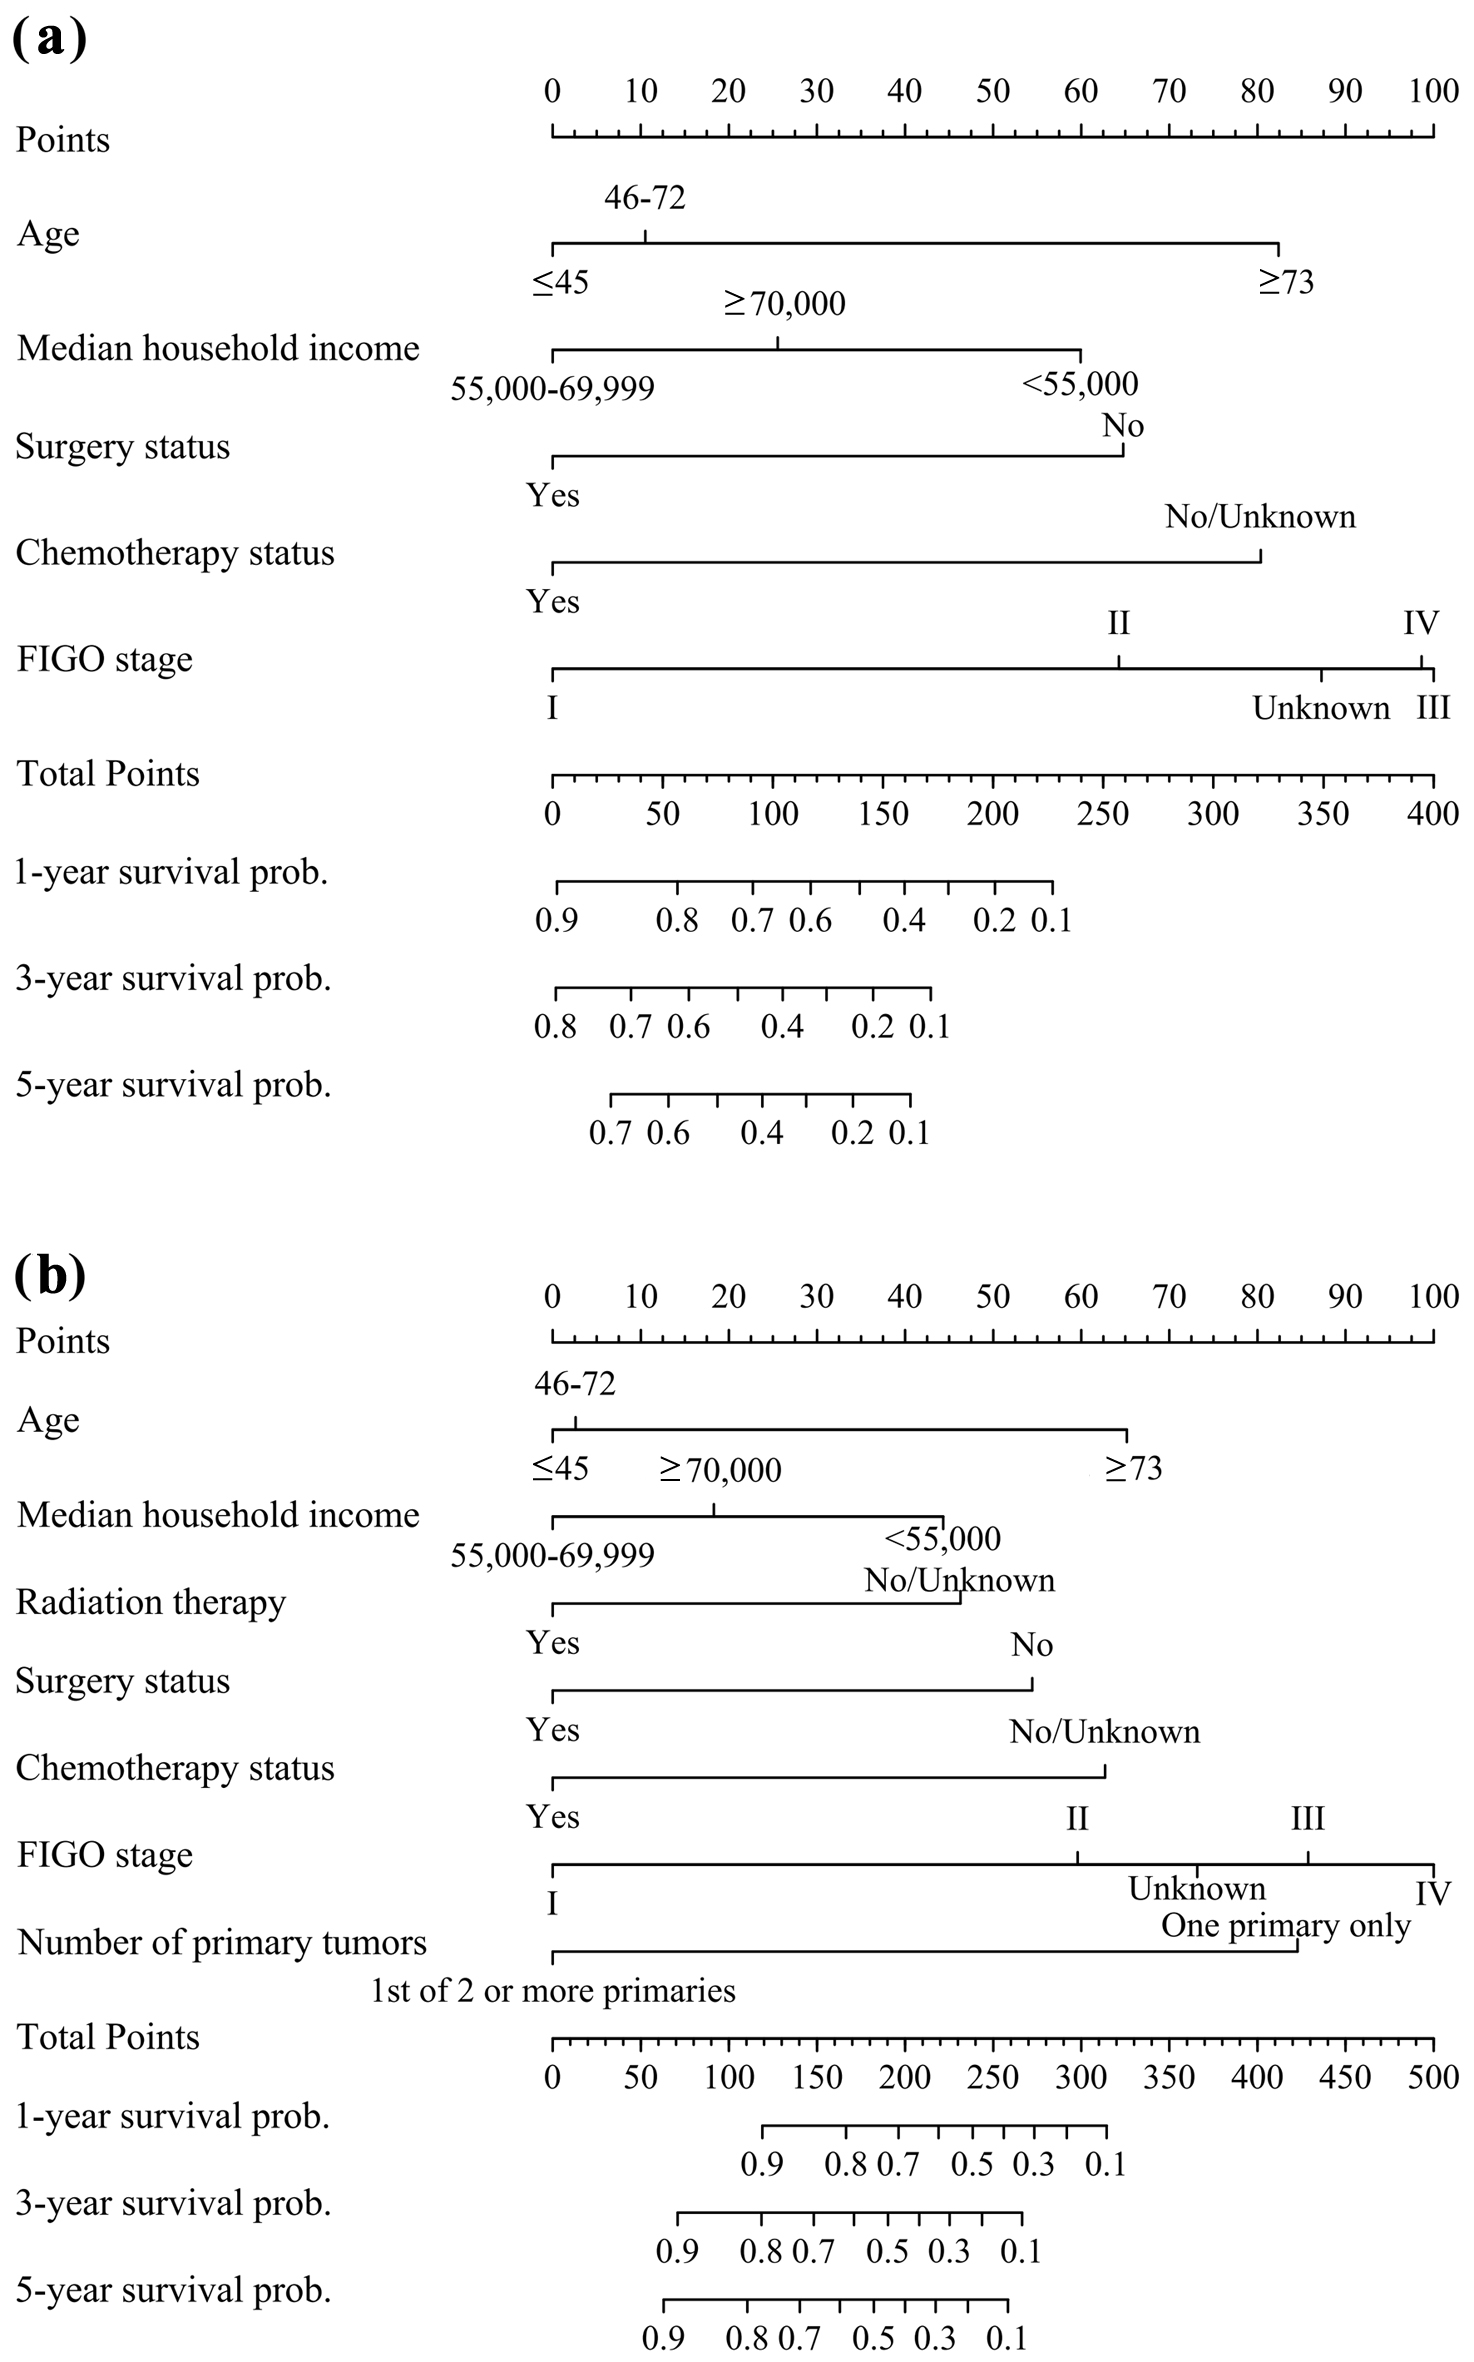
↓ Figure 2. Nomograms for predicting 1-, 3-, and
5-year survival of SCCO patients: (a) overall survival; (b) cancer-specific survival. SCCO: small cell
carcinoma of ovary; FIGO: Federation International of Gynecology and Obstetrics.
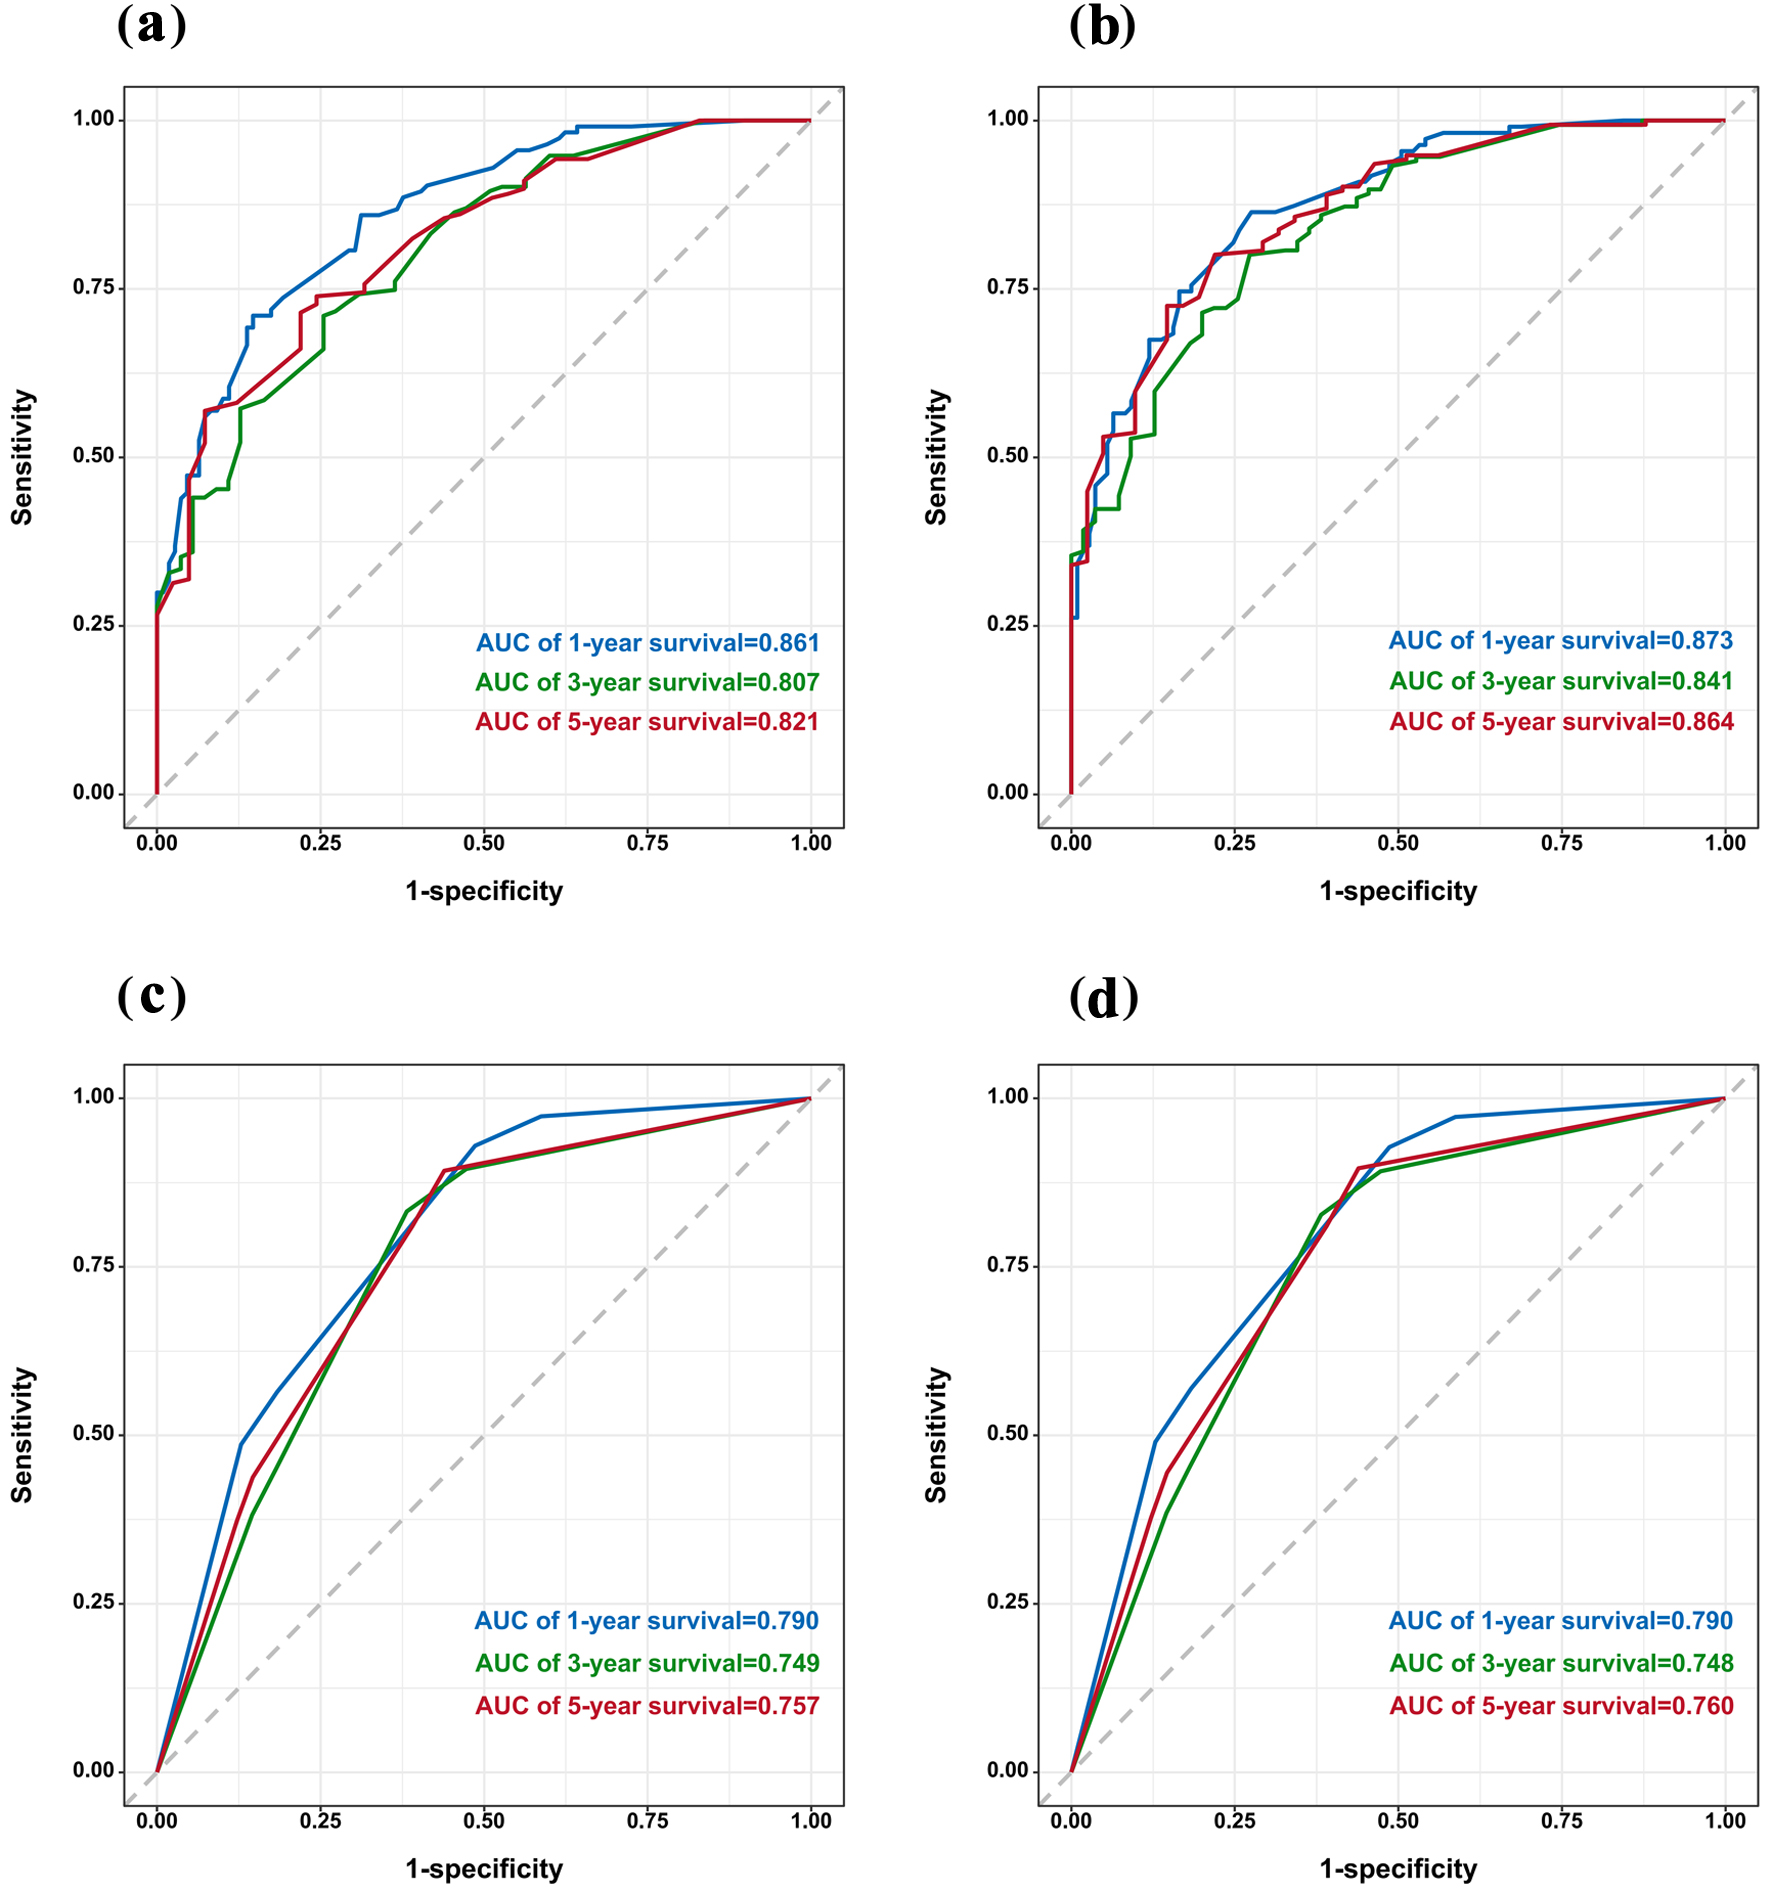
↓ Figure 3. ROC curve of the nomogram (a) and
FIGO stage (c) for OS. ROC curve of the nomogram (b) and FIGO stage (d) for CSS. CSS: cancer-specific
survival; FIGO: Federation International of Gynecology and Obstetrics; OS: overall survival; ROC:
receiver operating characteristic.
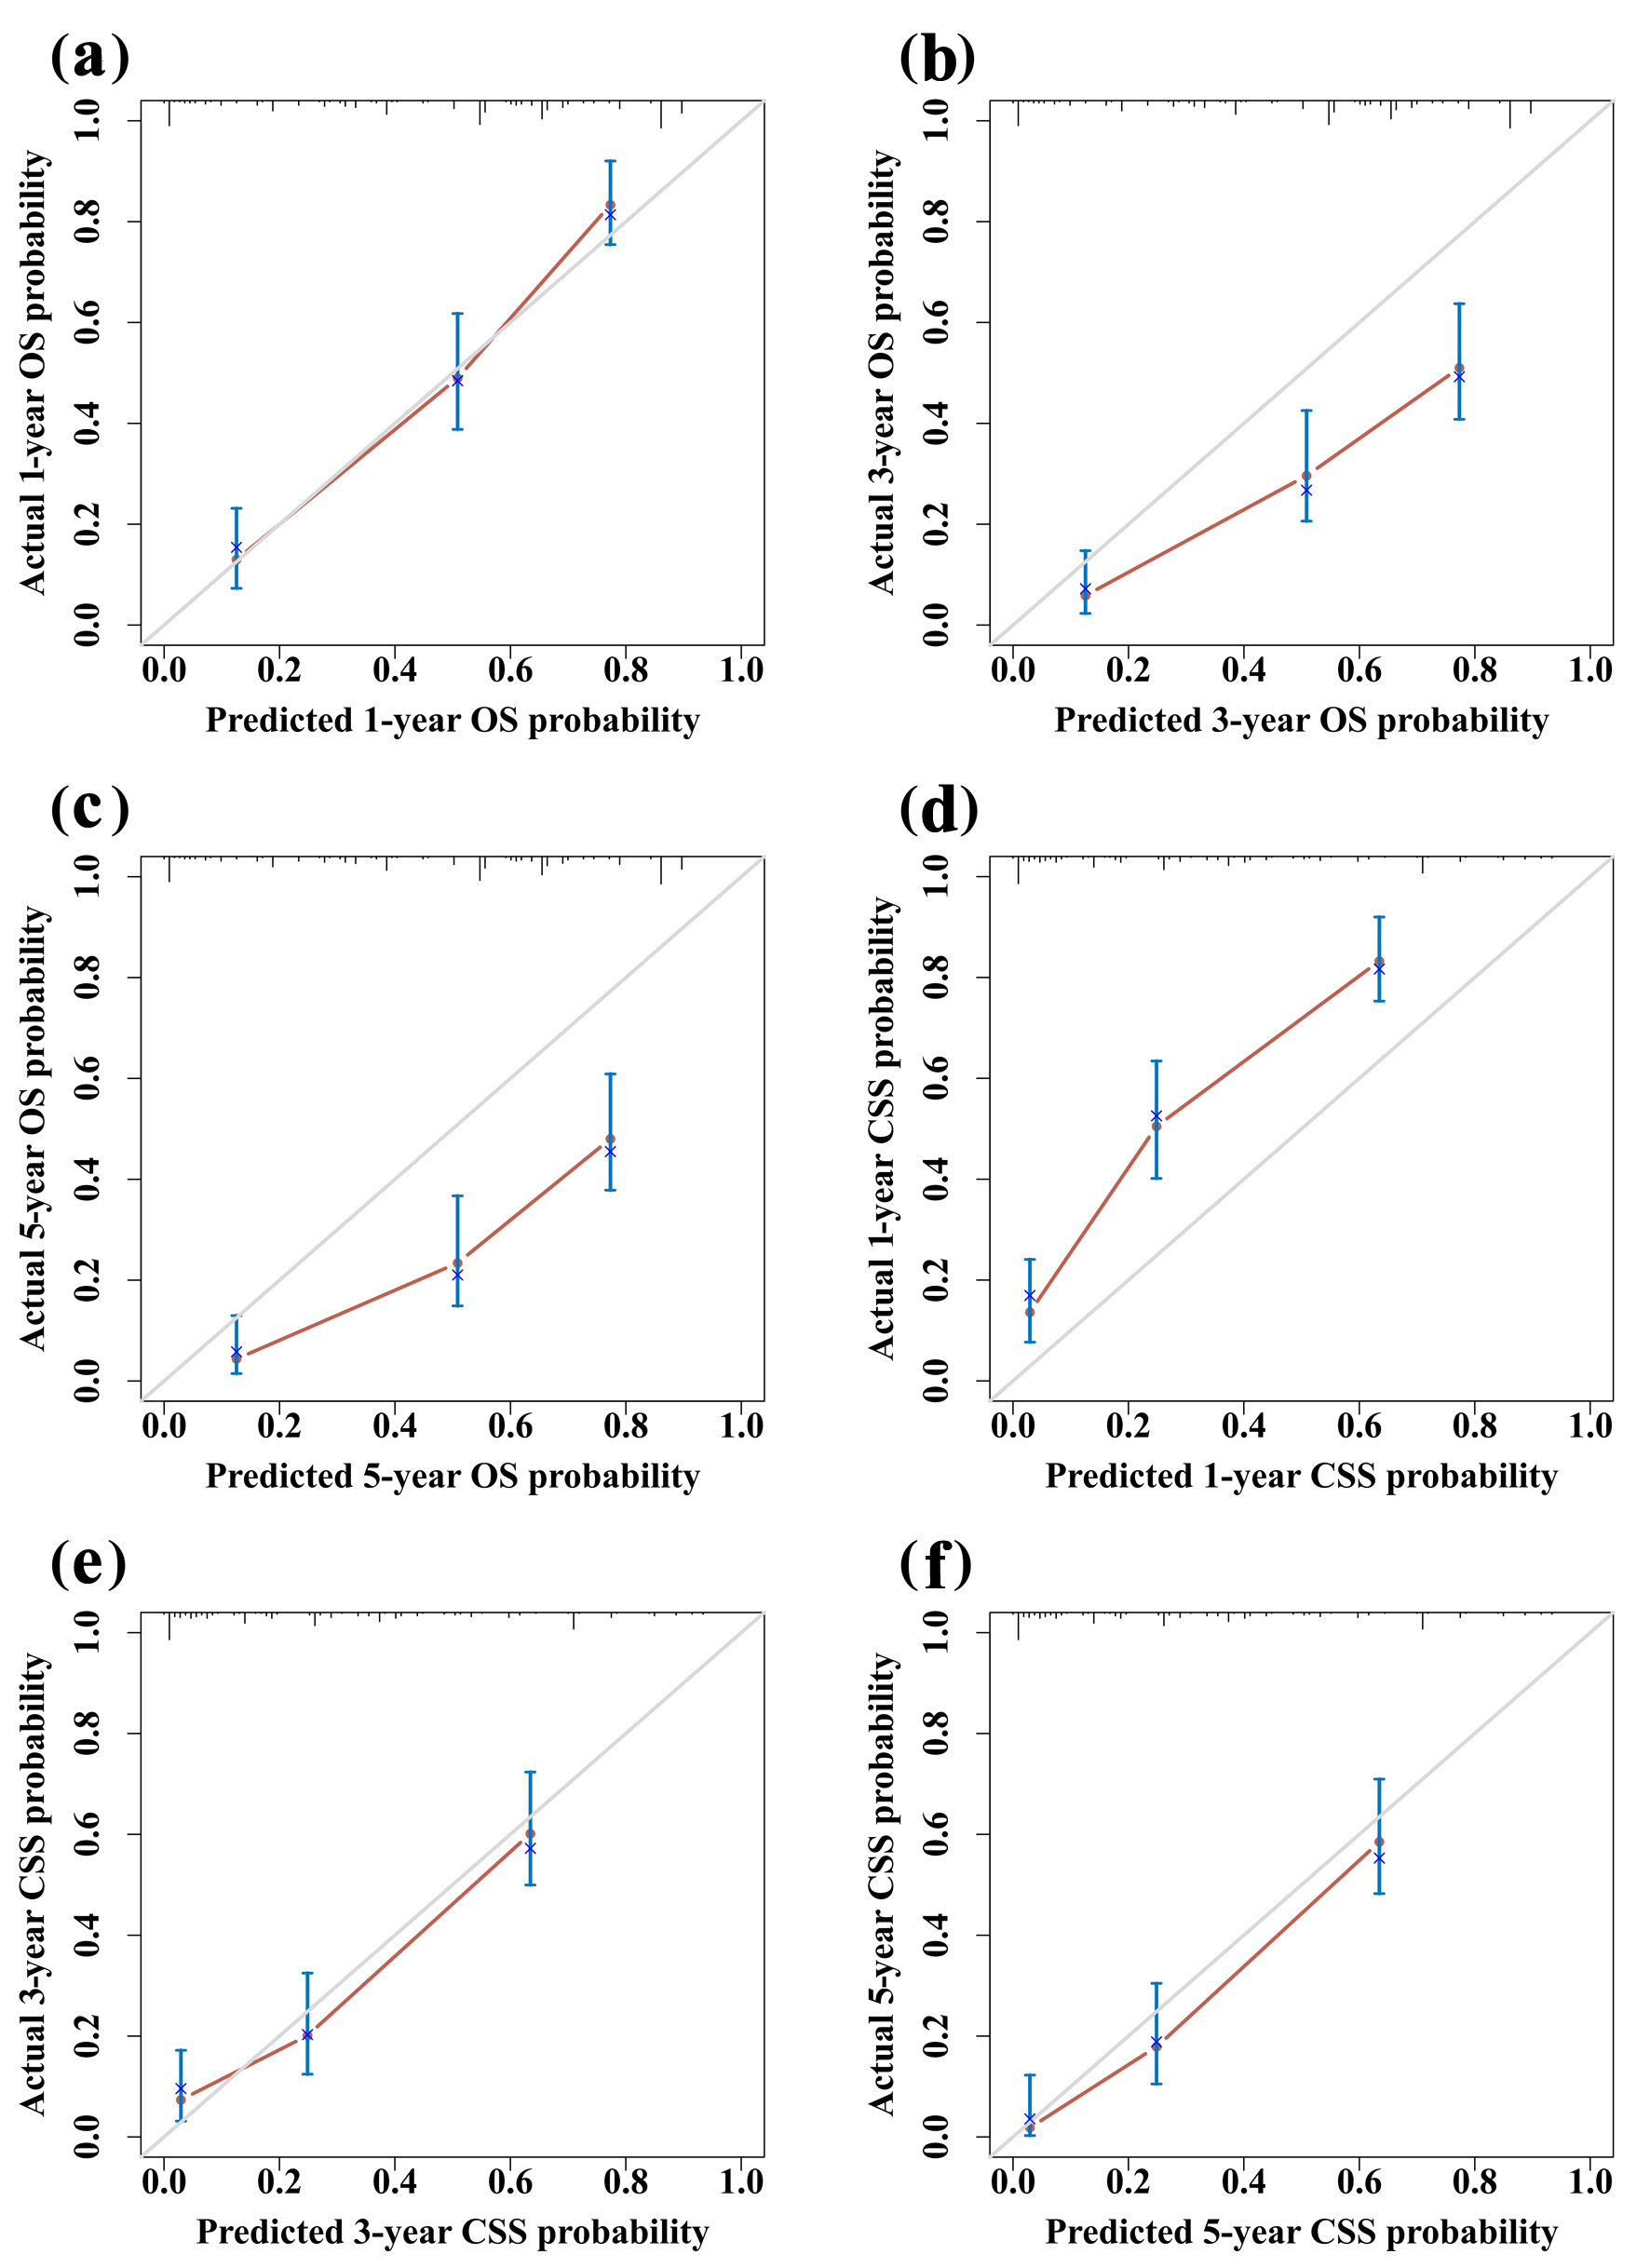
↓ Figure 4. Calibration curves for 1-year (a),
3-year (b), and 5-year (c) OS. Calibration curves for 1-year (d), 3-year (e), and 5-year (f) CSS. CSS:
cancer-specific survival; OS: overall survival.
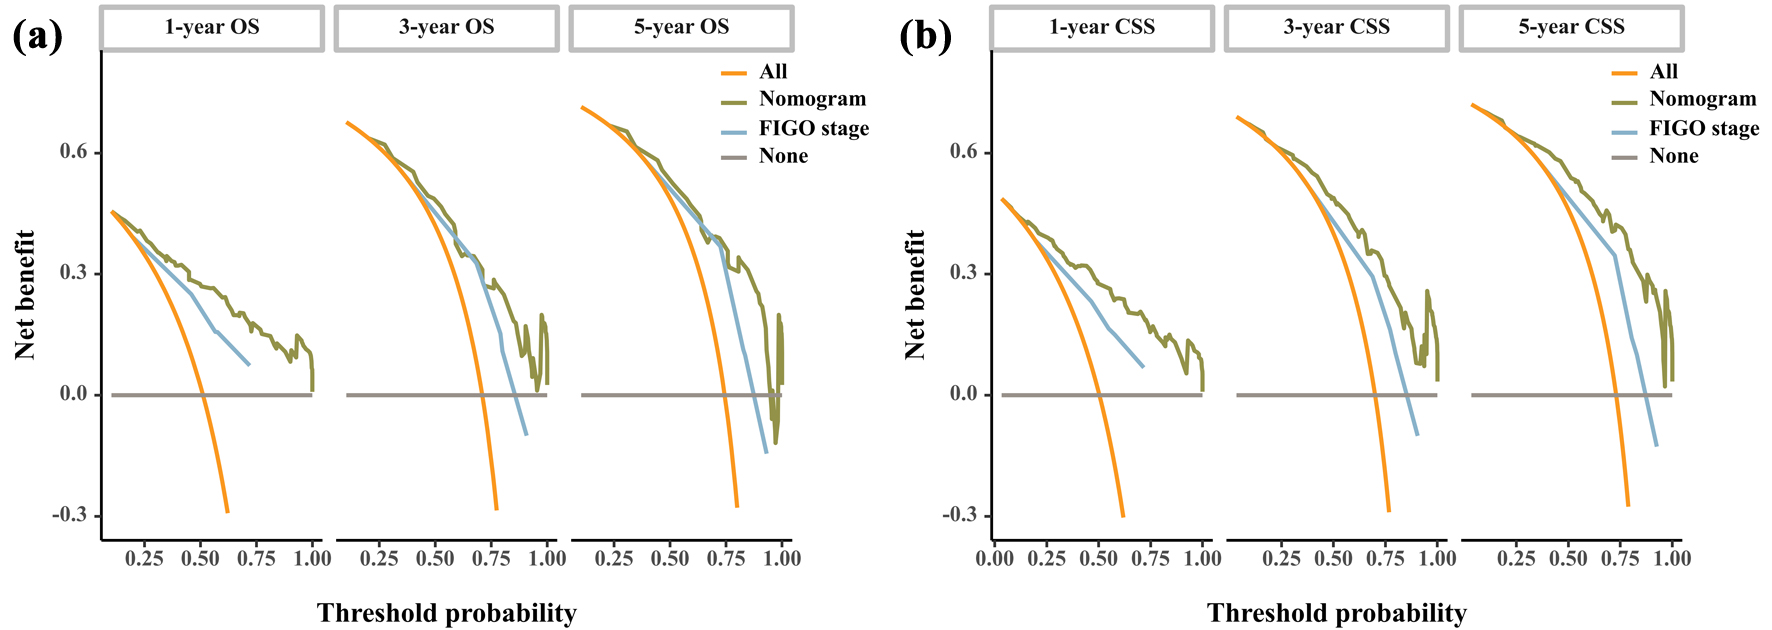
↓ Figure 5. DCA curve of the nomogram and FIGO
stage for OS (a) and CSS (b). CSS: cancer-specific survival; DCA: decision curve analysis; FIGO:
Federation International of Gynecology and Obstetrics; OS: overall survival.
Tables
↓ Table 1. Characteristics of Small Cell Carcinoma of Ovary
Patients
|
Characteristics |
Patients, N (%) |
Deaths, N (%) |
Cancer-specific deaths, N (%) |
| Numbers in parentheses for all variables represent column percentages. CA125: serum
carbohydrate antigen 125; DSW: divorced, separated, or widowed; FIGO: Federation International of
Gynecology and Obstetrics. |
| Total |
236 |
173 |
166 |
| Age (years) |
|
|
|
| ≤ 45 |
145 (61.44) |
94 (54.34) |
90 (54.22) |
| 46 - 72 |
63 (26.69) |
52 (30.06) |
50 (30.12) |
| ≥ 73 |
28 (11.86) |
27 (15.61) |
26 (15.66) |
| Marital status at diagnosis |
|
|
|
| Single |
106 (44.92) |
69 (39.88) |
65 (39.16) |
| Married |
88 (37.29) |
69 (39.88) |
66 (39.76) |
| DSW |
34 (14.41) |
30 (17.34) |
30 (18.07) |
| Unknown |
8 (3.39) |
5 (2.89) |
5 (3.01) |
| Median household income ($) |
|
|
|
| < 55,000 |
42 (17.80) |
39 (22.54) |
38 (22.89) |
| 55,000 - 69,999 |
81 (34.32) |
56 (32.37) |
55 (33.13) |
| ≥ 70,000 |
113 (47.88) |
78 (45.09) |
73 (43.98) |
| Race |
|
|
|
| Non-Hispanic Black |
16 (6.78) |
13 (7.51) |
11 (6.63) |
| Non-Hispanic White |
151 (63.98) |
110 (63.58) |
105 (63.25) |
| Non-Hispanic Asian/Pacific Islander |
23 (9.75) |
15 (8.67) |
15 (9.04) |
| Non-Hispanic American Indian/Alaska Native |
4 (1.69) |
2 (1.16) |
2 (1.2) |
| Hispanic |
41 (17.37) |
33 (19.08) |
33 (19.88) |
| Non-Hispanic unknown race |
1 (0.42) |
0 (0) |
0 (0) |
| Year of diagnosis |
|
|
|
| 2000 - 2002 |
33 (13.98) |
26 (15.03) |
21 (12.65) |
| 2003 - 2015 |
140 (59.32) |
107 (61.85) |
107 (64.46) |
| 2016 - 2020 |
63 (26.69) |
40 (23.12) |
38 (22.89) |
| Laterality |
|
|
|
| Bilateral |
30 (12.71) |
27 (15.61) |
26 (15.66) |
| Right |
96 (40.68) |
64 (36.99) |
62 (37.35) |
| Left |
84 (35.59) |
56 (32.37) |
54 (32.53) |
| Paired site, but no information concerning laterality |
23 (9.75) |
23 (13.29) |
21 (12.65) |
| Only one side - side unspecified |
3 (1.27) |
3 (1.73) |
3 (1.81) |
| Tumor size (mm) |
|
|
|
| ≤ 92 |
37 (15.68) |
29 (16.76) |
29 (17.47) |
| 93 - 141 |
41 (17.37) |
33 (19.08) |
33 (19.88) |
| ≥ 142 |
79 (33.47) |
44 (25.43) |
43 (25.90) |
| Unknown |
79 (33.47) |
67 (38.73) |
61 (36.75) |
| Surgery status |
|
|
|
| No surgery |
52 (22.03) |
51 (29.48) |
47 (28.31) |
| Surgery |
184 (77.97) |
122 (70.52) |
119 (71.69) |
| Chemotherapy status |
|
|
|
| No chemotherapy/unknown |
55 (23.31) |
48 (27.75) |
46 (27.71) |
| Chemotherapy |
181 (76.69) |
125 (72.25) |
120 (72.29) |
| Radiation therapy |
|
|
|
| No radiation/unknown |
211 (89.41) |
161 (93.06) |
155 (93.37) |
| Radiation |
25 (10.59) |
12 (6.94) |
11 (6.63) |
| Grade |
|
|
|
| I/II |
2 (0.85) |
1 (0.58) |
1 (0.60) |
| III/IV |
112 (47.46) |
80 (46.24) |
77 (46.39) |
| Unknown |
122 (51.69) |
92 (53.18) |
88 (53.01) |
| FIGO stage |
|
|
|
| I |
53 (22.46) |
21 (12.14) |
20 (12.05) |
| II |
17 (7.20) |
13 (7.51) |
13 (7.83) |
| III |
78 (33.05) |
64 (36.99) |
60 (36.14) |
| IV |
73 (30.93) |
64 (36.99) |
62 (37.35) |
| Unknown |
15 (6.36) |
11 (6.36) |
11 (6.63) |
| Lymph nodes status |
|
|
|
| Negative |
64 (27.12) |
32 (18.50) |
31 (18.67) |
| Positive |
46 (19.49) |
30 (17.34) |
30 (18.07) |
| Unknown |
126 (53.39) |
111 (64.16) |
105 (63.25) |
| CA125 |
|
|
|
| Negative |
9 (3.81) |
3 (1.73) |
3 (1.81) |
| Positive |
82 (34.75) |
55 (31.79) |
54 (32.53) |
| Unknown |
145 (61.44) |
115 (66.47) |
109 (65.66) |
| Number of primary tumors |
|
|
|
| First of two or more primaries |
14 (5.93) |
8 (4.62) |
5 (3.01) |
| One primary only |
222 (94.07) |
165 (95.38) |
161 (96.99) |
↓ Table 2. Univariable Cox Regression for Analyzing the Associated Factors
for Small Cell Carcinoma of Ovary
| Characteristics |
OS |
CSS |
| HR
(95% CI) |
P
|
HR
(95% CI) |
P
|
| CA125: serum carbohydrate antigen 125; CI: confidence interval; CSS: cancer-specific
survival; DSW: divorced, separated, or widowed; FIGO: Federation International of Gynecology and
Obstetrics; HR: hazard ratio; OS: overall survival. |
| Age (years) |
|
|
|
|
| ≤ 45 |
Reference |
|
Reference |
|
| 46 - 72 |
1.75 (1.25 - 2.46) |
0.001 |
1.76 (1.25 - 2.49) |
0.001 |
| ≥ 73 |
6.77 (4.34 - 10.56) |
< 0.001 |
6.73 (4.28 - 10.58) |
< 0.001 |
| Marital status at diagnosis |
|
|
|
|
| DSW |
Reference |
|
Reference |
|
| Married |
0.62 (0.41 - 0.96) |
0.032 |
0.60 (0.39 - 0.92) |
0.019 |
| Single |
0.45 (0.29 - 0.69) |
< 0.001 |
0.42 (0.27 - 0.65) |
< 0.001 |
| Unknown |
0.54 (0.21 - 1.39) |
0.202 |
0.55 (0.21 - 1.41) |
0.210 |
| Median household income ($) |
|
|
|
|
| < 55,000 |
Reference |
|
Reference |
|
| 55,000 - 69,999 |
0.57 (0.38 - 0.86) |
0.007 |
0.58 (0.38 - 0.88) |
0.011 |
| ≥ 70,000 |
0.64 (0.44 - 0.95) |
0.025 |
0.63 (0.42 - 0.93) |
0.021 |
| Race |
|
|
|
|
| Non-Hispanic Black |
Reference |
|
Reference |
|
| Non-Hispanic White |
0.88 (0.50 - 1.57) |
0.667 |
1.00 (0.54 - 1.87) |
0.993 |
| Non-Hispanic Asian/Pacific Islander |
0.81 (0.38 - 1.70) |
0.574 |
0.96 (0.44 - 2.09) |
0.913 |
| Non-Hispanic American Indian/Alaska Native |
2.37 (0.53 - 10.70) |
0.260 |
2.78 (0.61 - 12.78) |
0.188 |
| Hispanic |
1.16 (0.61 - 2.20) |
0.660 |
1.36 (0.68 - 2.68) |
0.383 |
| Non-Hispanic unknown race |
NA |
NA |
| Year of diagnosis |
|
|
|
|
| 2000 - 2002 |
Reference |
|
Reference |
|
| 2003 - 2015 |
1.28 (0.83 - 1.97) |
0.262 |
1.55 (0.97 - 2.48) |
0.065 |
| 2016 - 2020 |
1.38 (0.84 - 2.28) |
0.203 |
1.57 (0.92 - 2.69) |
0.098 |
| Laterality |
|
|
|
|
| Bilateral |
Reference |
|
Reference |
|
| Right |
0.48 (0.31 - 0.76) |
0.002 |
0.50 (0.31 - 0.79) |
0.003 |
| Left |
0.50 (0.31 - 0.79) |
0.003 |
0.51 (0.32 - 0.81) |
0.005 |
| Paired site, but no information concerning laterality |
2.05 (1.16 - 3.60) |
0.013 |
1.93 (1.08 - 3.45) |
0.028 |
| Only one side - side unspecified |
9.39 (2.69 - 32.71) |
< 0.001 |
9.87 (2.82 - 34.55) |
< 0.001 |
| Tumor size (mm) |
|
|
|
|
| ≤ 92 |
Reference |
|
Reference |
|
| 93 - 141 |
0.77 (0.47 - 1.27) |
0.302 |
0.76 (0.46 - 1.26) |
0.293 |
| ≥ 142 |
0.45 (0.28 - 0.72) |
< 0.001 |
0.44 (0.27 - 0.71) |
< 0.001 |
| Unknown |
0.90 (0.58 - 1.40) |
0.646 |
0.83 (0.53 - 1.29) |
0.400 |
| Surgery status |
|
|
|
|
| No surgery |
Reference |
|
Reference |
|
| Surgery |
0.23 (0.17 - 0.33) |
< 0.001 |
0.25 (0.18 - 0.36) |
< 0.001 |
| Chemotherapy status |
|
|
|
|
| No chemotherapy/unknown |
Reference |
|
Reference |
|
| Chemotherapy |
0.38 (0.27 - 0.53) |
< 0.001 |
0.38 (0.27 - 0.53) |
< 0.001 |
| Radiation therapy |
|
|
|
|
| No radiation/unknown |
Reference |
|
Reference |
|
| Radiation |
0.51 (0.29 - 0.92) |
0.026 |
0.49 (0.26 - 0.90) |
0.021 |
| Grade |
|
|
|
|
| I/II |
Reference |
|
Reference |
|
| III/IV |
1.33 (0.18 - 9.57) |
0.777 |
1.30 (0.18 - 9.38) |
0.792 |
| Unknown |
1.76 (0.24 - 12.62) |
0.575 |
1.69 (0.24 - 12.17) |
0.601 |
| FIGO stage |
|
|
|
|
| I |
Reference |
|
Reference |
|
| II |
2.78 (1.39 - 5.57) |
0.004 |
2.88 (1.43 - 5.81) |
0.003 |
| III |
3.79 (2.30 - 6.22) |
< 0.001 |
3.66 (2.20 - 6.09) |
< 0.001 |
| IV |
5.77 (3.50 - 9.51) |
< 0.001 |
5.83 (3.50 - 9.72) |
< 0.001 |
| Unknown |
3.89 (1.87 - 8.10) |
< 0.001 |
3.97 (1.89 - 8.31) |
< 0.001 |
| Lymph nodes status |
|
|
|
|
| Negative |
Reference |
|
Reference |
|
| Positive |
1.95 (1.18 - 3.21) |
0.009 |
1.98 (1.20 - 3.28) |
0.008 |
| Unknown |
3.44 (2.31 - 5.13) |
< 0.001 |
3.31 (2.21 - 4.96) |
< 0.001 |
| CA125 |
|
|
|
|
| Negative |
Reference |
|
Reference |
|
| Positive |
3.02 (0.94 - 9.67) |
0.062 |
2.95 (0.92 - 9.46) |
0.068 |
| Unknown |
2.89 (0.92 - 9.10) |
0.070 |
2.77 (0.88 - 8.72) |
0.082 |
| Number of primary tumors |
|
|
|
|
| First of two or more primaries |
Reference |
|
Reference |
|
| One primary only |
1.94 (0.95 - 3.97) |
0.068 |
2.92 (1.19 - 7.12) |
0.019 |
↓ Table 3. Multivariable Cox Regression for Analyzing the Associated
Factors for Small Cell Carcinoma of Ovary
| Characteristics |
OS |
CSS |
| HR
(95% CI) |
P
|
HR
(95% CI) |
P
|
| CI: confidence interval; CSS: cancer-specific survival; DSW: divorced, separated, or
widowed; FIGO: Federation International of Gynecology and Obstetrics; HR: hazard ratio; OS: overall
survival. |
| Age (years) |
|
|
|
|
| ≤ 45 |
Reference |
|
Reference |
|
| 46 - 72 |
0.92 (0.59 - 1.44) |
0.709 |
0.90 (0.57 - 1.43) |
0.663 |
| ≥ 73 |
3.30 (1.63 - 6.68) |
< 0.001 |
3.28 (1.55 - 6.94) |
0.002 |
| Marital status at diagnosis |
|
|
|
|
| DSW |
Reference |
|
Reference |
|
| Married |
1.48 (0.81 - 2.71) |
0.207 |
1.44 (0.77 - 2.68) |
0.251 |
| Single |
1.43 (0.78 - 2.65) |
0.251 |
1.44 (0.77 - 2.68) |
0.254 |
| Unknown |
1.29 (0.44 - 3.79) |
0.645 |
1.16 (0.39 - 3.47) |
0.788 |
| Median household income ($) |
|
|
|
|
| < 55,000 |
Reference |
|
Reference |
|
| 55,000 - 69,999 |
0.46 (0.30 - 0.72) |
< 0.001 |
0.52 (0.34 - 0.81) |
0.004 |
| ≥ 70,000 |
0.65 (0.43 - 0.99) |
0.044 |
0.70 (0.46 - 1.08) |
0.109 |
| Laterality |
|
|
|
|
| Bilateral |
Reference |
|
Reference |
|
| Right |
0.78 (0.47 - 1.29) |
0.335 |
0.82 (0.49 - 1.38) |
0.462 |
| Left |
0.70 (0.42 - 1.15) |
0.159 |
0.74 (0.45 - 1.23) |
0.251 |
| Paired site, but no information concerning laterality |
0.90 (0.46 - 1.77) |
0.768 |
0.95 (0.47 - 1.92) |
0.891 |
| Only one side - side unspecified |
5.26 (1.36 - 20.32) |
0.016 |
5.68 (1.45 - 22.21) |
0.012 |
| Tumor size (mm) |
|
|
|
|
| ≤ 92 |
Reference |
|
Reference |
|
| 93 - 141 |
0.85 (0.49 - 1.50) |
0.584 |
0.83 (0.46 - 1.47) |
0.517 |
| ≥ 142 |
0.83 (0.49 - 1.40) |
0.478 |
0.71 (0.41 - 1.22) |
0.215 |
| Unknown |
0.79 (0.48 - 1.31) |
0.363 |
0.71 (0.42 - 1.21) |
0.205 |
| Surgery status |
|
|
|
|
| No surgery |
Reference |
|
Reference |
|
| Surgery |
0.43 (0.26 - 0.71) |
< 0.001 |
0.44 (0.26 - 0.73) |
0.002 |
| Chemotherapy status |
|
|
|
|
| No chemotherapy/unknown |
Reference |
|
Reference |
|
| Chemotherapy |
0.33 (0.22 - 0.50) |
< 0.001 |
0.35 (0.23 - 0.53) |
< 0.001 |
| Radiation therapy |
|
|
|
|
| No radiation/unknown |
Reference |
|
Reference |
|
| Radiation |
0.58 (0.30 - 1.10) |
0.097 |
0.49 (0.25 - 0.96) |
0.038 |
| Grade |
|
|
|
|
| I/II |
Reference |
|
Reference |
|
| III/IV |
0.82 (0.10 - 6.59) |
0.854 |
0.79 (0.10 - 6.28) |
0.820 |
| Unknown |
1.01 (0.12 - 8.25) |
0.992 |
0.86 (0.10 - 7.01) |
0.886 |
| FIGO stage |
|
|
|
|
| I |
Reference |
|
Reference |
|
| II |
2.33 (1.11 - 4.86) |
0.025 |
2.44 (1.16 - 5.12) |
0.019 |
| III |
4.39 (2.51 - 7.66) |
< 0.001 |
4.03 (2.26 - 7.18) |
< 0.001 |
| IV |
3.95 (2.06 - 7.57) |
< 0.001 |
4.54 (2.33 - 8.86) |
< 0.001 |
| Unknown |
3.28 (1.45 - 7.40) |
0.004 |
3.53 (1.54 - 8.06) |
0.003 |
| Lymph nodes status |
|
|
|
|
| Negative |
Reference |
|
Reference |
|
| Positive |
0.76 (0.42 - 1.39) |
0.377 |
0.78 (0.43 - 1.42) |
0.415 |
| Unknown |
1.27 (0.78 - 2.07) |
0.339 |
1.14 (0.69 - 1.89) |
0.613 |
| Number of primary tumors |
|
|
|
| First of two or more primaries |
|
|
Reference |
|
| One primary only |
|
|
3.79 (1.48 - 9.68) |
0.005 |