Figures
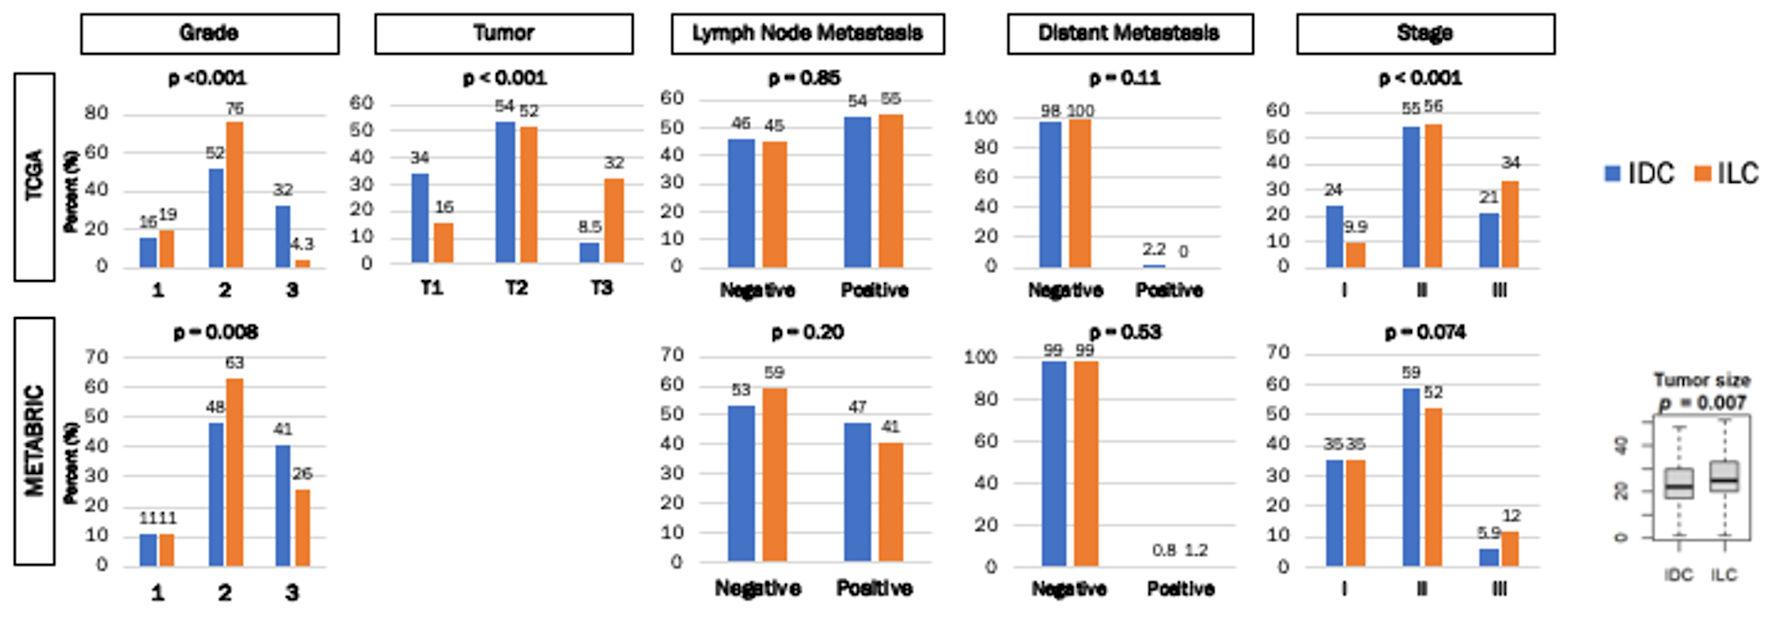
↓ Figure 1. Clinical parameters of ER+/HER2- IDC
and ILC breast cancers in TCGA and METABRIC cohorts. Bar graphs demonstrate the percentage of patients
with histologic grades, tumor size, lymph node metastasis, distant metastasis, and stage. The Y-axis
demonstrates the percentage of patients in either cohort. The X-axis represents grade (1, 2 and 3),
tumor size (T1, T2, T3 and T4), patients with and without lymph node metastasis, patients with and
without distant metastasis, and stage (I, II and III) in each cohort. Box plot demonstrates tumor size
difference between IDC and ILC in the METABRIC cohort. Numbers above each bar represent the percentage
of patients within each cohort. IDC were represented by the blue bars, and ILC were represented by the
orange bars. Fisher’s exact test was used to calculate P values.
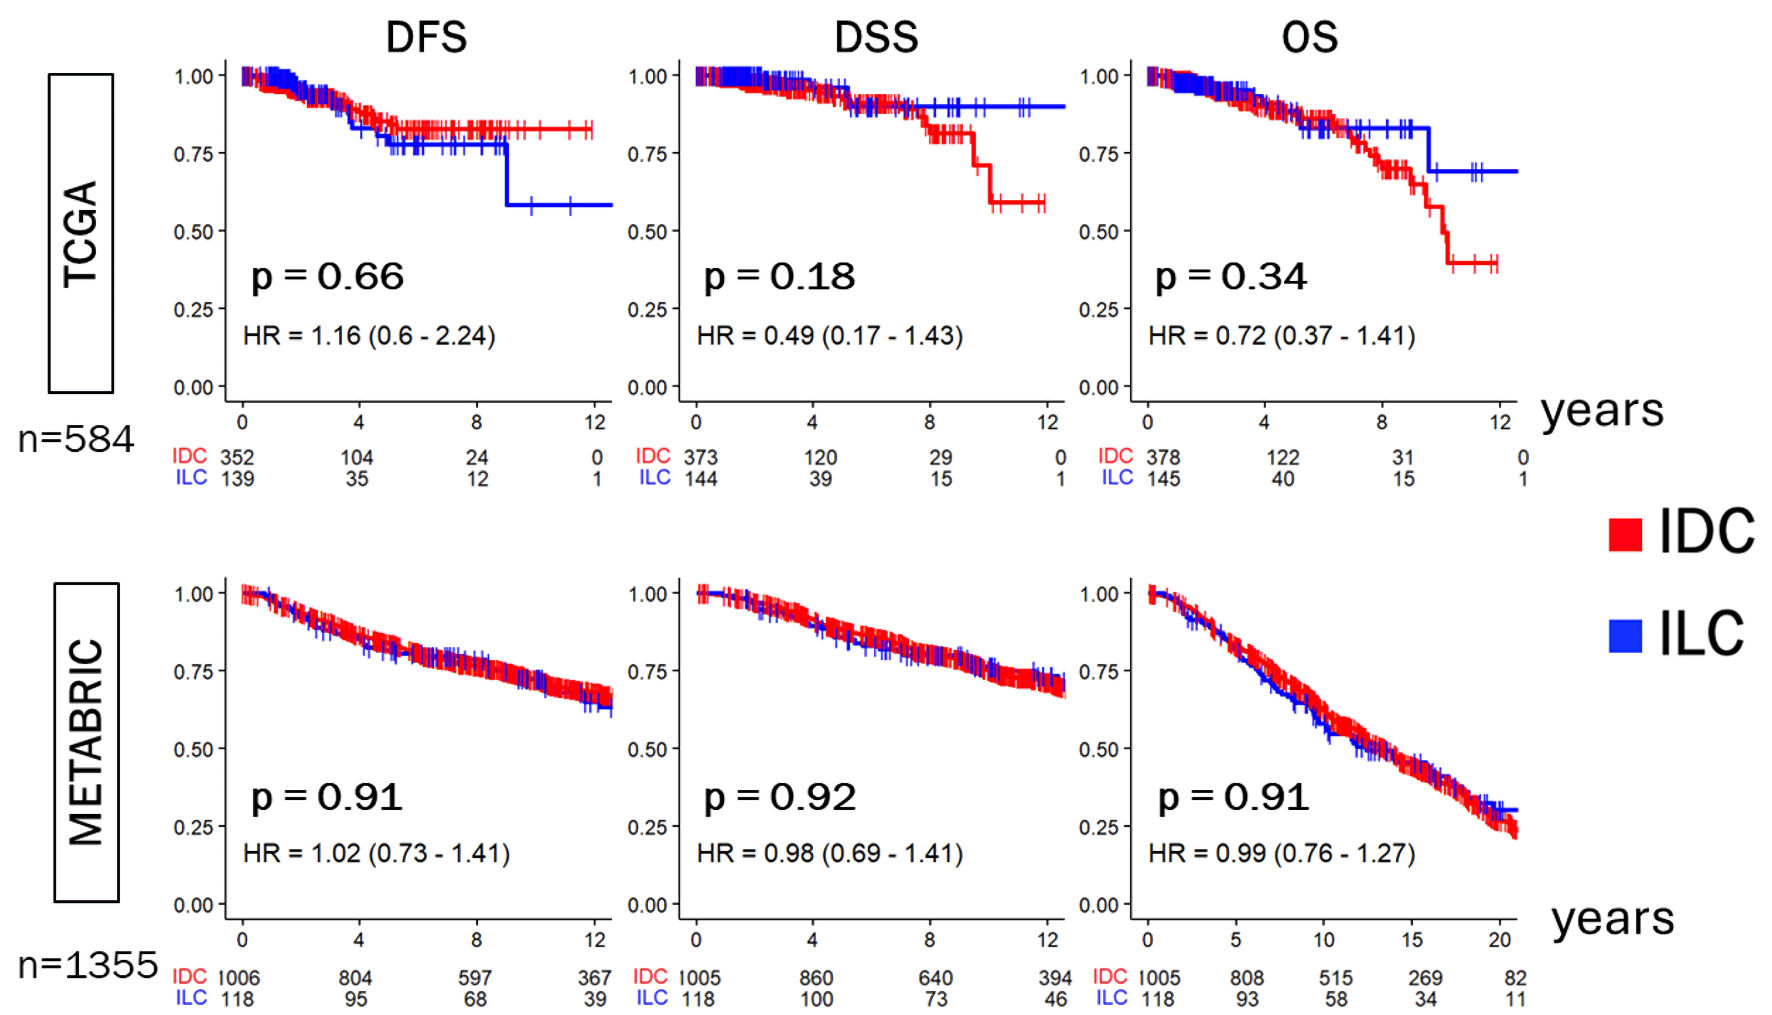
↓ Figure 2. Disease-free survival (DFS),
Disease-specific survival (DSS), and overall survival (OS) of ER-positive/HER2-negative IDC and ILC in
the TCGA and METABRIC cohorts. Kaplan-Meier plots show DFS, DSS, and OS in the TCGA (n = 584) and
METABRIC (n = 1,355) cohorts. Log-rank test was conducted to determine P values. IDC were indicated by
the red lines, and ILC by the blue lines. ER: estrogen receptor; HER2: human epidermal growth factor
receptor 2; IDC: invasive ductal carcinoma; ILC: invasive lobular carcinoma; TCGA: The Cancer Genome
Atlas; METABRIC: Molecular Taxonomy of Breast Cancer International Consortium; HR: hazard ratio.
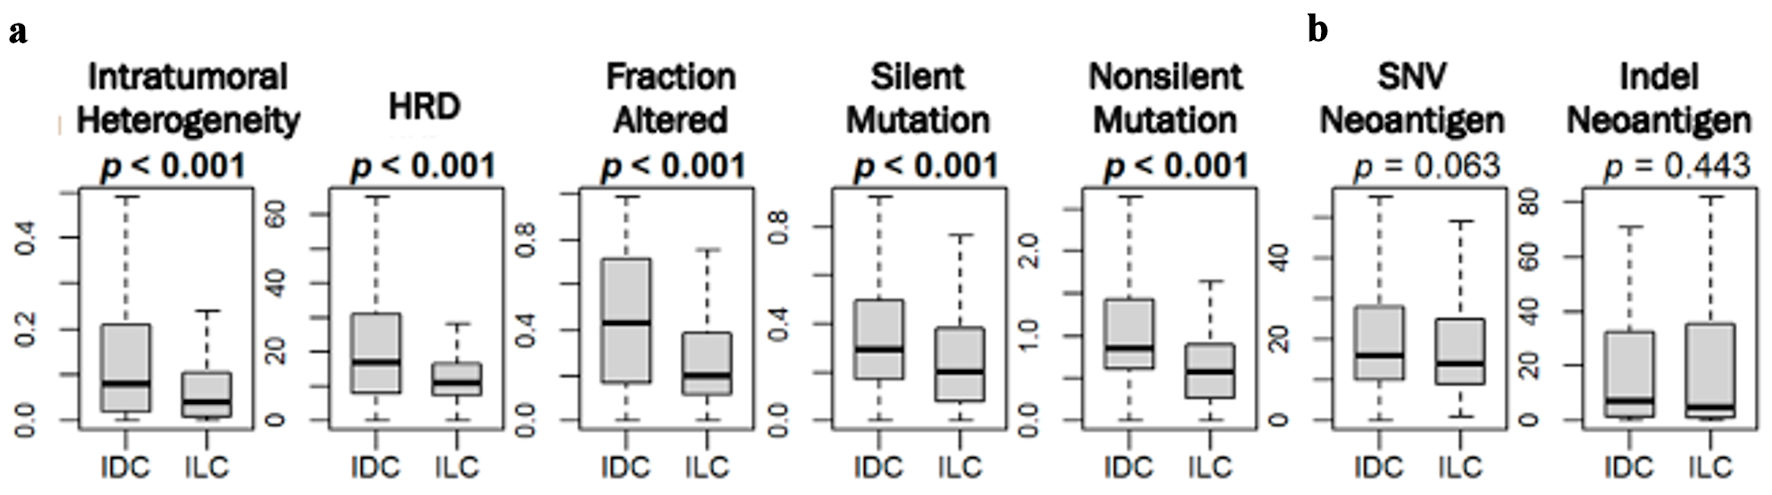
↓ Figure 3. Mutation rates amongst
ER-positive/HER2-negative IDC and ILC in TCGA. Box plots show (a) intratumoral heterogeneity, homologous
recombination deficiency (HRD), fraction altered, silent and non-silent mutation rate, and (Bb single
nucleotide variant (SNV) and indel neoantigens between IDC and ILC in the TCGA cohort. P values were
determined using Mann Whitney U test. ER: estrogen receptor; HER2: human epidermal growth factor
receptor 2; IDC: invasive ductal carcinoma; ILC: invasive lobular carcinoma; TCGA: The Cancer Genome
Atlas.
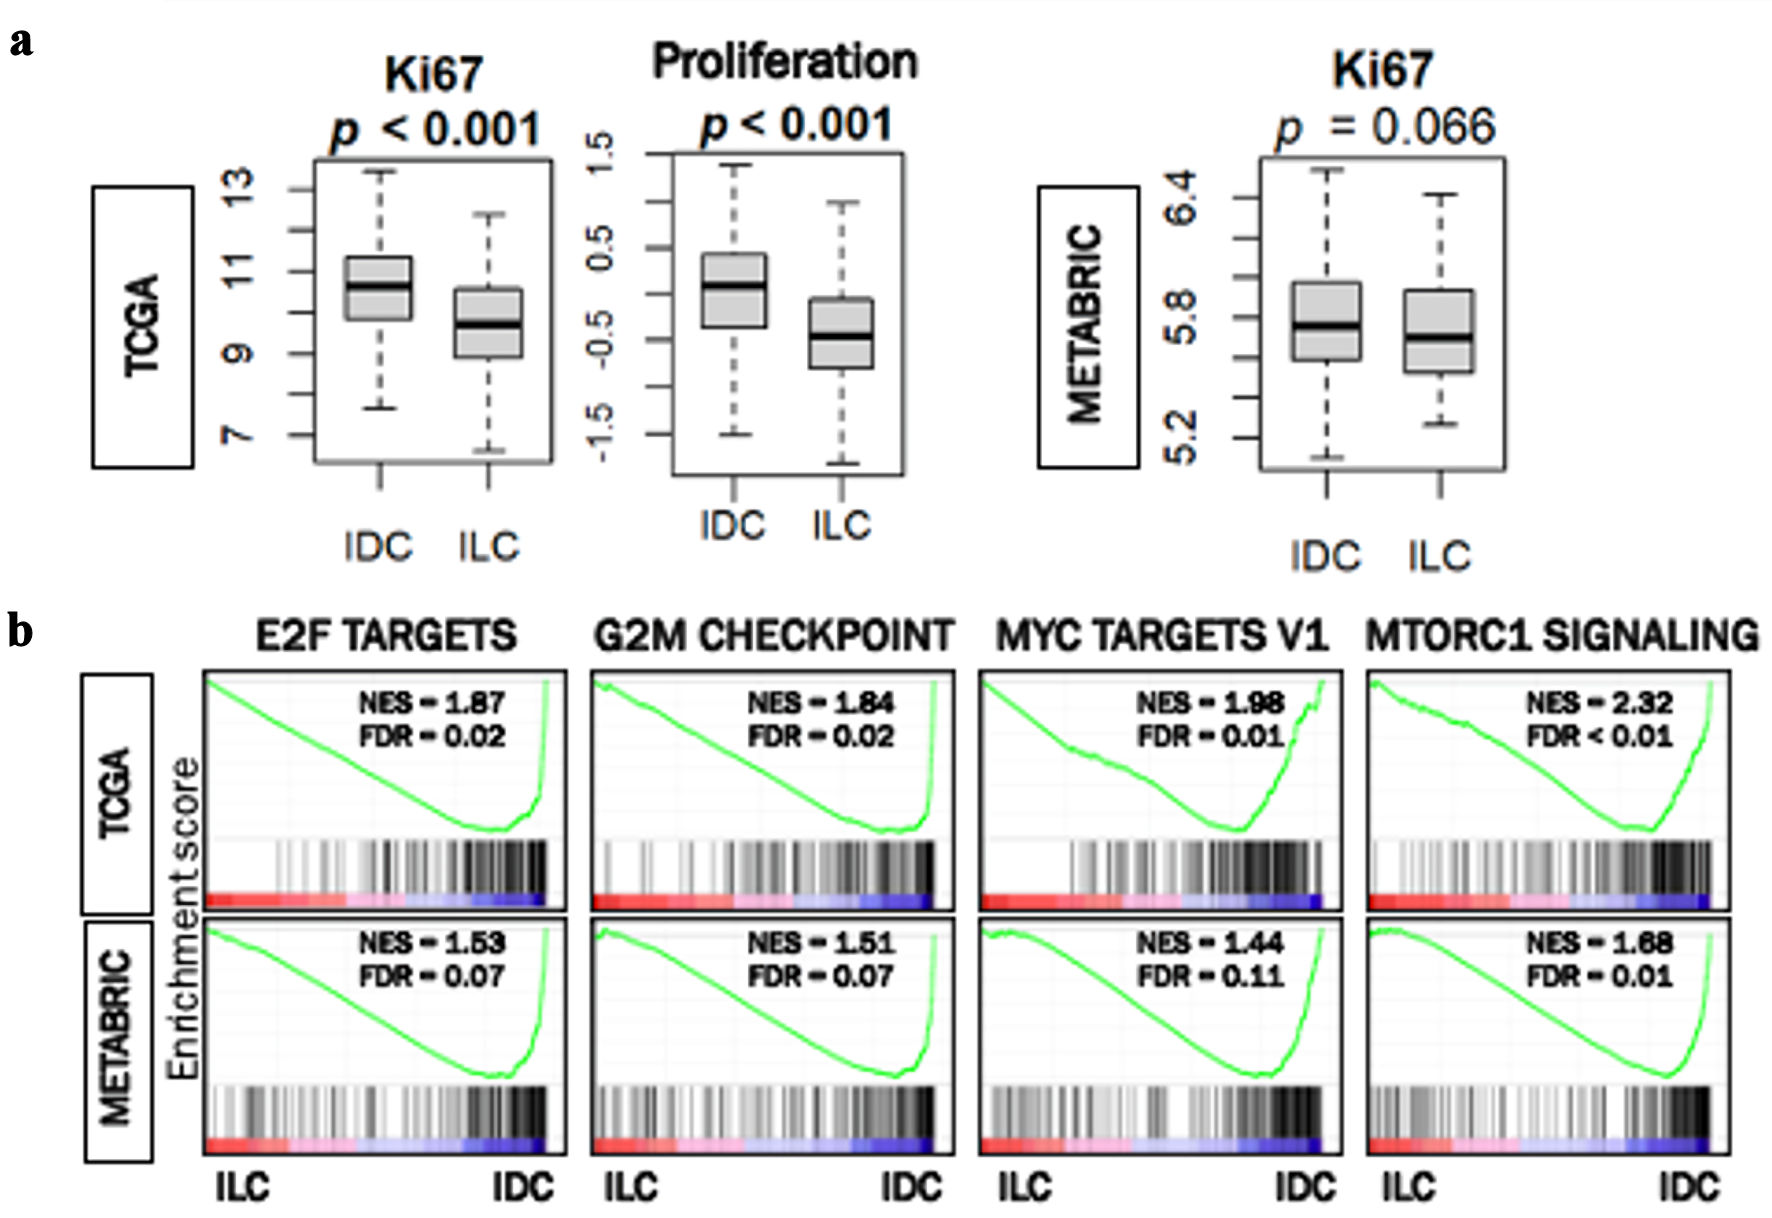
↓ Figure 4. Cell proliferation rates in
ER-positive/HER2-negative IDC and ILC in TCGA and METABRIC. (a) Box plots of MKi67 expression and
proliferation score in IDC and ILC in TCGA cohort. Box plot of MiK67 expression in IDC and ILC in
METABRIC cohort. Mann Whitney U test was used to calculate P values. (b) Gene set enrichment analysis
(GSEA) of hallmark collection (E2F targets, G2M checkpoint, MYC targets V1, and MTORC1 signaling) and
their relationship with IDC and ILC cells in the TCGA and METABRIC cohorts. Median cut-off was used to
perform the analysis. NES and FDR were determined with the GSEA method. ER: estrogen receptor; HER2:
human epidermal growth factor receptor 2; IDC: invasive ductal carcinoma; ILC: invasive lobular
carcinoma; TCGA: The Cancer Genome Atlas; METABRIC: Molecular Taxonomy of Breast Cancer International
Consortium; NES: normalized enrichment score; FDR: false discovery rate.
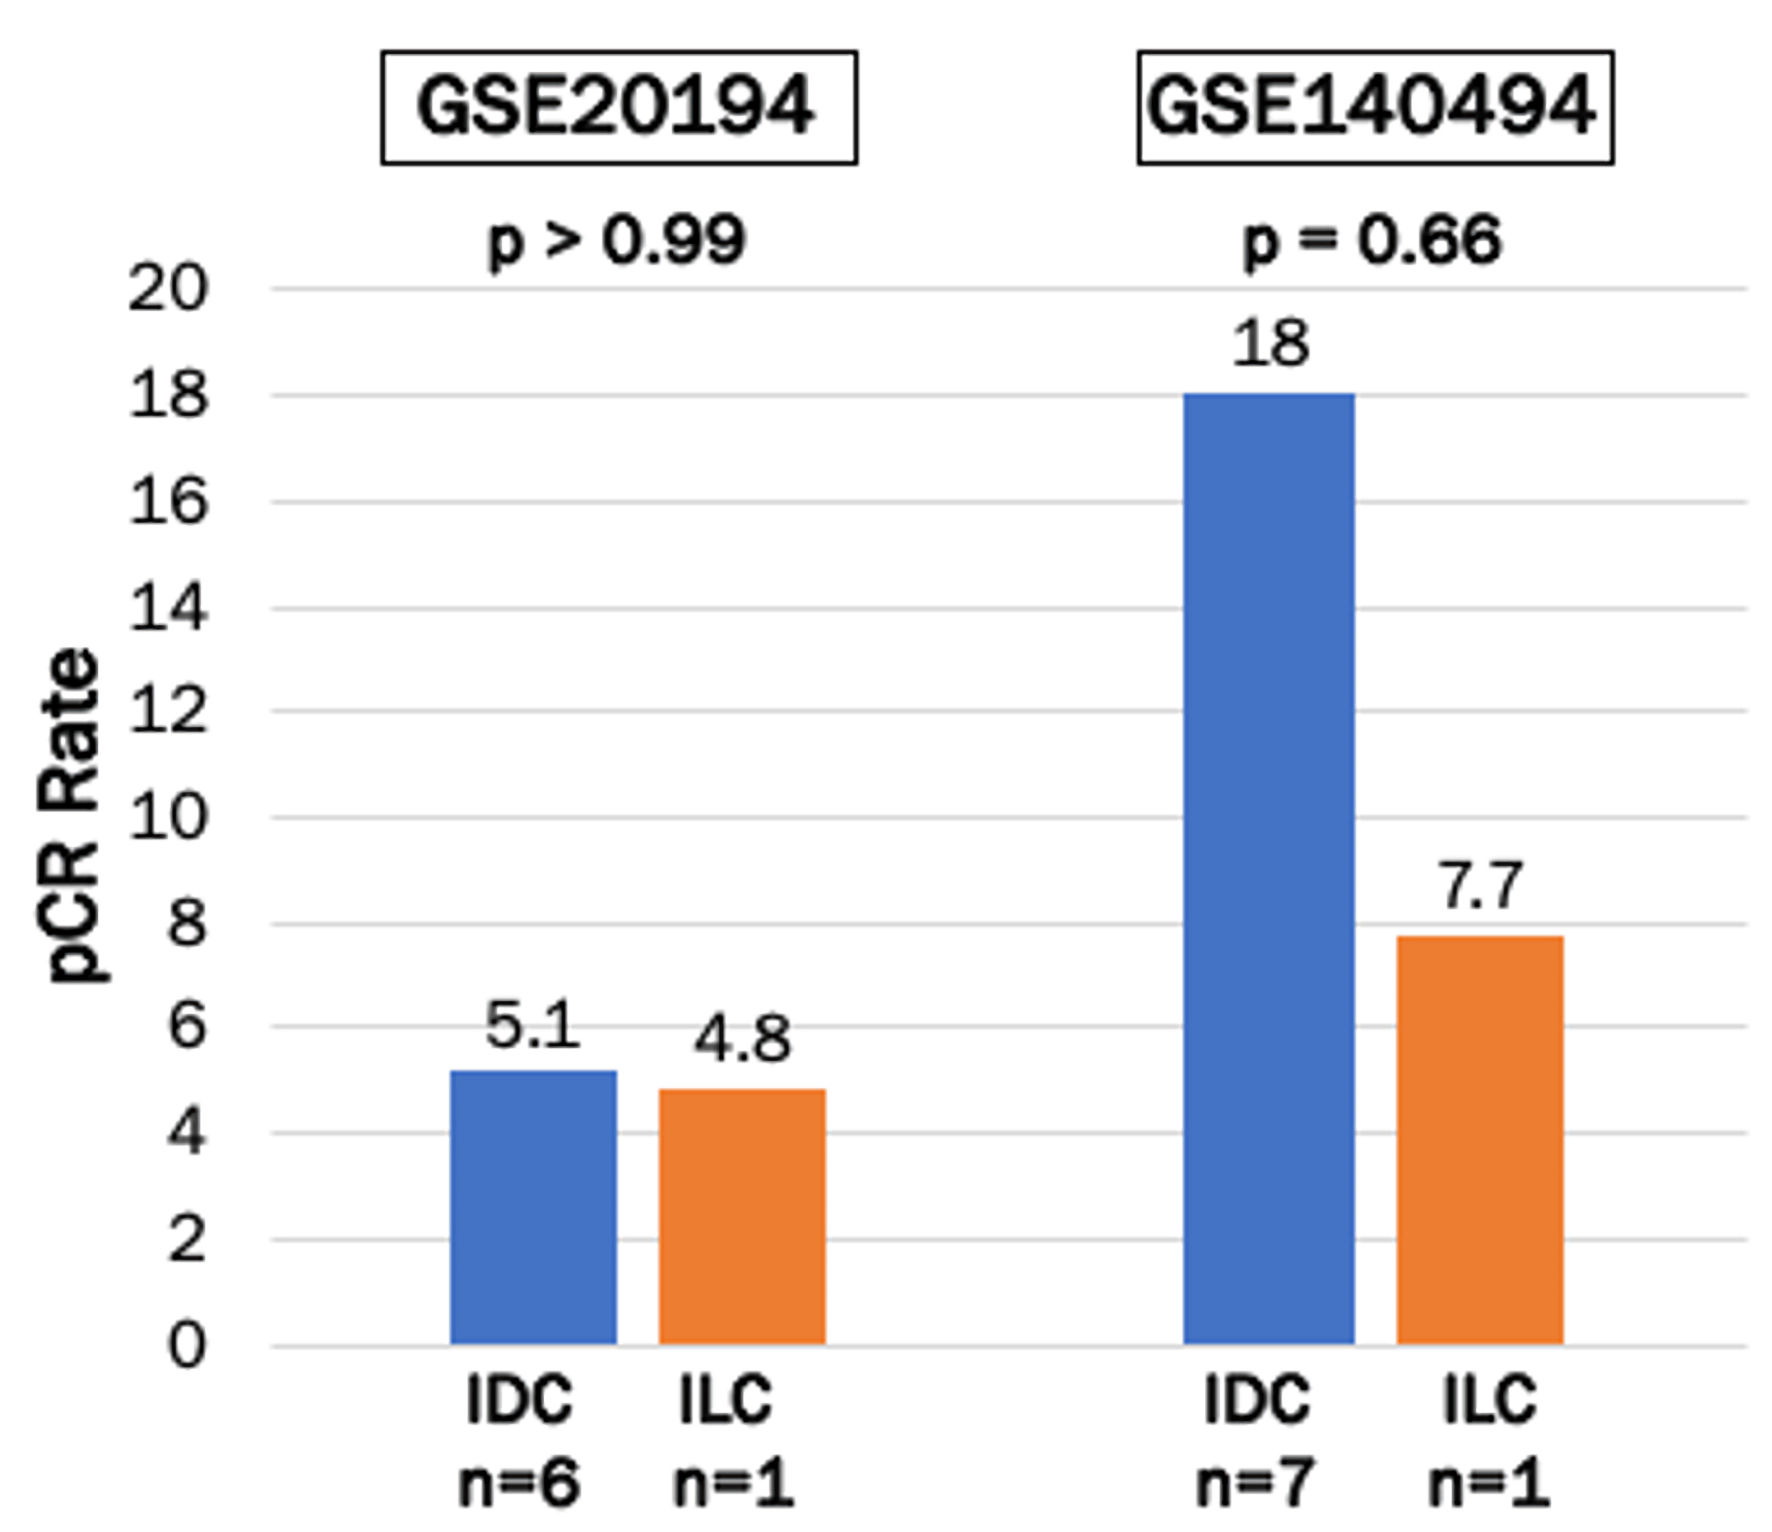
↓ Figure 5. Pathological clinical response (pCR)
to neoadjuvant chemotherapy in ER-positive/HER2-negative IDC and ILC in GSE20194 and GSE140494 cohorts.
Bar plots show pCR rates after neoadjuvant chemotherapy in ER-positive/HER2-negative IDC and ILC breast
cancers in GSE20194 (n = 138) and GSE140494 (n = 51) cohorts. IDC were represented by the blue bars, and
ILC were represented by the orange bars. Fisher’s exact test was used to calculate P values. ER:
estrogen receptor; HER2: human epidermal growth factor receptor 2; IDC: invasive ductal carcinoma; ILC:
invasive lobular carcinoma.
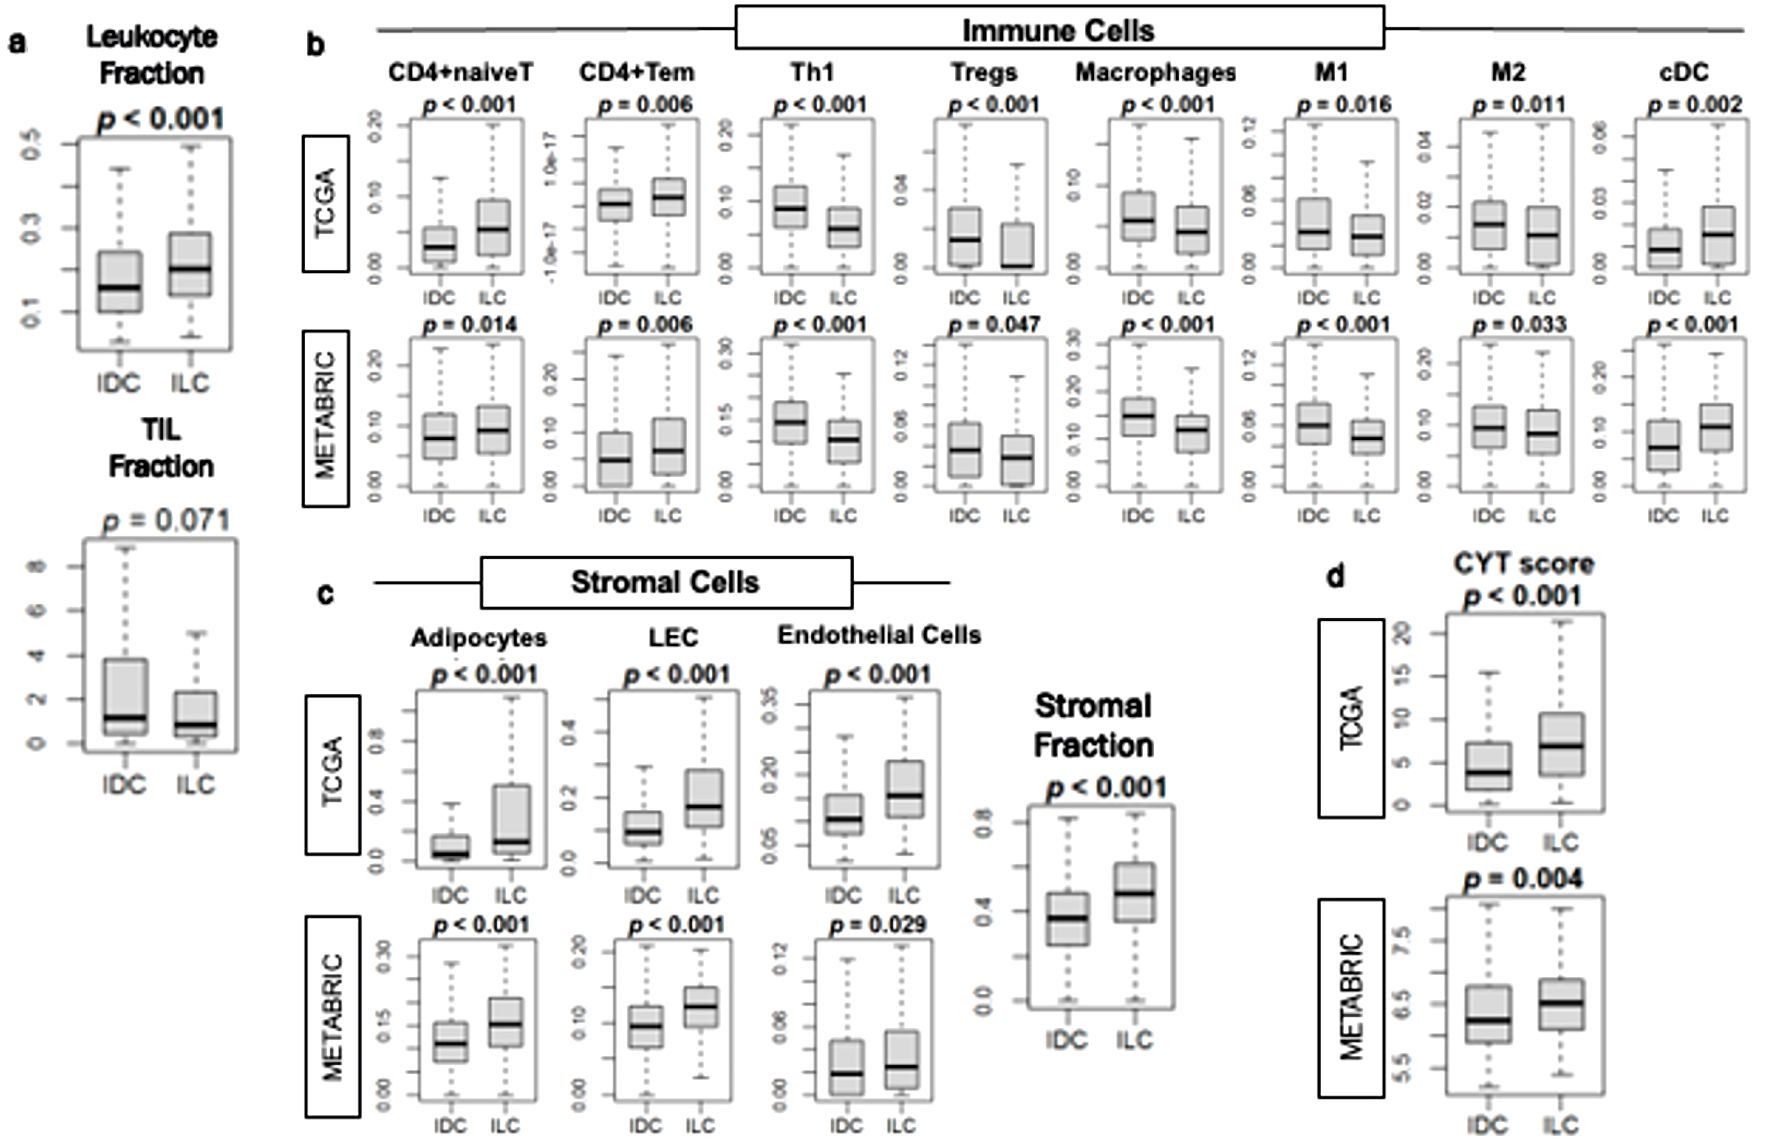
↓ Figure 6. Immune response in
ER-positive/HER2-negative IDC and ILC breast cancer tumor microenvironment. (a) Box plots of leukocyte
fraction and tumor-infiltrating lymphocytes (TIL) regional fraction in the TCGA cohort. (b) Box plots of
immune cells, including naive CD4 T cells (CD4+naiveT), effector memory CD4 T cells (CD4+Tem), T helper
type 1 (Th1), regulatory T cells (Tregs), macrophages, M1 and M2 macrophages, and dendritic cells (cDC),
in the TCGA and METABRIC cohorts. (c) Box plot of stromal cells, including adipocytes, lymphatic
endothelial cells (LEC) and endothelial cells in the TCGA and METABRIC cohorts. Box plot of stromal
fraction using the TCGA cohort. (d) Box plots of cytolytic activity (CYT) score in TCGA and METABRIC
cohorts. Mann-Whitney U test was used to determine P values. IDC: invasive ductal carcinoma; ILC:
invasive lobular carcinoma.