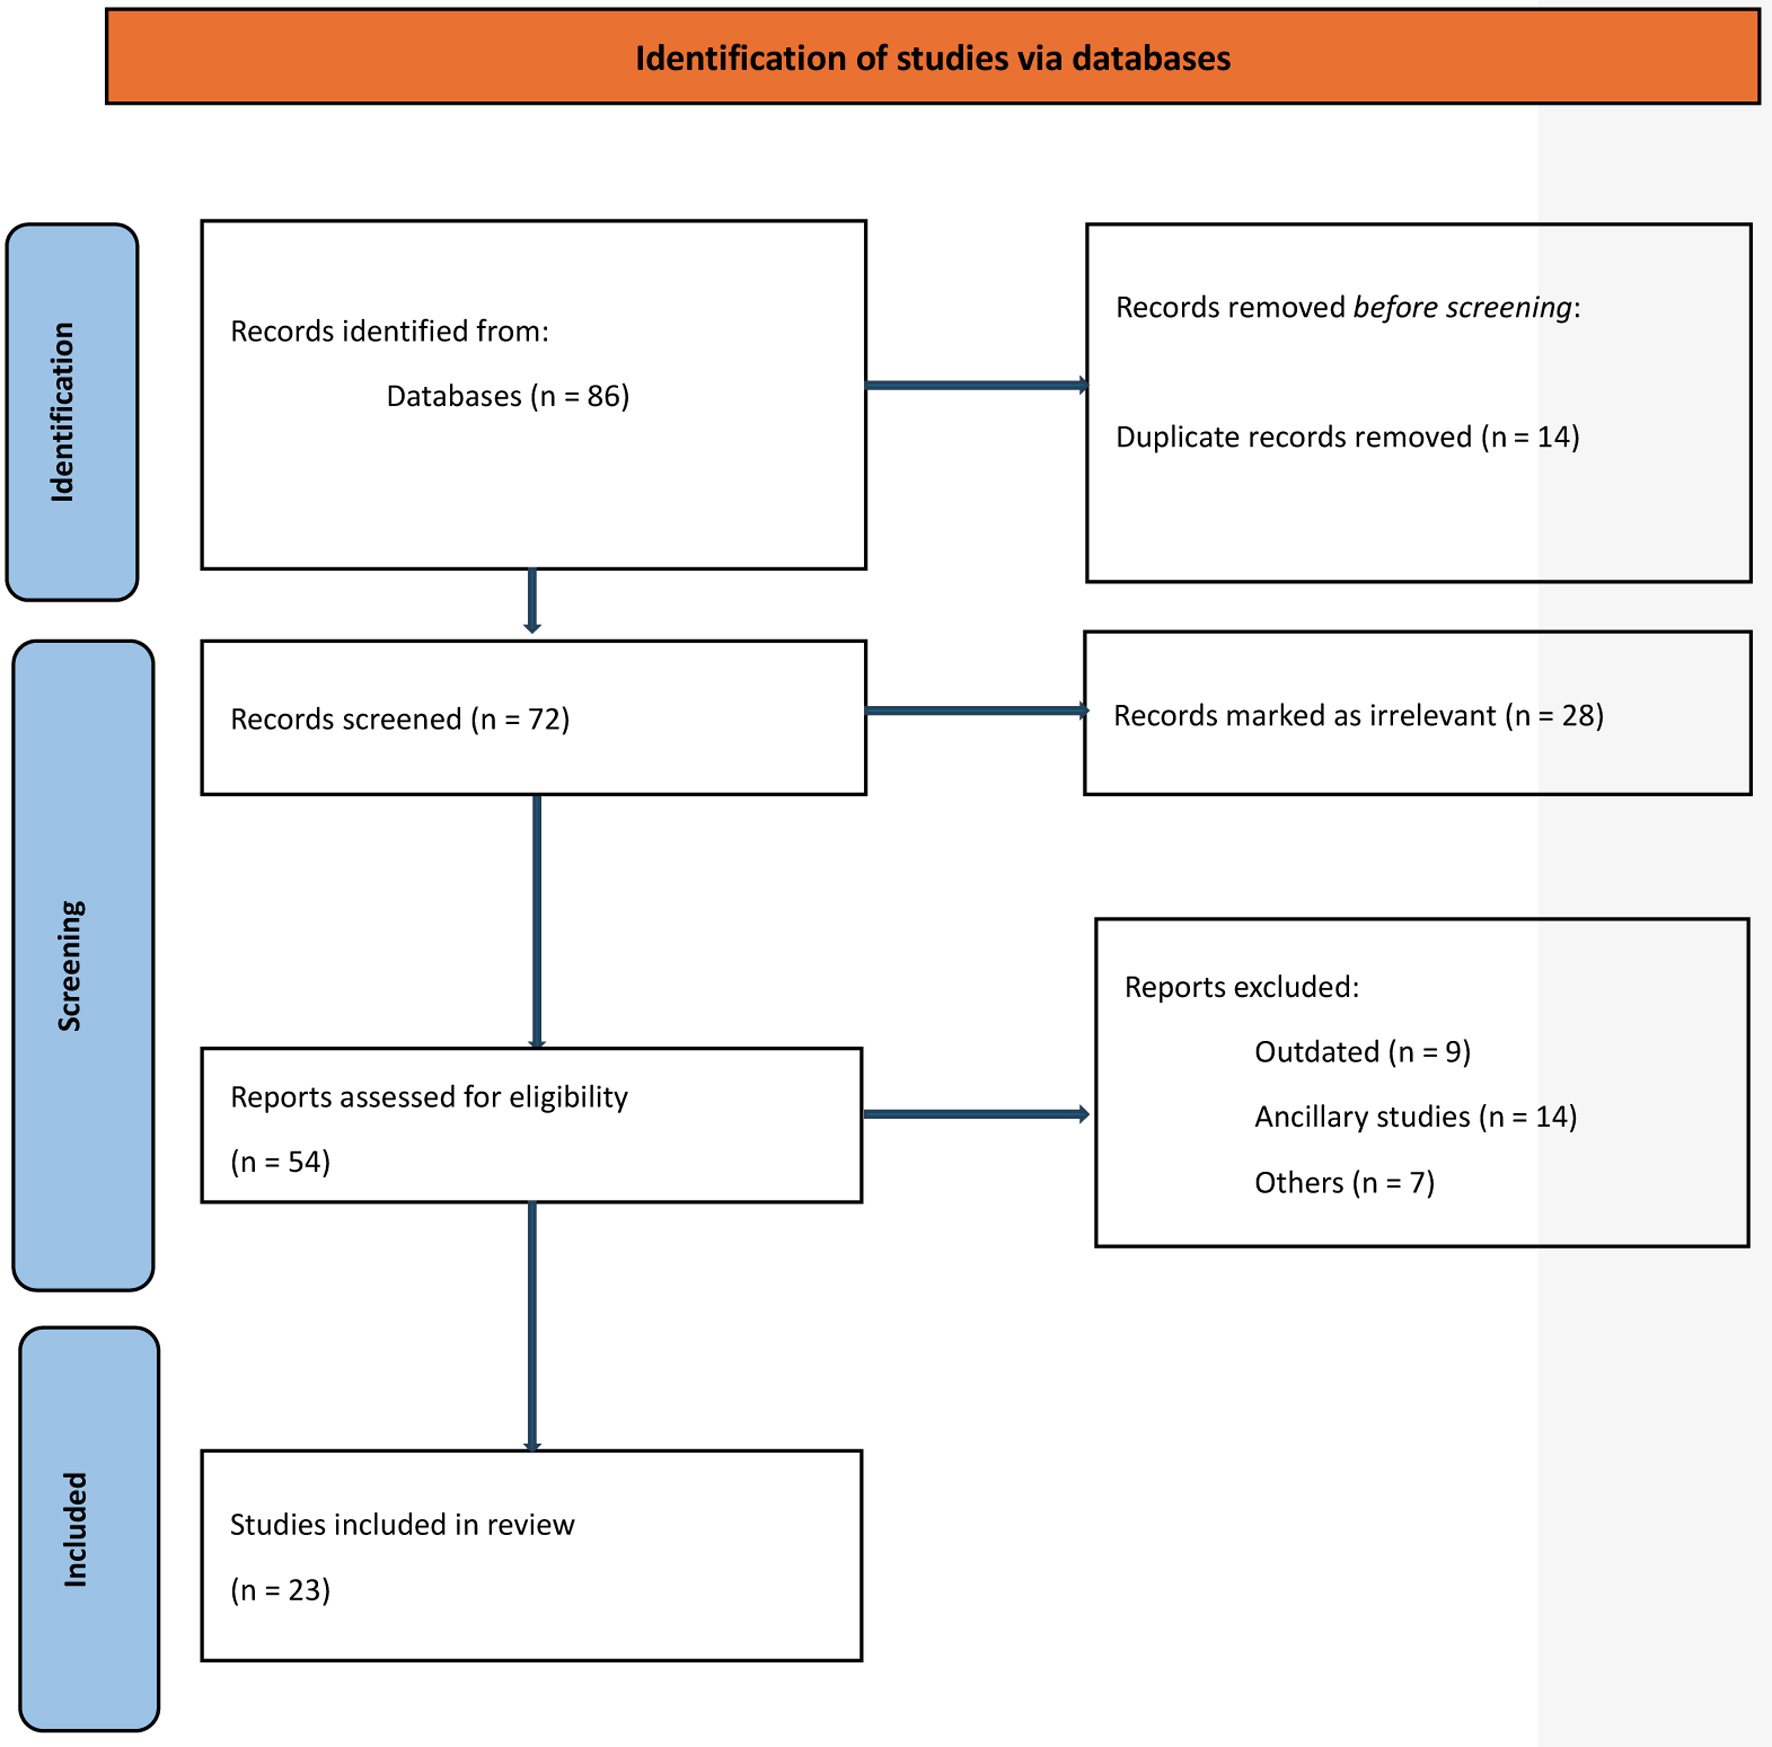
↓ Figure 1. Study selection schema.
| World Journal of Oncology, ISSN 1920-4531 print, 1920-454X online, Open Access |
| Article copyright, the authors; Journal compilation copyright, World J Oncol and Elmer Press Inc |
| Journal website https://wjon.elmerpub.com |
Original Article
Volume 16, Number 3, June 2025, pages 299-310
Anti-Programmed Cell Death-1 Versus Anti-Programmed Death-Ligand 1 (PD-L1) in PD-L1-Negative Advanced Non-Small Cell Lung Cancer: A Systematic Review and Meta-Analysis
Figures
Tables
| Reference | Authors | Year | Histological subtype | Line of therapy | Class | Experimental arm | Control arm | Sample size (PD-L1) negative | ITT group | Hazard ratio (PFS) | 95% CI | Hazard ratio (OS) | 95% CI |
|---|---|---|---|---|---|---|---|---|---|---|---|---|---|
| CI: confidence interval; ITT: intension to treat; NSCLC: non-small cell lung cancer; OS: overall survival; PD-1: programmed cell death-1; PD-L1: programmed death-ligand 1; PFS: progression-free survival. | |||||||||||||
| KEYNOTE-189 [23] | Gandli et al | 2018 | Non-squamous NSCLC | First line | PD-1 | Pembrolizumab + pemetrexed and a platinum-based drug | Placebo + pemetrexed and a platinum-based drug | 190 | 616 | 0.75 | 0.53 - 1.05 | 0.59 | 0.38 - 0.92 |
| KEYNOTE-407 [24] | Paz-Ares et al | 2018 | Squamous NSCLC | First line | PD-1 | Pembrolizumab plus chemotherapy (carboplatin and either paclitaxel or nab-paclitaxel) | Placebo + chemotherapy (carboplatin and either paclitaxel or nab-paclitaxel) | 194 | 559 | 0.68 | 0.47 - 0.98 | 0.61 | 0.38 - 0.98 |
| KEYNOTE-021 [20] | Langer et al | 2016 | Non-squamous NSCLC | First line | PD-1 | Pembrolizumab plus pemetrexed plus carboplatin | Placebo + pemetrexed plus carboplatin | 44 | 123 | 0.35 | 0.17 - 0.72 | 0.54 | 0.26 - 1.13 |
| ARCTIC [25] | Planchard et al | 2020 | NSCLC (study B) | Later line | PD-L1 | Durvalumab with or without Tremelimumab | Gemcitabine/vinorelbine and erlotinib | 110 | 489 | 0.76 | 0.51 - 1.15 | 0.8 | 0.53 - 1.22 |
| MYSTIC [26] | Rizvi et al | 2020 | NSCLC | First line | PD-L1 | Durvalumab | Paclitaxel/gemcitabine + platinum (squamous) or pemetrexed + platinum for (non-squamous) | 178 | 1,118 | N/A | N/A | 1.2 | 0.86 - 1.6 |
| POSEIDON [27] | Johnson et al | 2023 | NSCLC | First line | PD-L1 | Durvalumab + chemotherapy | Chemotherapy | 243 | 1,013 | N/A | N/A | 0.99 | 0.76 - 1.3 |
| CheckMate 017 [19] | Brahmer et al | 2015 | Squamous NSCLC | Later line | PD-1 | Nivolumab | Chemotherapy (docetaxel) | 106 | 272 | 0.66 | 0.43 - 1 | 0.58 | 0.37 - 0.92 |
| CheckMate 057 [28] | Borghaei et al | 2015 | Non-squamous NSCLC | Later line | PD-1 | Nivolumab | Chemotherapy (docetaxel) | 109 | 582 | 1.19 | 0.88 - 1.61 | 0.9 | 0.66 - 1.24 |
| CheckMate 227 [18] | Hellmann et al | 2019 | NSCLC | First line | PD-1 | Nivolumab + chemotherapy | Chemotherapy | 550 | 1,739 | 0.73 | 0.56 - 0.95 | 0.78 | 0.6 - 1.02 |
| IMpower 131 [29] | Jotte et al | 2020 | squamous NSCLC | First line | PD-L1 | Atezolizumab + carboplatin + paclitaxel/nab-paclitaxel | Carboplatin + paclitaxel/nab-paclitaxel | 500 | 1,021 | 0.82 | 0.65 - 1.04 | 0.87 | 0.67 - 1.13 |
| IMpower 150 [30] | Socinski et al | 2018 | Non-squamous NSCLC | First line | PD-L1 | Atezolizumab plus bevacizumab plus carboplatin plus paclitaxel (ABCP) | Bevacizumab plus carboplatin plus paclitaxel (BCP) | 338 | 800 | 0.77 | 0.61 - 0.99 | 0.81 | 0.61 - 1.07 |
| OAK [31] | Rittmeyer et al | 2017 | NSCLC | Later line | PD-L1 | Atezolizumab | Docetaxel | 379 | 850 | 1 | 0.8 - 1.25 | 0.75 | 0.59 - 0.96 |
| PROLUNG [32] | Arrieta et al | 2020 | NSCLC | Later line | PD-1 | Pembrolizumab + docetaxel | Docetaxel | 30 | 78 | 0.41 | 0.16 - 1.95 | N/A | N/A |
| CCTG BR34 [33] | Leighl et al | 2022 | NSCLC | First line | PD-L1 | Durvalumab + tremelimumab | Durvalumab + tremelimumab + platinum doublet | 116 | 301 | 1.61 | 1.08 - 2.5 | 1.06 | 0.7 - 1.6 |
| ONO-4538-52/TASUKI-52 [21] | Sugawara et al | 2021 | Non- squamous NSCLC | First line | PD-1 | Nivolumab + chemotherapy | Carboplatin + paclitaxel + bevacizumab | 240 | 550 | 0.56 | 0.43 - 0.71 | 0.85 | 0.63 - 1.21 |
| CheckMate 9LA [34] | Paz-Ares et al | 2021 | NSCLC | First line | PD-1 | Nivolumab + ipilimumab + chemotherapy | Chemotherapy | 264 | 719 | 0.69 | 0.52 - 0.91 | 0.67 | 0.51 - 0.87 |
| IMpower 132 [35] | Nishio et al | 2021 | NSCLC | First line | PD-L1 | Atezolizumab plus carboplatin or cisplatin plus pemetrexed (APP) | Carboplatin or cisplatin plus pemetrexed | 163 | 578 | 0.45 | 0.31 - 0.64 | 0.67 | 0.46 - 0.96 |
| CHOICE-01 [36] | Wang et al | 2023 | NSCLC | First line | PD-1 | Toripalimab | Placebo + chemotherapy (nab-paclitaxel + carboplatin | 139 | 465 | 0.47 | 0.32 - 0.71 | 0.79 | 0.49 - 1.31 |
| EMPOWER-Lung 3 Part 2 [37] | Makharadze et al | 2023 | NSCLC | First line | PD-1 | Cemiplimab plus chemotherapy | Placebo plus chemotherapy | 139 | 466 | 0.76 | 0.51 - 1.15 | 1.01 | 0.63 - 1.6 |
| RATIONALE 304 [38] | Lu et al | 2021 | Non-squamous NSCLC | First line | PD-1 | Chemotherapy | Tislelizumab and chemotherapy | 144 | 334 | 0.758 | 0.469 - 1.224 | ||
| CameL [39] | Xie et al | 2022 | Non-squamous NSCLC | First line | PD-1 | Camrelizumab plus carboplatin and pemetrexed | Carboplatin and pemetrexed | 92 | 412 | 0.75 | 0.5 - 1.13 | 0.84 | 0.55 - 1.27 |
| CameL-sq [40] | Ren et al | 2022 | Squamous NSCLC | First line | PD-1 | Carboplatin plus paclitaxel with camrelizumab | Carboplatin plus paclitaxel with placebo | 188 | 398 | 0.49 | 0.35 - 0.68 | 0.62 | 0.41 - 0.94 |
| POPLAR [22] | Fehrenbacher et al | 2016 | NSCLC | Later line | PD-L1 | Atezolizumab | Docetaxel | 92 | 287 | 0.88 | 0.55 - 1.4 | ||
| Agent subclass | PD-L1 | PD-1 | Differential efficacy | ||||||
|---|---|---|---|---|---|---|---|---|---|
| HR | 95% CI | P-value | HR | 95% CI | P-value | HR | 95% CI | P-value | |
| CI: confidence interval; HR: hazard ratio; NSCLC: non-small cell lung cancer; OS: overall survival; PD-1: programmed cell death-1; PD-L1: programmed death-ligand 1; PFS: progression-free survival. | |||||||||
| OS | |||||||||
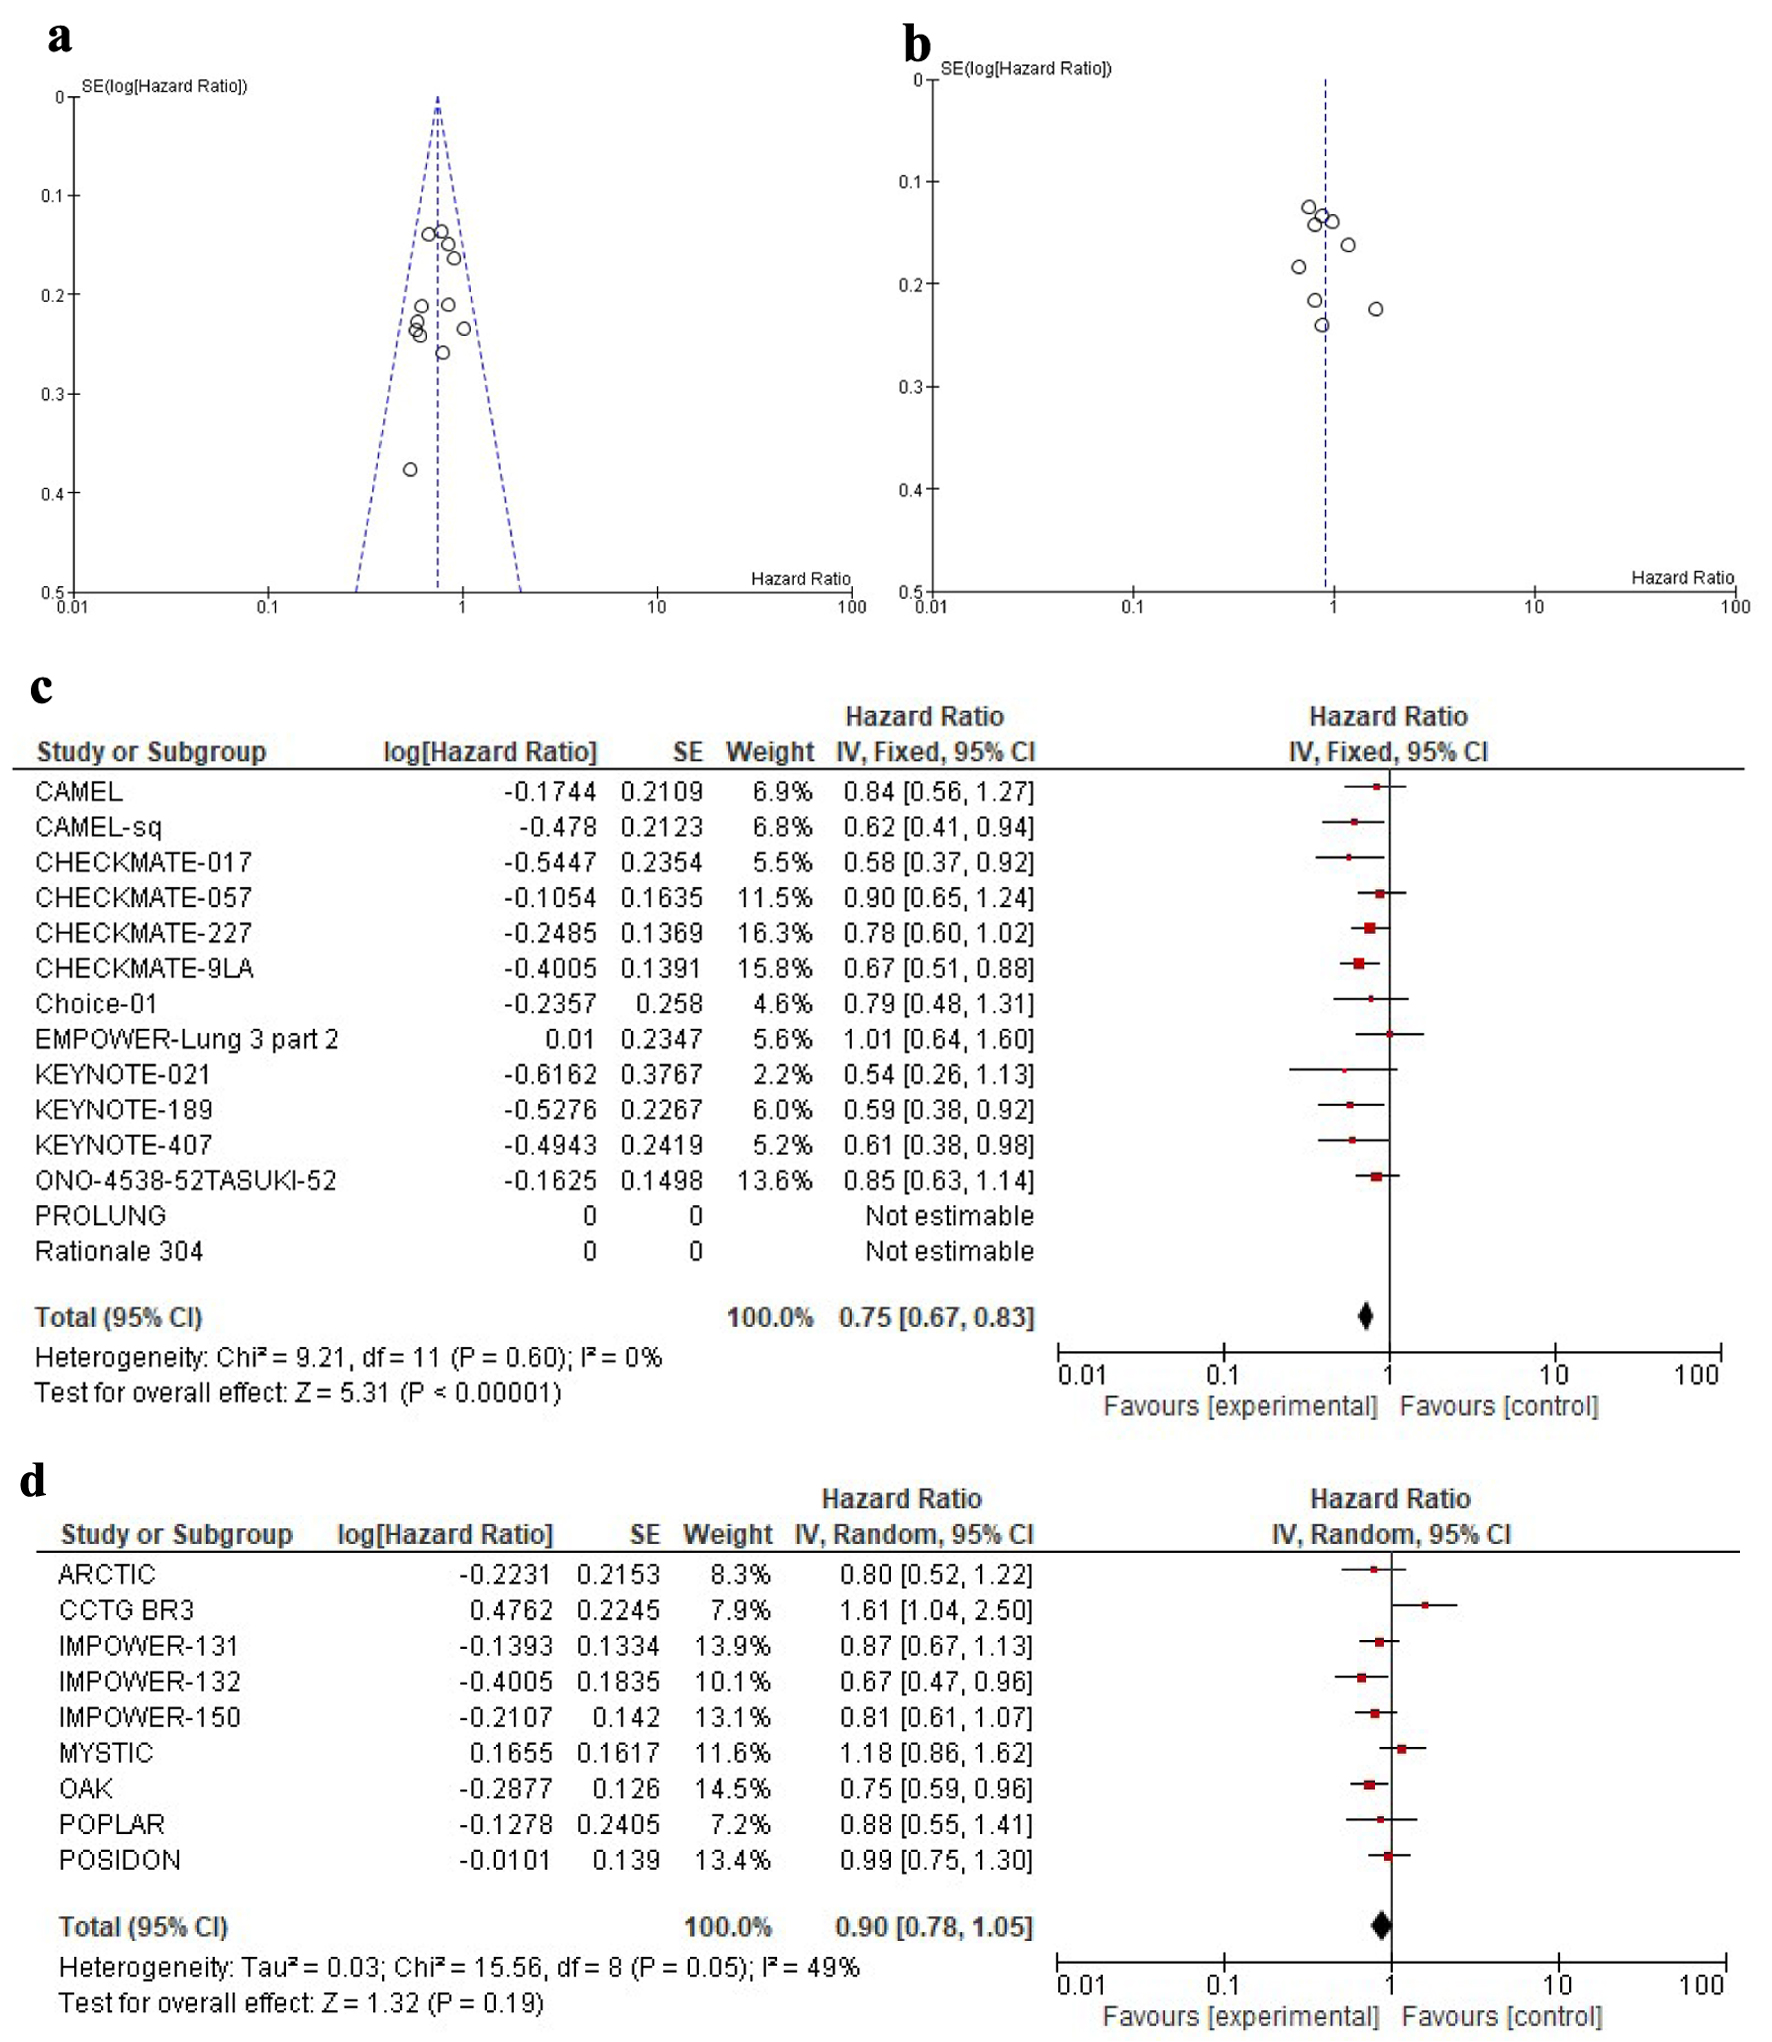
| Overall | 0.90 | 0.78 - 1.05 | 0.18 | 0.75 | 0.67 - 0.83 | < 0.01 | 0.83 | 0.67 - 0.99 | 0.01 |
| First line | 0.94 | 0.83 - 1.07 | 0.34 | 0.74 | 0.66 - 0.83 | < 0.01 | 0.79 | 0.66 - 0.93 | 0.01 |
| Later lines | 0.78 | 0.64 - 0.95 | 0.01 | 0.88 | 0.69 - 1.13 | 0.31 | 1.13 | 0.82 - 1.55 | 0.45 |
| PFS | |||||||||
| Overall | 0.83 | 0.64 - 1.08 | 0.16 | 0.73 | 0.6 - 0.88 | < 0.01 | 0.88 | 0.64 - 1.2 | 0.42 |
| First line | 0.76 | 0.64 - 0.91 | < 0.01 | 0.64 | 0.58 - 0.71 | < 0.01 | 0.84 | 0.68 - 1.03 | 0.09 |
| Later lines | 0.94 | 0.77 - 1.14 | 0.53 | 1 | 0.8 - 1.26 | 1 | 1.06 | 0.78 - 1.43 | 0.70 |
| Histological subtype | Squamous | Non-squamous | ||||
|---|---|---|---|---|---|---|
| HR | 95% CI | P-value | HR | 95% CI | P-value | |
| CI: confidence interval; HR: hazard ratio; OS: overall survival; PD-1: programmed cell death-1; PD-L1: programmed death-ligand 1. | ||||||
| PD-1 (OS) | 0.60 | 0.47 - 0.78 | < 0.01 | 0.79 | 0.65 - 0.95 | 0.01 |
| PD-L1 (OS) | 0.87 | 0.67 - 1.13 | 0.29 | 0.81 | 0.61 - 1.07 | 0.14 |