Figures
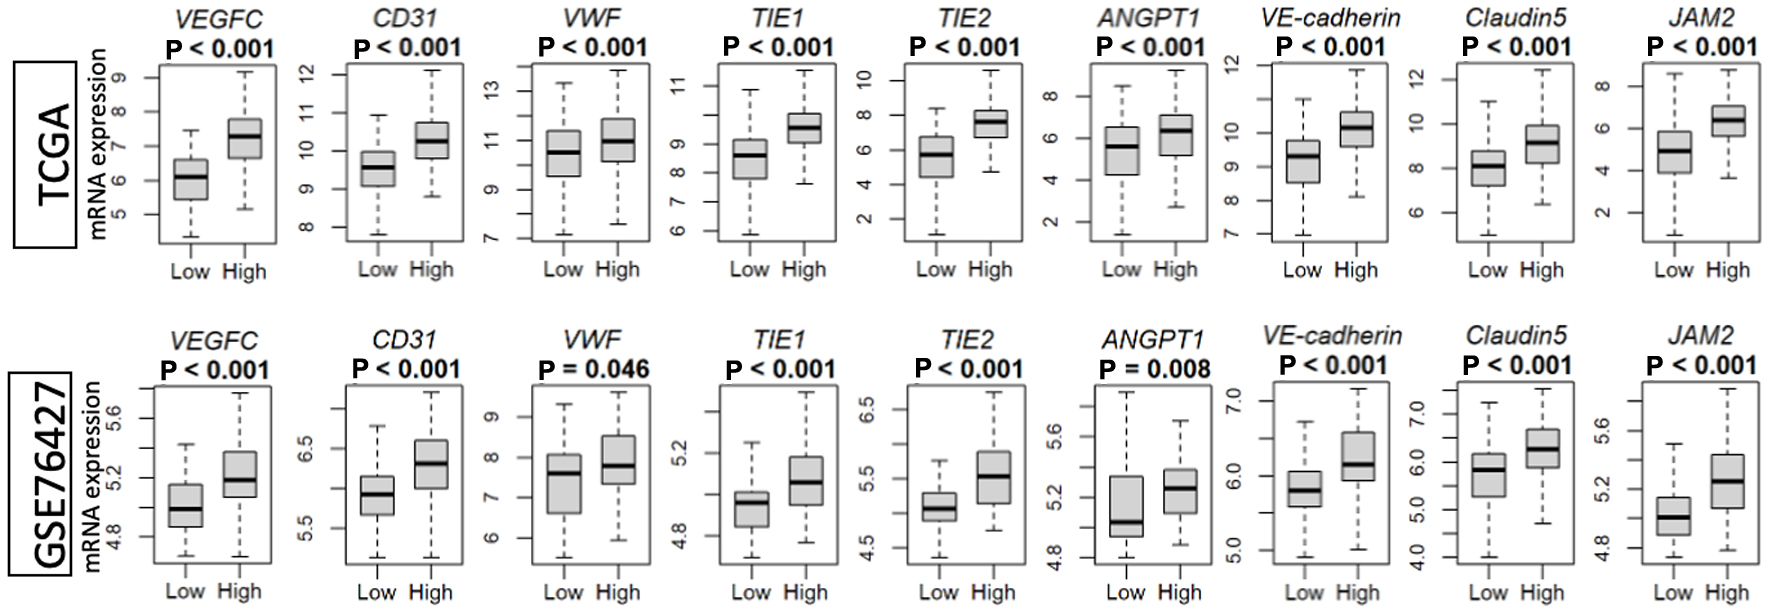
↓ Figure 1. Intra-tumoral angiogenesis score
correlates with the expression of VEGF (VEGFC)-, endothelial cell marker (CD31 and VWF)-, and vascular
stability (TIE1 and 2, ANGPT1, VE-cadherin, CLDN5 and JAM2)-related genes in the TCGA and GSE76427
cohorts. High versus low, median angiogenesis pathway score. ANGPT1: angiopoietin 1; CD31/PECAM-1:
platelet endothelial cell adhesion molecule; CLDN5: Claudin5; JAM2: junction adhesion molecule 2; TIE1
and 2: tyrosine kinase with immunoglobulin-like and epidermal growth factor-like domains 1 and 2;
VE-cadherin/CD144: vascular endothelial cadherin; VEGF: vascular endothelial growth factor; VWF: von
Willebrand factor.
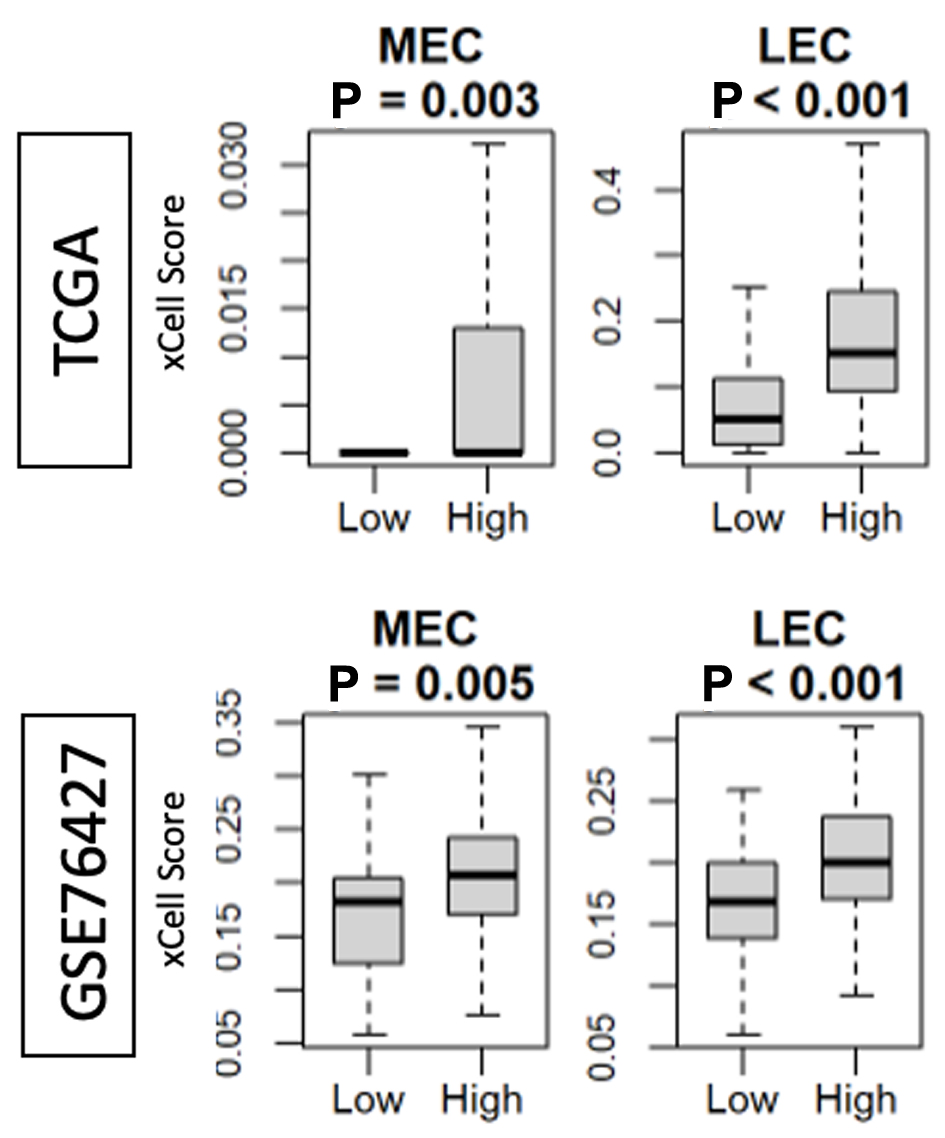
↓ Figure 2. Intra-tumoral angiogenesis score
correlates with the presence of MEC and LEC in the TCGA and GSE76427 cohorts. High versus low, median
angiogenesis pathway score. MEC: microvascular endothelial cell; LEC: lymphatic endothelial cell.
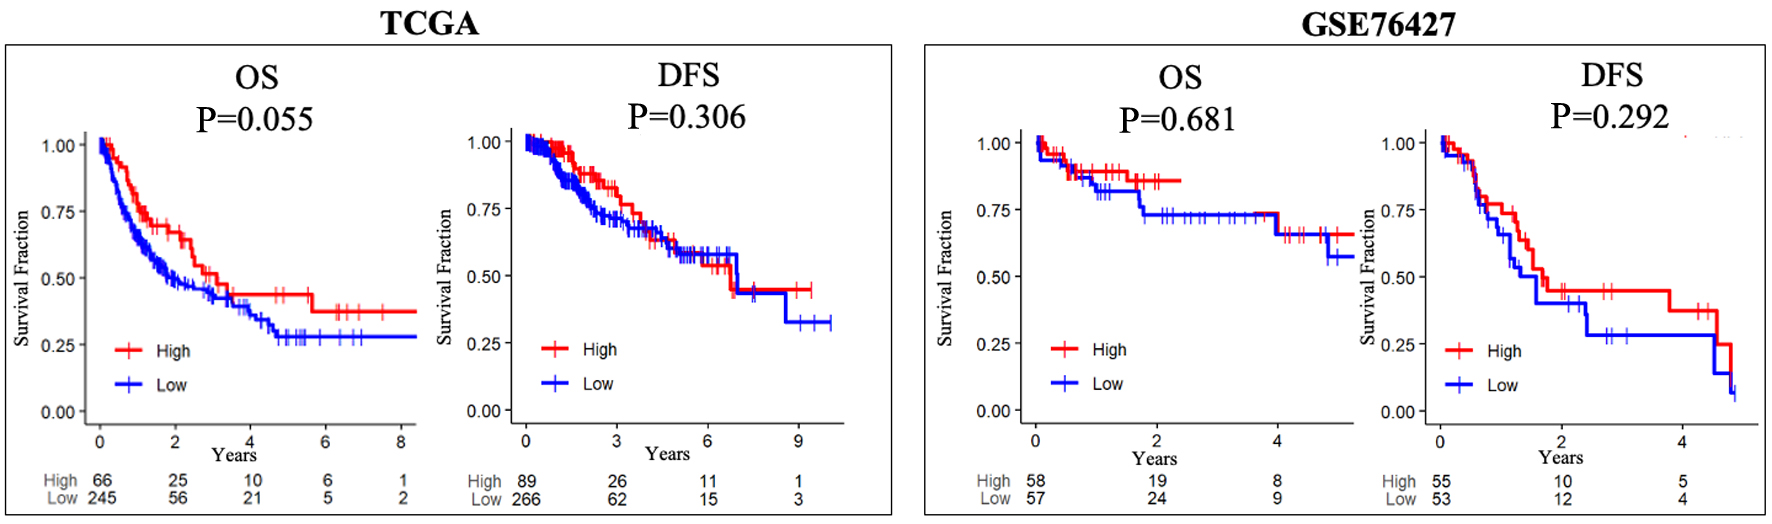
↓ Figure 3. Intra-tumoral angiogenesis score
does not correlate with OS or DFS in either the TCGA and GSE76427 cohorts. High versus low, median
angiogenesis pathway score. DFS: disease-free survival; OS: overall survival.
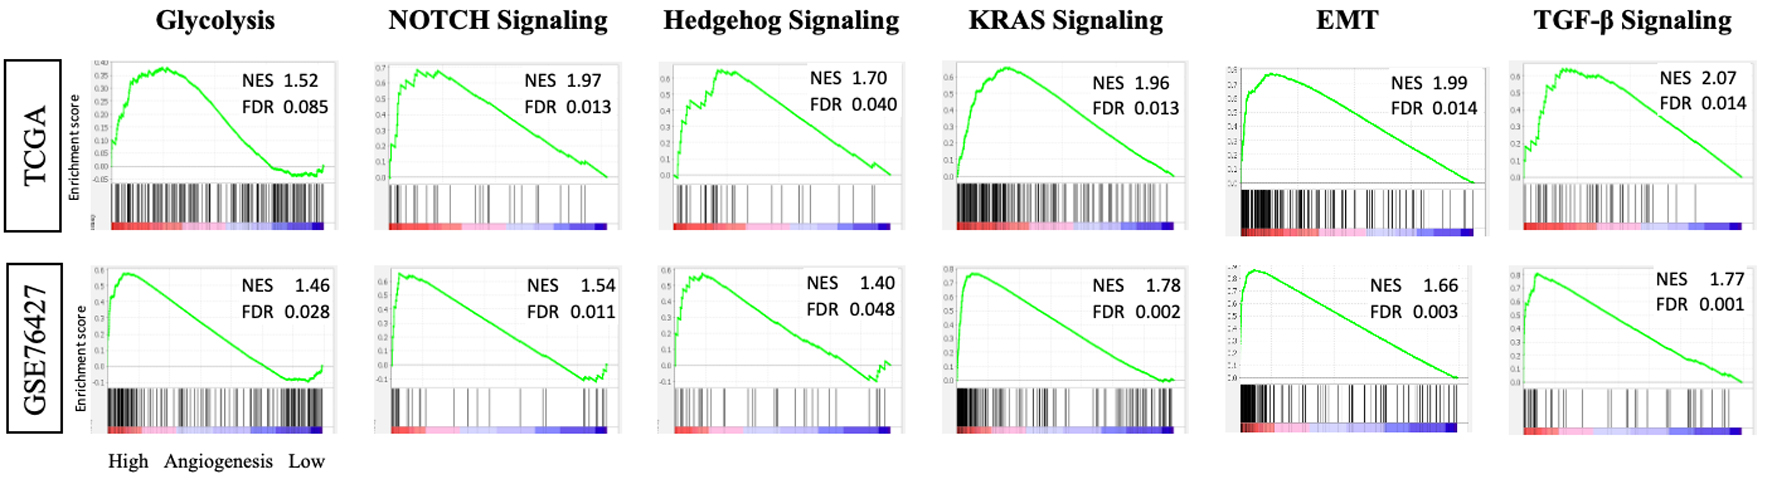
↓ Figure 4. Tumors with high intra-tumoral
angiogenesis score demonstrate enrichment of pro-tumor gene sets in the TCGA and GSE76427 cohorts. GSEA
with NES and FDR for glycolysis, Notch signaling, Hedgehog signaling, KRAS signaling, EMT, and
TGF-β signaling. EMT: epithelial mesenchymal transition; FDR: false discovery rate; GSEA: Gene Set
Enrichment Analysis; NES: normalized enrichment score; TGF-β: transforming growth factor-beta.
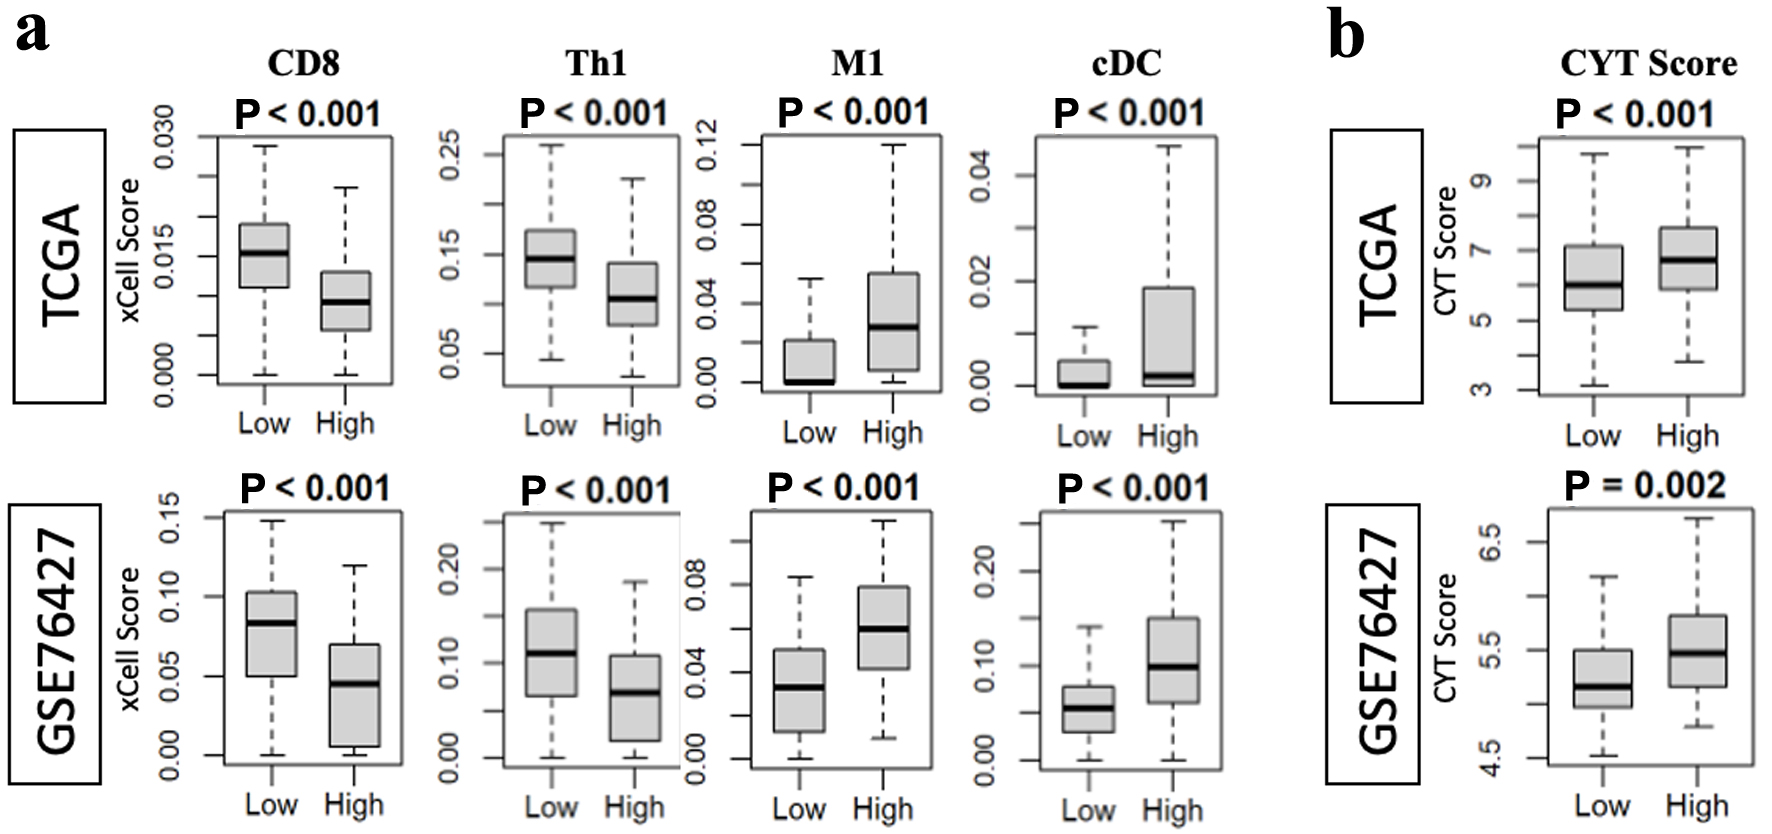
↓ Figure 5. High angiogenesis score is associated
with increased CYT in both the TCGA and GSE76427 cohorts, while pro-and anti-tumor infiltrating immune
cells showed variable presence. (a) CD8 and Th1 infiltration was associated with low angiogenesis score
while M1 macrophages and cDC infiltration was associated with high angiogenesis score. (b) CYT score was
correlated with tumors which had high angiogenesis score. cDC: conventional dendritic cell; CYT:
cytolytic activity.
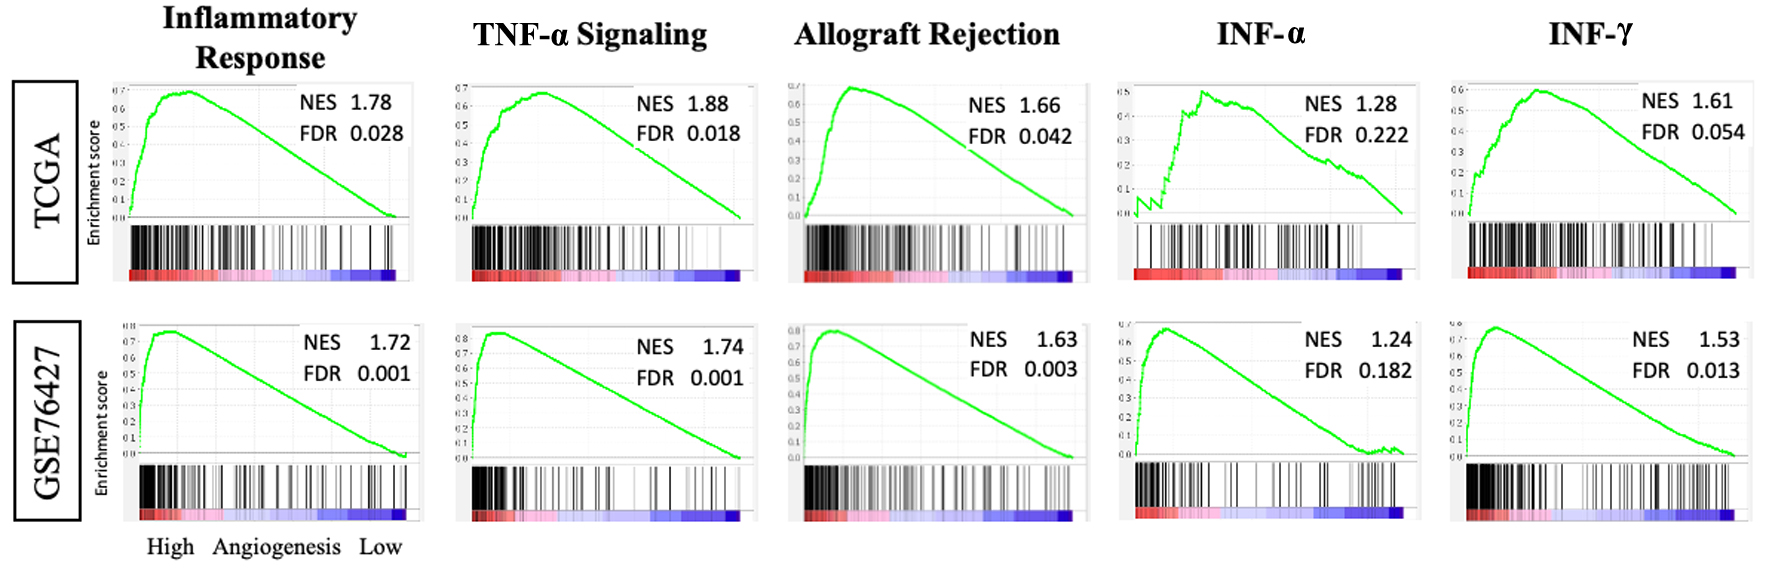
↓ Figure 6. Tumors with high intra-tumoral
angiogenesis score demonstrate enrichment of inflammatory response gene sets in the TCGA and GSE76427
cohorts. GSEA with NES and FDR for inflammatory response, TNF-α, allograft rejection, INF-α
and γ. FDR: false discovery rate; GSEA: Gene Set Enrichment Analysis; INF-α and γ:
interferon-alpha and gamma; NES: normalized enrichment score; TNF-α: tumor necrosis
factor-alpha.
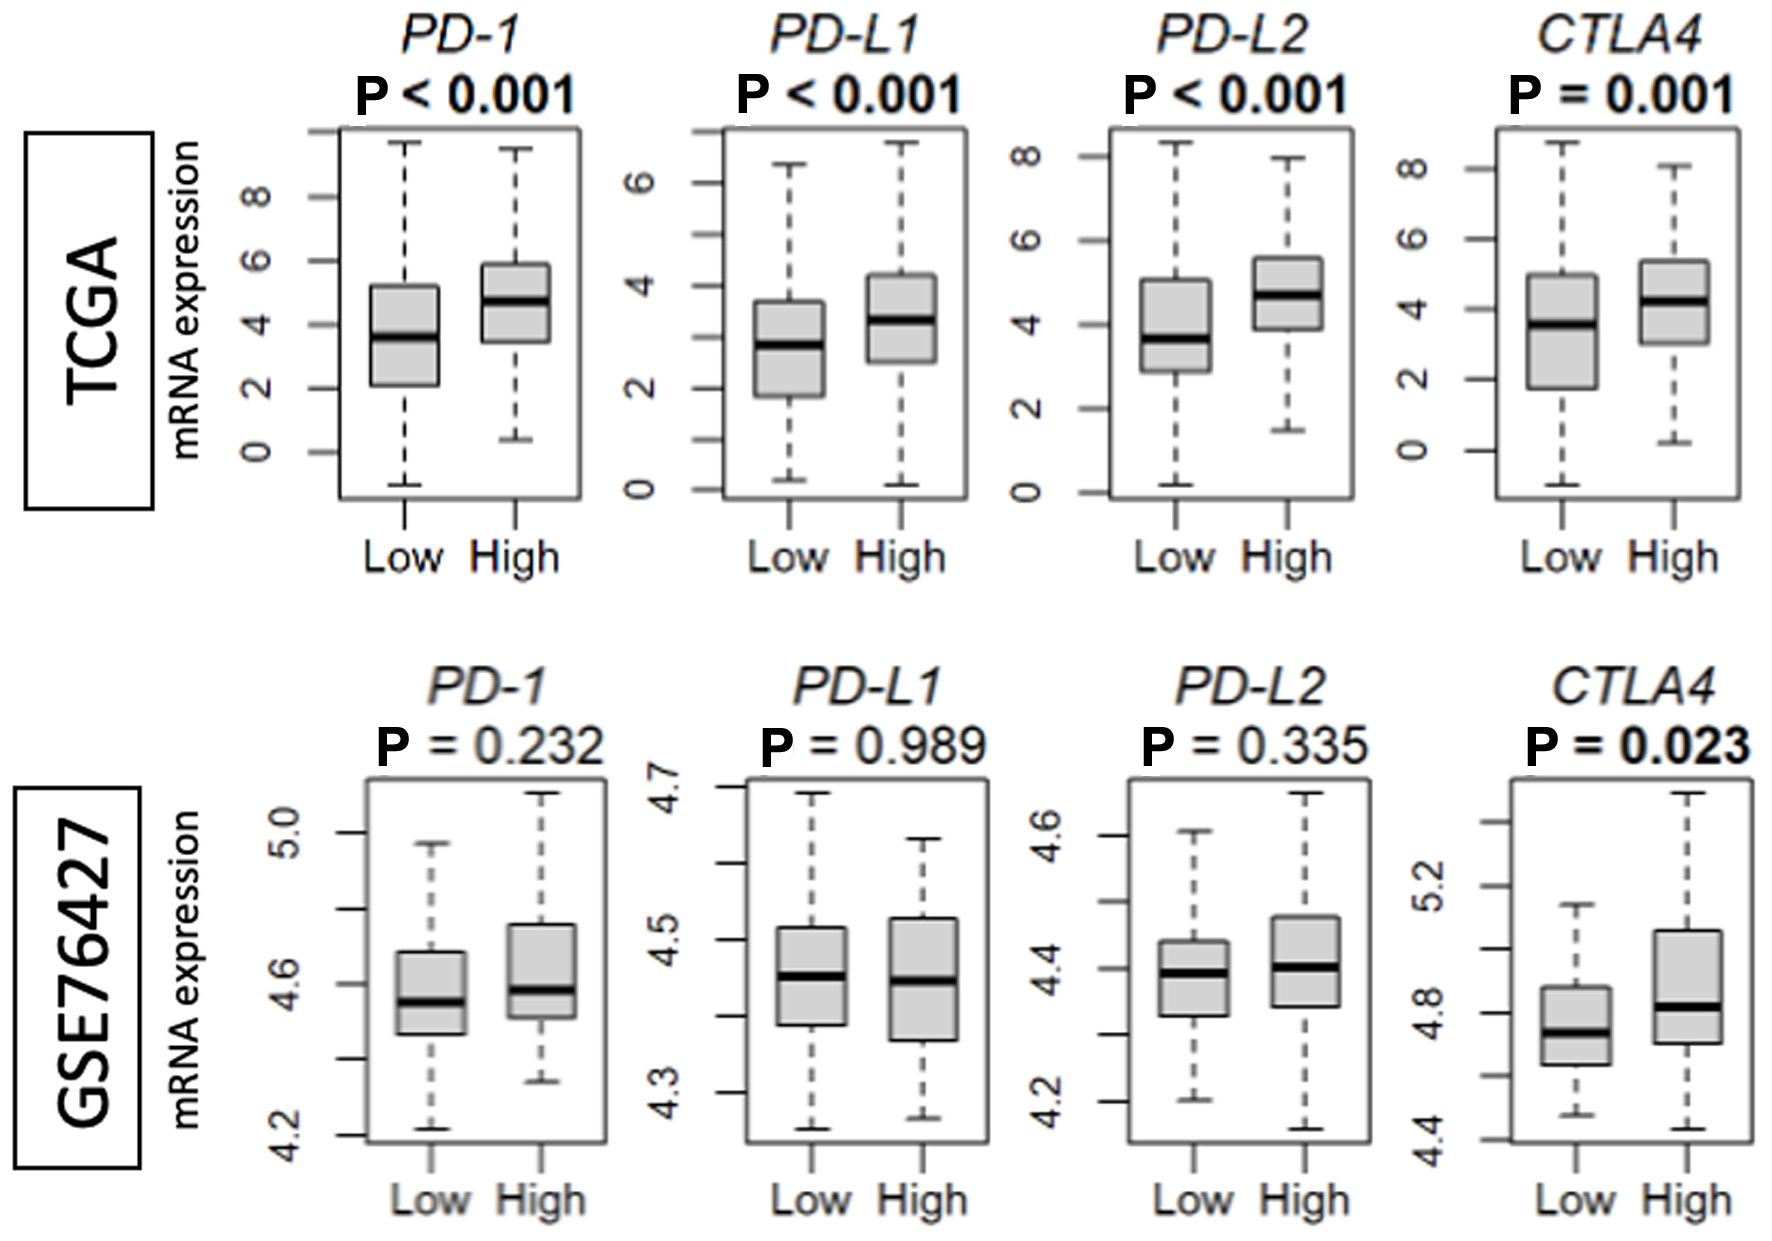
↓ Figure 7. Intra-tumoral angiogenesis score
correlates with checkpoint marker expression in the TCGA and GSE76427 cohorts. High versus low, median
angiogenesis pathway score. PD1: programmed cell death protein 1; PD-L1 and 2: programmed death ligand 1
and 2; CTLA-4/CD152: cytotoxic T lymphocyte-associated protein 4.