Figures
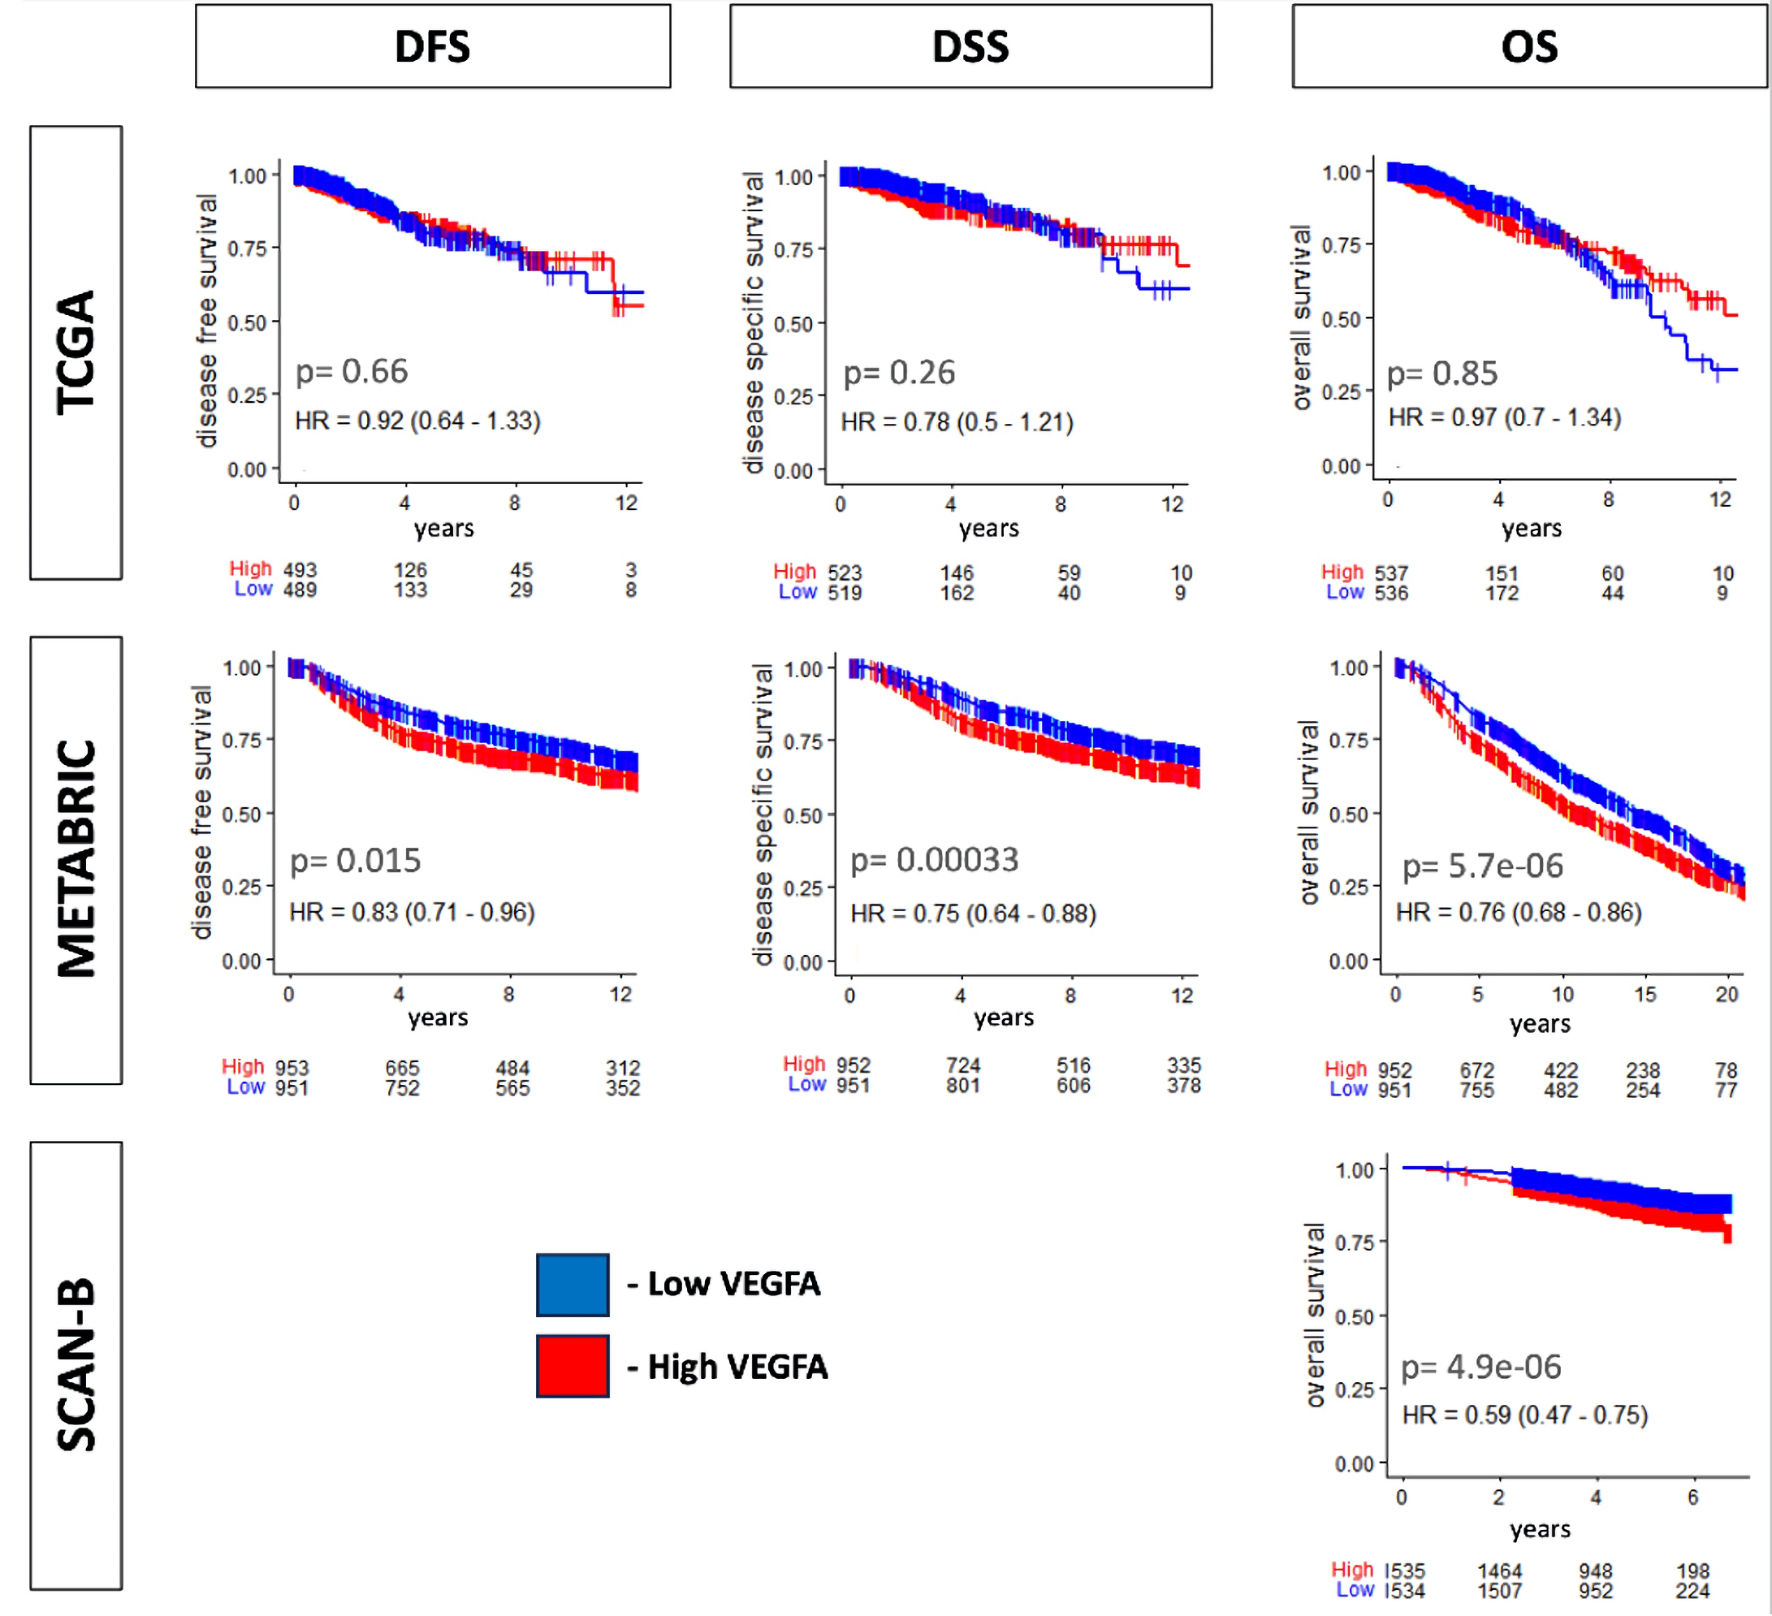
↓ Figure 1. Survival relevance for VEGFA
expression. Kaplan-Meier curve with log-rank P value of disease-free survival (DFS), disease-specific
survival (DSS), and overall survival (OS) in TCGA and METABRIC and OS in SCAN-B. The median value was
used as a cutoff for two VEGFA expression groups, low (blue) and high (red). VEGFA: vascular
endothelial growth factor-A; SCAN-B: Sweden Cancerome Analysis Network-Breast; METABRIC: Molecular
Taxonomy of Breast Cancer International Consortium; TCGA: The Cancer Genome Atlas.
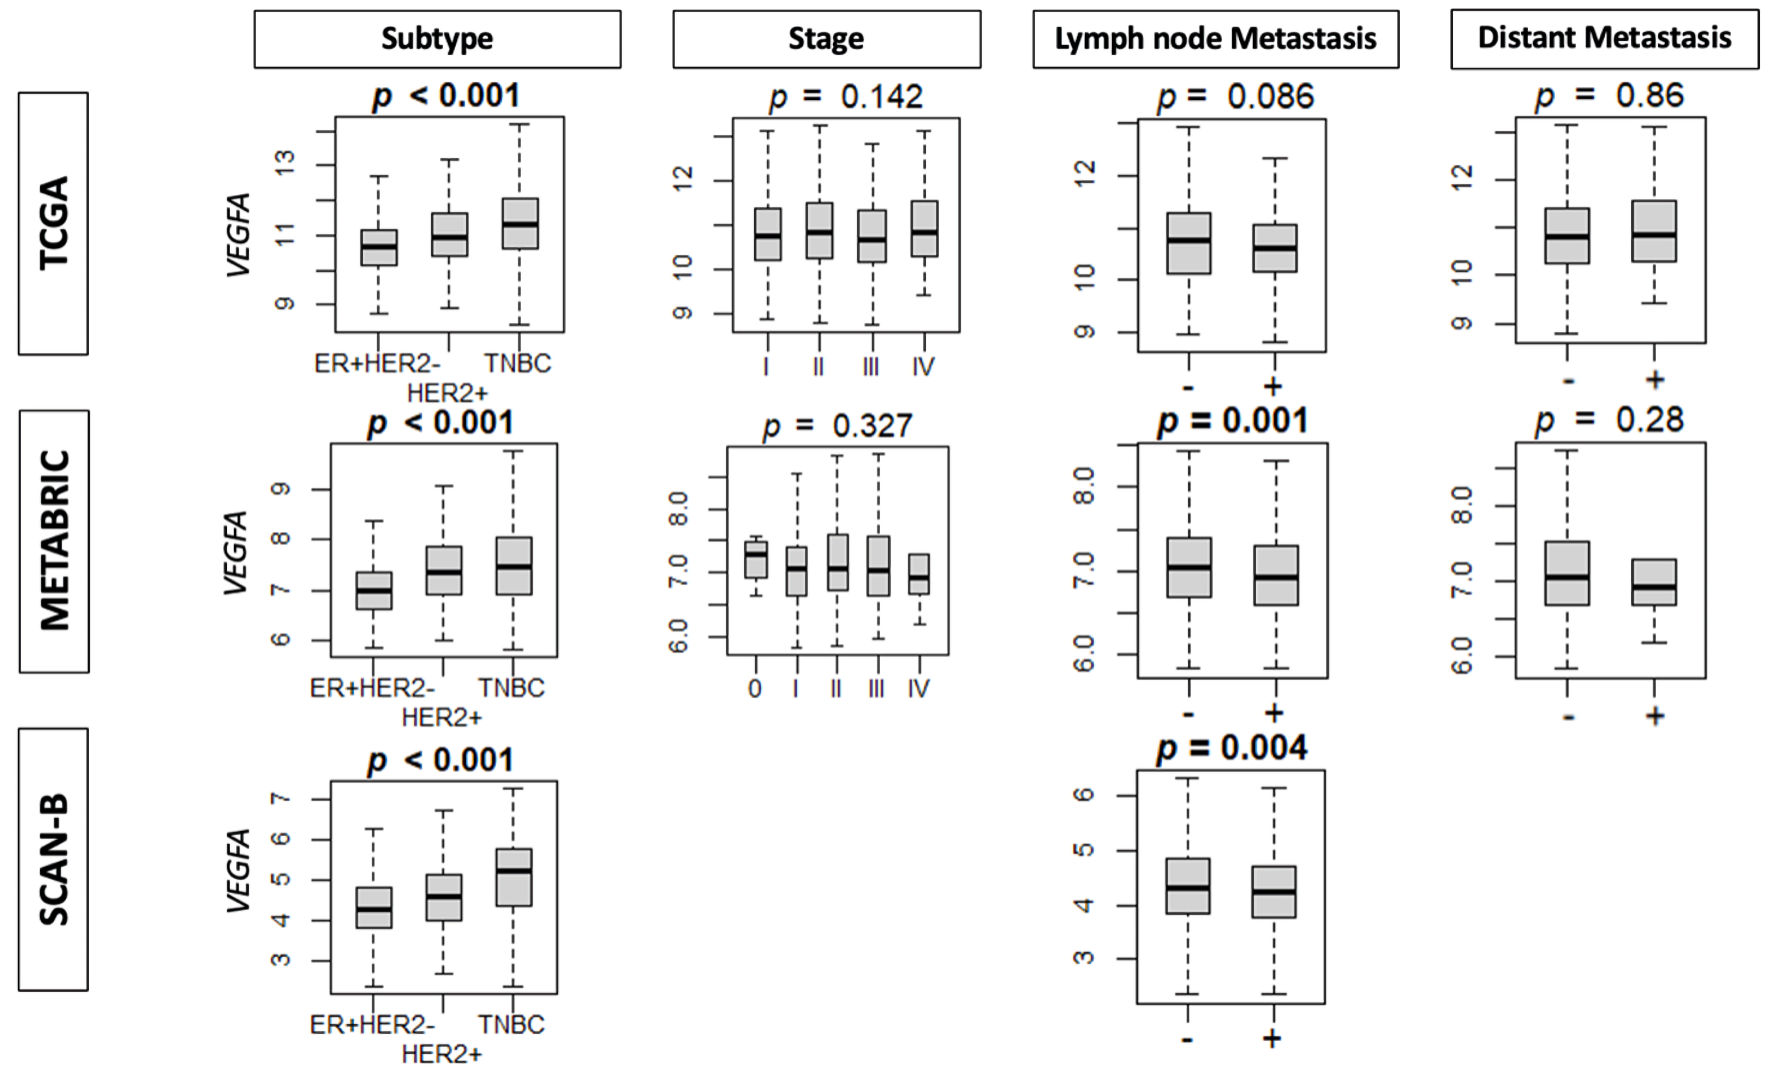
↓ Figure 2. The association between VEGFA
expression and clinical parameters. Boxplots of clinical factors: subtype, stage, lymph node metastasis,
and distant metastasis in TCGA, METABRIC and SCAN-B cohorts by VEGFA expression. ER: estrogen
receptor; HER2: human epidermal growth factor receptor 2; VEGFA: vascular endothelial growth factor-A;
SCAN-B: Sweden Cancerome Analysis Network-Breast; METABRIC: Molecular Taxonomy of Breast Cancer
International Consortium; TCGA: The Cancer Genome Atlas.
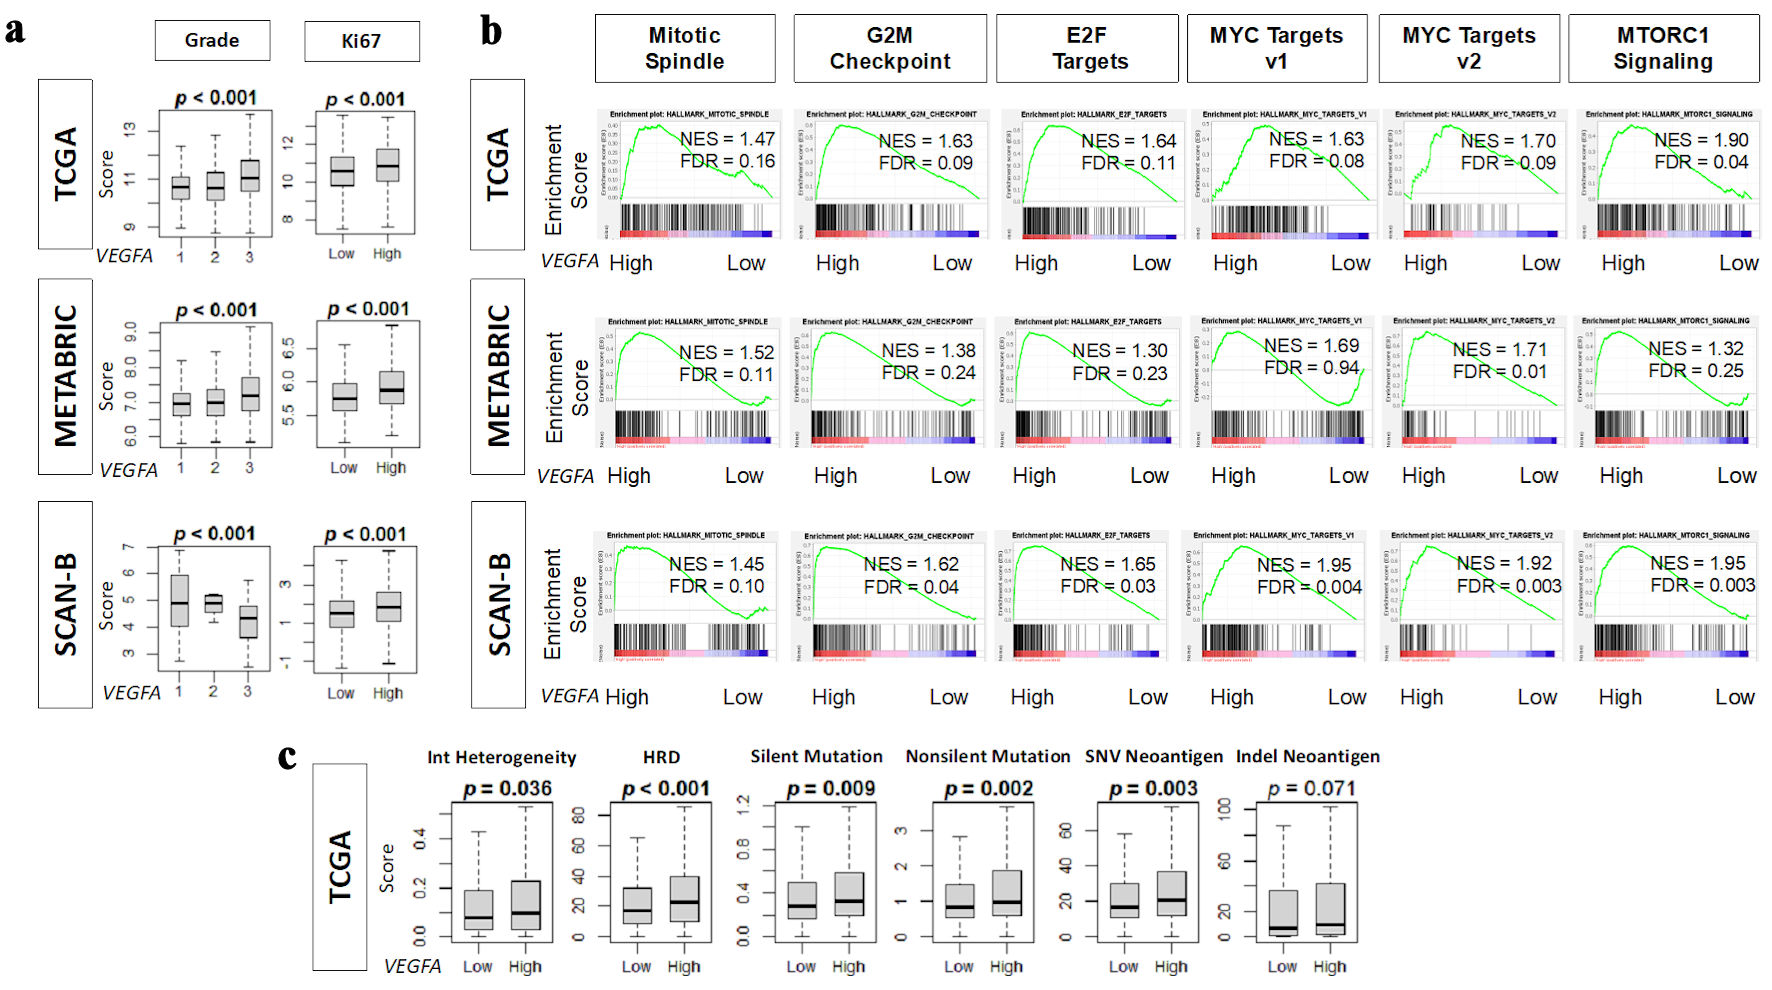
↓ Figure 3. Association of VEGFA with
pathological grade, mutation rates, neoantigens, and cell proliferation-related gene sets. (a) Boxplots
of pathological grade and Ki67 gene (MKI67) expression in TCGA, METABRIC, and SCAN-B cohorts. (b)
Enrichment score plots of cell proliferation-related gene sets: mitotic spindle, G2M checkpoint, E2F
targets, MYC targets v1 and v2, and MTORC1 signaling in TCGA, METABRIC, and SCAN-B cohorts by GSEA using
NES (normalized enrichment score) and FDR (false discovery rate). As recommended by GSEA software, FDR
< 0.25 defined statistical significance. (c) Boxplots of homologous recombination defects (HRD),
intratumor heterogeneity, and the mutation-related scores: silent and non-silent mutation rate, single
nucleotide variation (SNV) and indel neoantigens in TCGA cohort. High and low VEGFA expression
groups were determined by median cutoff. VEGFA: vascular endothelial growth factor-A; SCAN-B: Sweden
Cancerome Analysis Network-Breast; METABRIC: Molecular Taxonomy of Breast Cancer International
Consortium; TCGA: The Cancer Genome Atlas; GSEA: gene set enrichment analysis; ITH: intratumor
heterogeneity.
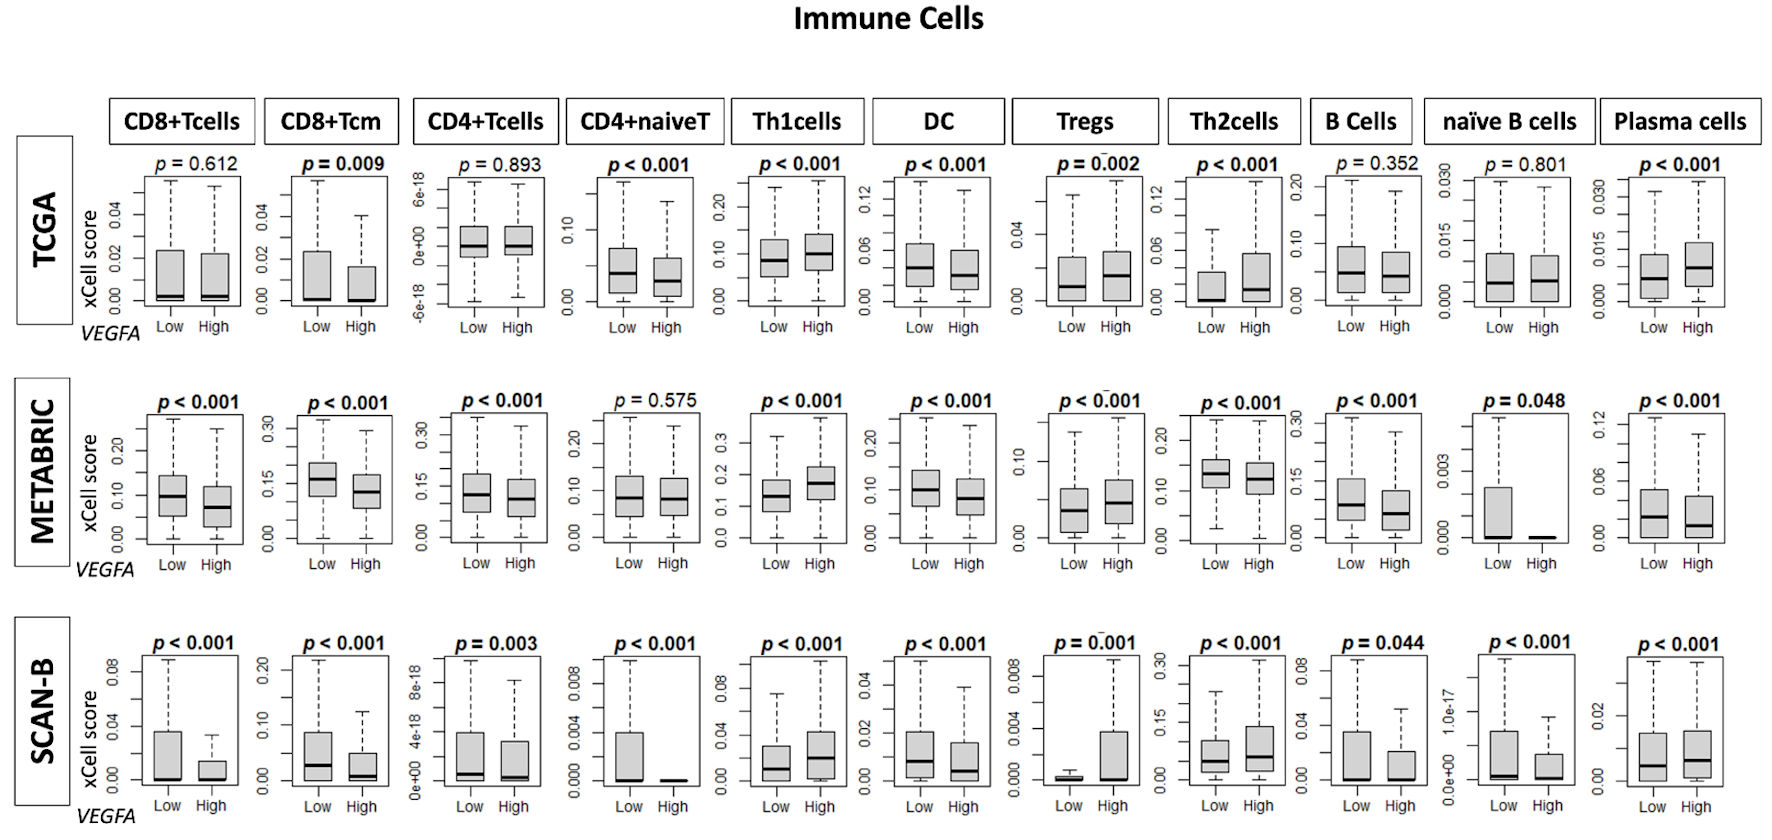
↓ Figure 4. Infiltration fractions of immune
cells in the tumor microenvironment by VEGFA expression. Box plots show infiltration fractions
for immune cells: CD8+ T cells, CD8+ Tcm cells, CD4+ T cells,
CD4+ naive T cells, helper T type 1 (Th1 cells), dendric cells (DC), regulatory T cells
(Tregs), helper T type 2 (Th2) cells, B cells, naive B cells, and plasma cells in TCGA, METABRIC, and
SCAN-B cohorts by low and high VEGFA expression groups determined by median cutoff. VEGFA:
vascular endothelial growth factor-A; SCAN-B: Sweden Cancerome Analysis Network-Breast; METABRIC:
Molecular Taxonomy of Breast Cancer International Consortium; TCGA: The Cancer Genome Atlas.
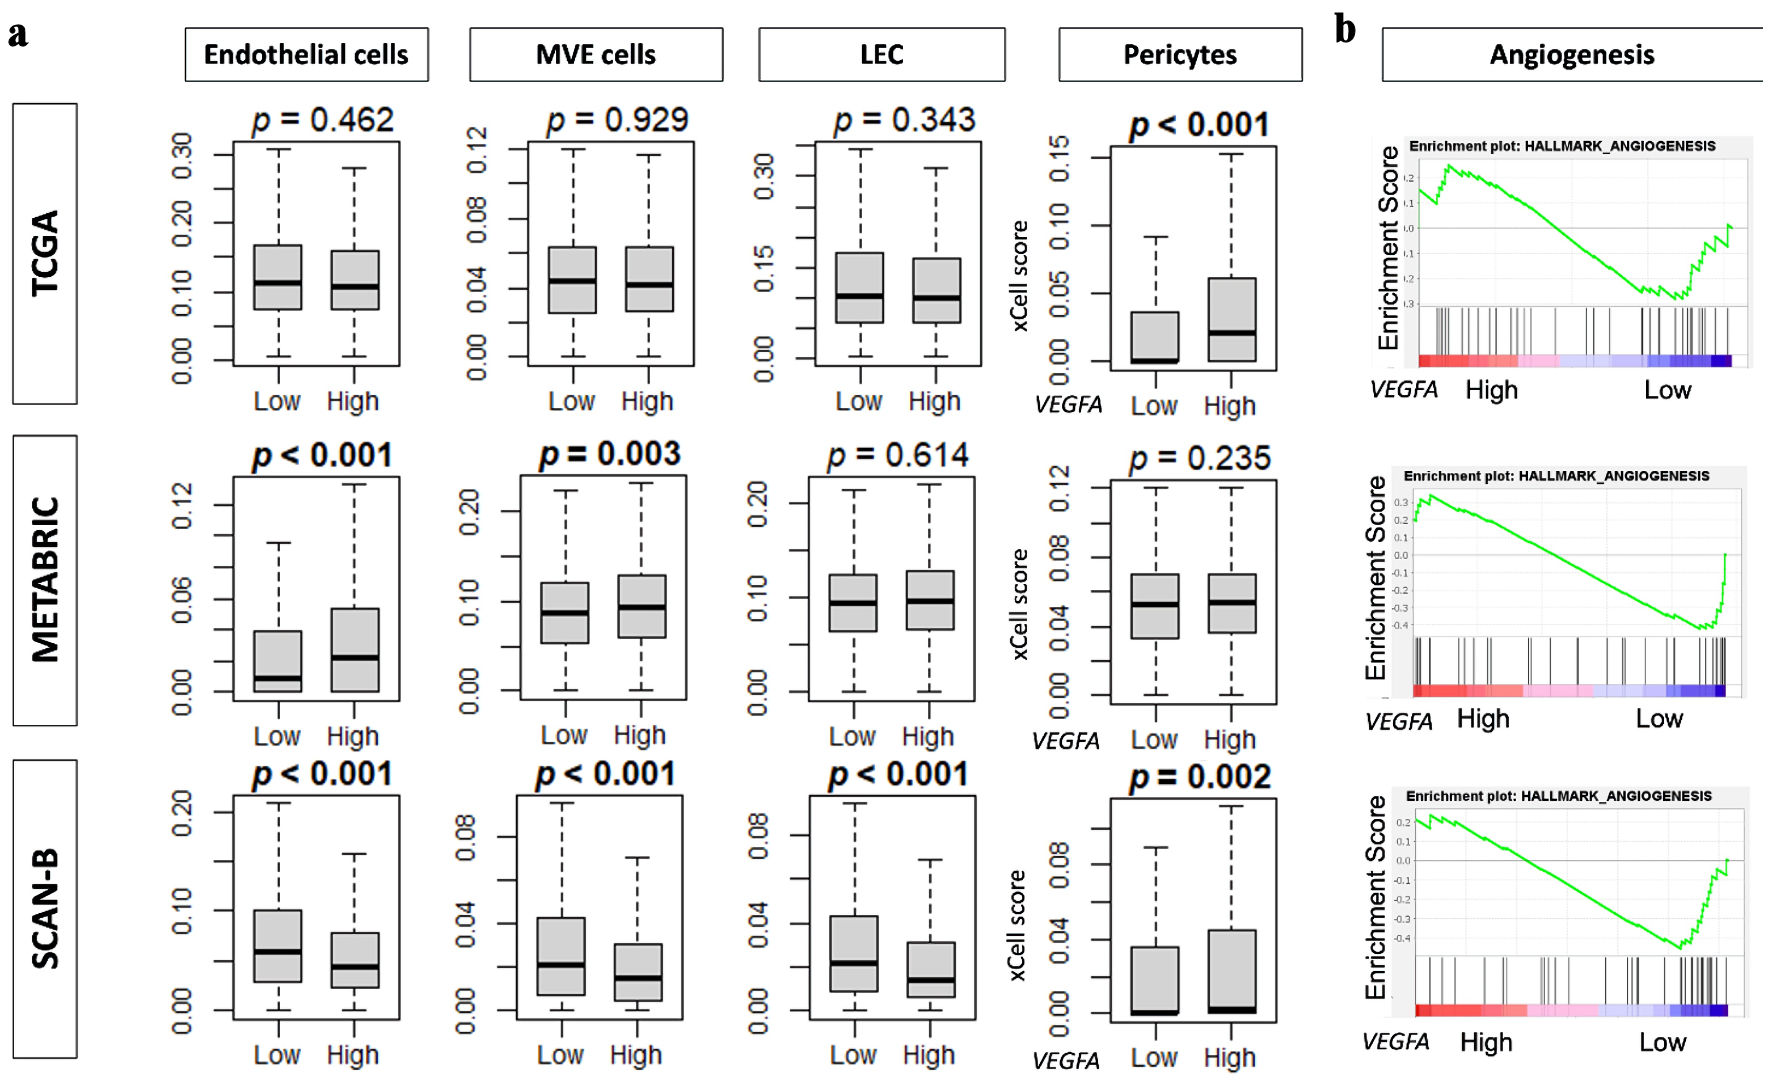
↓ Figure 5. VEGFA association with
angiogenesis and angiogenesis-related data. (a) Boxplots of infiltration fractions for
angiogenesis-related cells: pericytes, endothelial cells, microvascular endothelial (MVE) cells, and
lymphatic endothelial cells (LECs) in in TCGA, METABRIC, and SCAN-B cohorts. (b) Enrichment score plots
of angiogenesis gene set by VEGFA high and low groups by GSEA in TCGA, METABRIC, and SCAN-B
cohorts. VEGFA: vascular endothelial growth factor-A; SCAN-B: Sweden Cancerome Analysis Network-Breast;
METABRIC: Molecular Taxonomy of Breast Cancer International Consortium; TCGA: The Cancer Genome
Atlas.
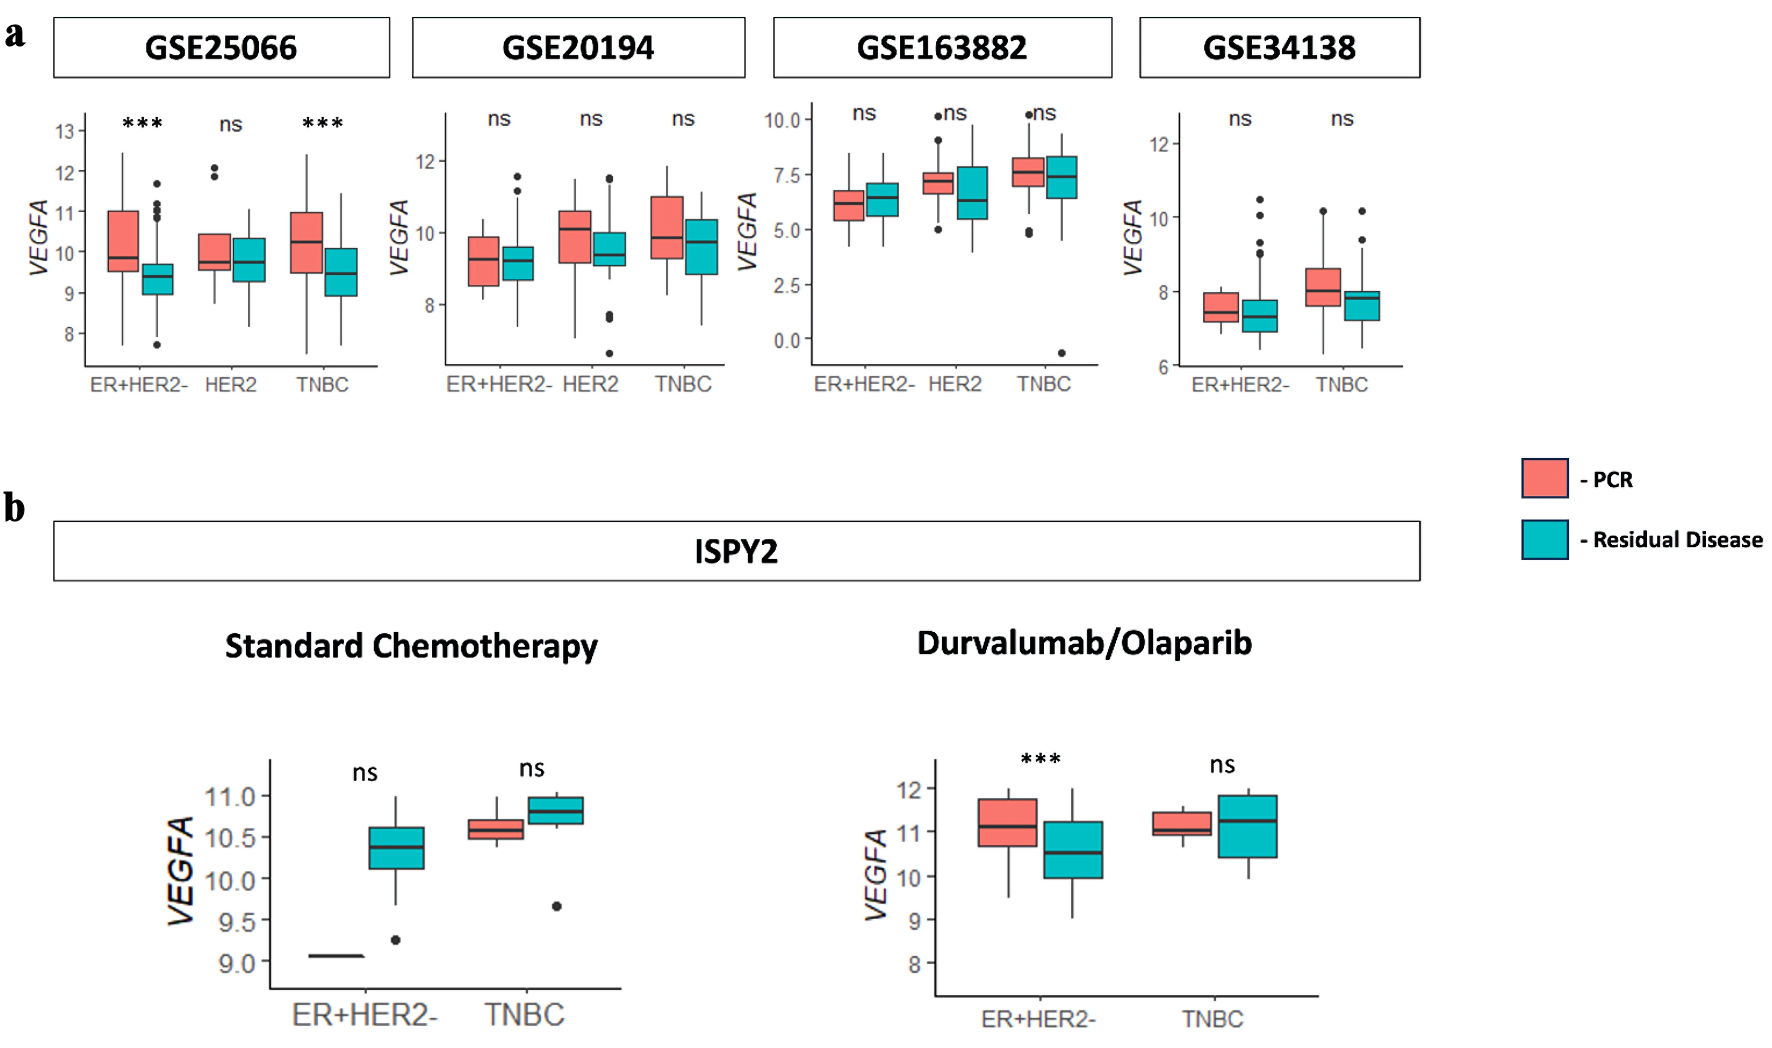
↓ Figure 6. VEGFA association with
neoadjuvant therapy patients with pCR. (a) Boxplots for VEGFA expression versus pathological
complete response (pCR) and residual disease (RD) response for the immunotherapy treatment
(durvalumab/olaparib) group and standard chemotherapy group determined from the ISPY2 cohort. (b)
Boxplots for VEGFA expression versus pCR and RD response for anthracycline- and taxane-based
chemotherapy in neoadjuvant cohorts GSE25066, GSE20194, GSE163882, and GSE34138. VEGFA: vascular
endothelial growth factor-A; ER: estrogen receptor; HER2: human epidermal growth factor receptor 2;
TNBC: triple-negative breast cancer; NS: not significant.