World Journal of Oncology, ISSN 1920-4531 print, 1920-454X online, Open Access
Article copyright, the authors; Journal compilation copyright, World J Oncol and Elmer Press Inc
Journal website https://wjon.elmerpub.com

Original Article

Volume 16, Number 2, April 2025, pages 200-209


Patterns, Predictors, and Prognostic Implication of Treatment-Related Amenorrhea in Patients With Breast Cancer

Figure

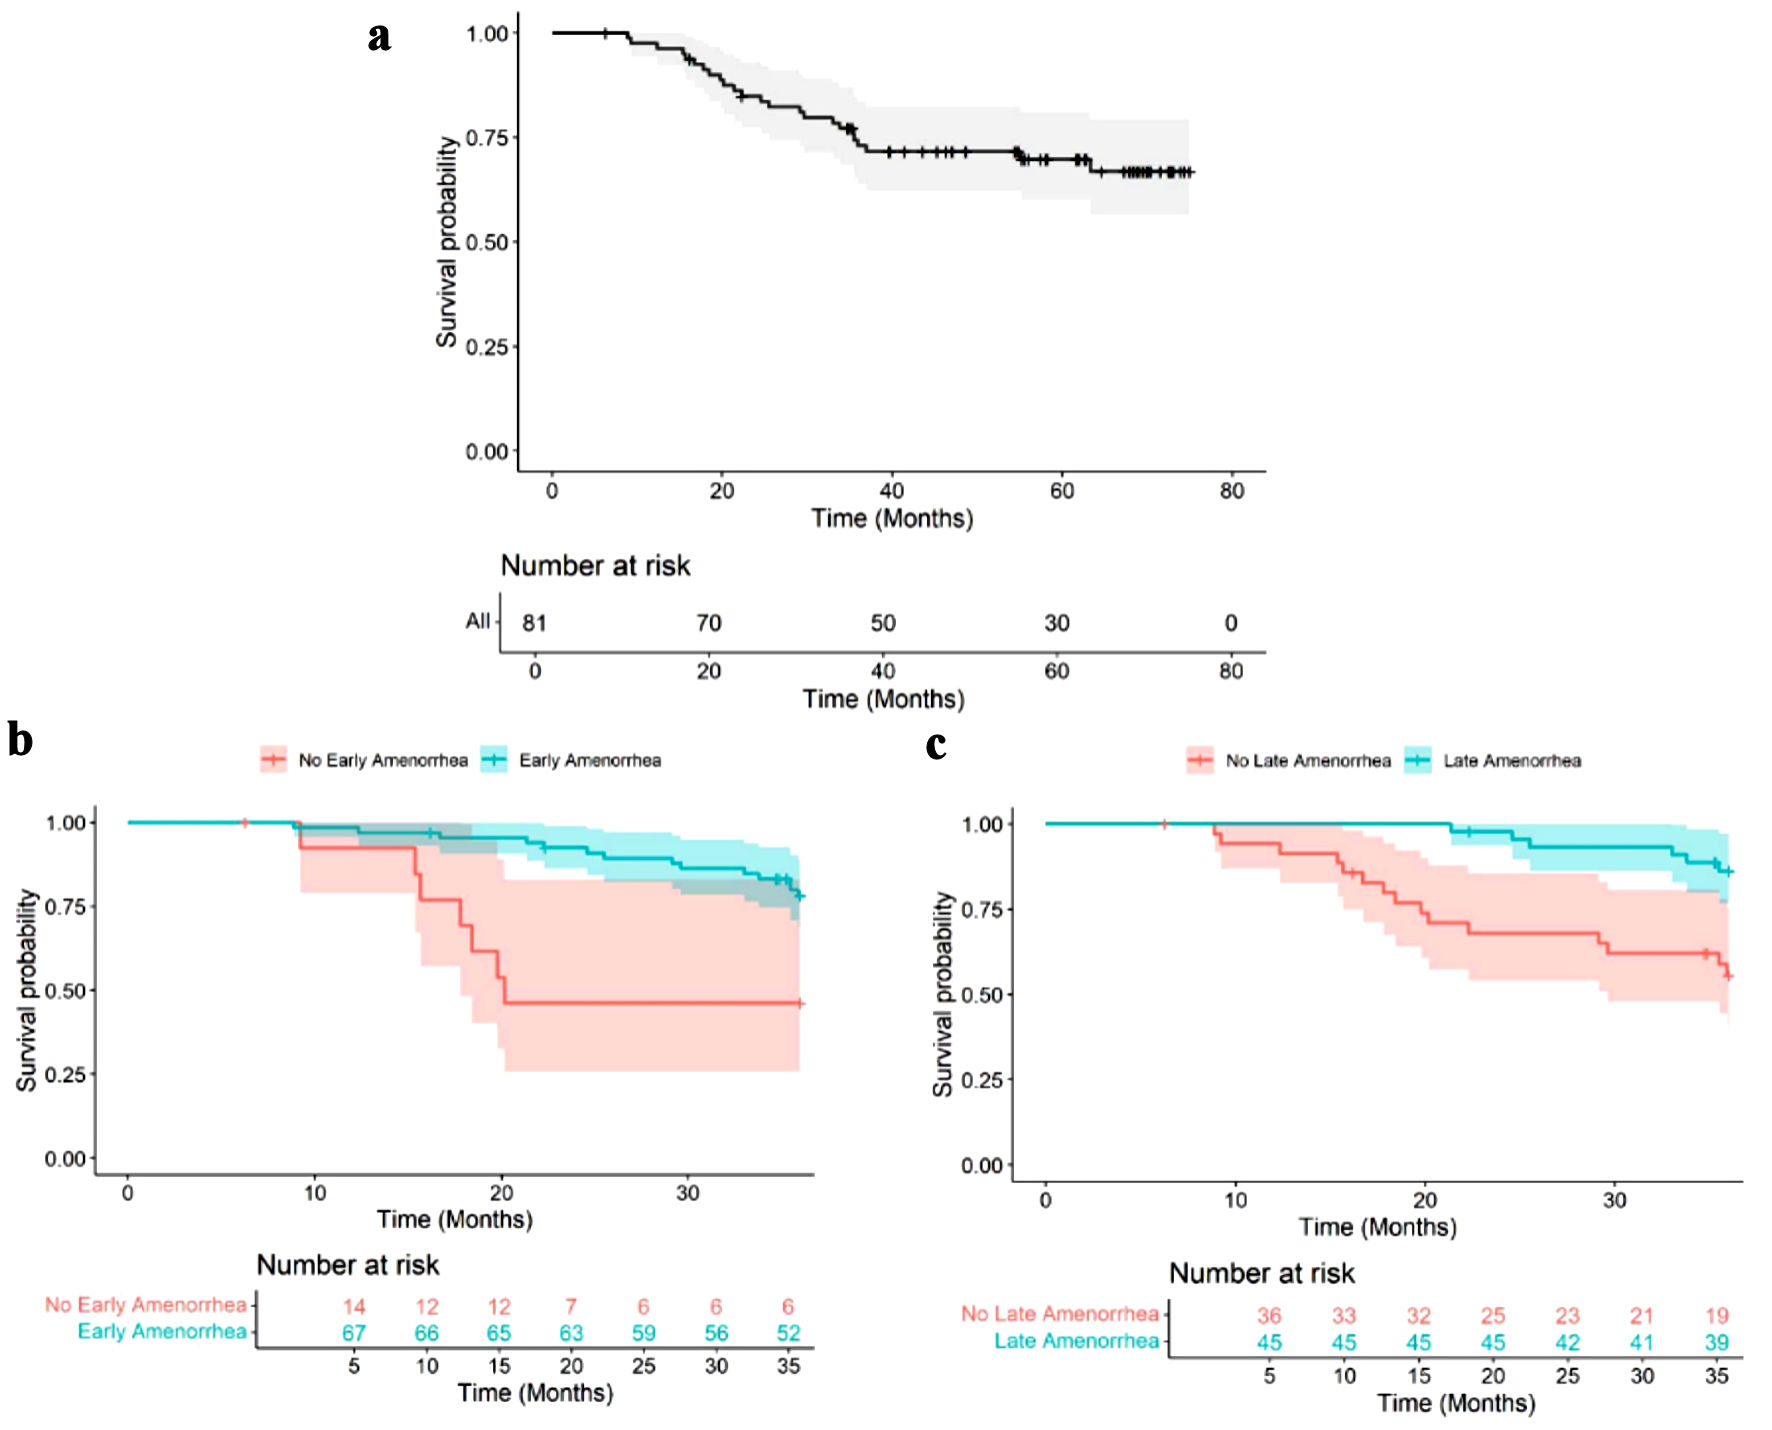
↓  Figure 1. Kaplan-Meier survival curves for the overall cohort and for comparing patients according to their TRA status. (a) Kaplan-Meier curve for the overall cohort. (b) Kaplan-Meier curves comparing survival of patients with EA to patients without EA. (c) Kaplan-Meier survival curves comparing survival of patients with LA to patients without LA. TRA: treatment-related amenorrhea; EA: early amenorrhea; LA: late amenorrhea.
Figure 1.

Tables

↓  Table 1. Subject Demographics and Clinical Characteristics
 
Variables Frequency n (%)
All No amenorrhea Amenorrhea
Early amenorrhea (≥ 6 months) Late amenorrhea (≥ 12 months)
ER: estrogen receptor; PR: progesterone receptor; BMI: body mass index; WHO: World Health Organization; SD: standard deviation.
Age, years (median) 45.4 42.9 42.1 46.6
  ≤ 45 45 (55.6) 10 (71.4) 35 (52.2) 18 (40.0)
  > 45 36 (44.4) 4 (28.6) 32 (47.8) 27 (60.0)
Parity
  ≤ 1 24 (29.6) 0 (0.0) 24 (35.8) 17 (37.8)
  > 1 57 (70.4) 14 (100.0) 43 (64.2) 28 (62.2)
Stage
  I-III 65 (80.2) 9 (64.3) 56 (83.6) 42 (93.3)
  IV 16 (19.8) 5 (35.7) 11 (16.4) 3 (6.7)
ER status
  Negative 26 (32.1) 6 (42.9) 20 (29.9) 9 (20.0)
  Positive 55 (67.9) 8 (57.1) 47 (70.1) 36 (80.0)
PR status
  Negative 35 (43.2) 6 (42.9) 29 (43.3) 15 (33.3)
  Positive 46 (56.8) 8 (57.1) 38 (56.7) 30 (66.7)
BMI (WHO Asia-Pacific) (mean ± SD) 23.5 ± 4.7 23.3 ± 5.7 24.1 ± 4.1 23.3 ± 4.4
  Obese 25 (30.9) 6 (42.9) 19 (28.4) 13 (28.9)
  Overweight 16 (19.8) 3 (21.4) 13 (19.4) 9 (20.0)
  Normal 32 (39.5) 4 (28.6) 28 (41.8) 19 (42.2)
  Underweight 8 (9.9) 1 (7.1) 7 (10.4) 4 (8.9)
Radiotherapy
  No 22 (27.2) 7 (50.0) 16 (23.9) 7 (15.6)
  Yes 59 (72.8) 7 (50.0) 51 (76.1) 38 (84.4)
Number of chemotherapy cycles
  < 8 30 (37.0) 9 (64.3) 21 (31.3) 12 (26.7)
  ≥ 8 51 (63.0) 5 (35.7) 46 (68.7) 33 (73.3)
Anthracycline-taxane regimen
  No 72 (88.9) 13 (92.9) 59 (88.1) 39 (86.7)
  Yes 9 (11.1) 1 (7.1) 8 (11.9) 6 (13.3)
Hormonal therapy
  No 29 (35.8) 8 (57.1) 21 (31.3) 9 (20.0)
  Yes 52 (64.2) 6 (42.9) 46 (68.7) 36 (80.0)


↓  Table 2. Sociodemographic and Clinical Factors Associated With Early Amenorrhea After Breast Cancer Treatment
 
Variables Crude OR (95% CI) P Adjusted OR (95% CI) P
OR: odds ratio; CI: confidence interval; Ref: reference; ER: estrogen receptor; PR: progesterone receptor; BMI: body mass index; WHO: World Health Organization; SD: standard deviation; Inf: infinity.
Age, years
  ≤ 45 Ref Ref
  > 45 2.29 (0.65 - 8.02) 0.197 2.44 (0.63 - 9.46) 0.196
Parity
  ≤ 1 Ref
  > 1 0 (0 - Inf) 0.993
Stage
  I-III Ref
  IV 0.35 (0.10 - 1.26) 0.109
ER status
  Negative Ref
  Positive 1.76 (0.54 - 5.74) 0.347
PR status
  Negative Ref
  Positive 0.98 (0.31 - 3.15) 0.977
BMI (WHO Asia-Pacific) (mean ± SD)
  Obese Ref
  Overweight 1.37 (0.29 - 6.48) 0.693
  Normal 2.21 (0.55 - 8.90) 0.264
  Underweight 2.21 (0.22 - 21.78) 0.497
Radiotherapy
  No Ref Ref
  Yes 3.19 (0.97 - 10.46) 0.056 2.20 (0.62 - 7.88) 0.224
Number of chemotherapy cycles
  < 8 Ref Ref
  ≥ 8 3.94 (1.18 - 13.21) 0.026 3.37 (0.93 - 12.24) 0.065
Anthracycline-taxane regimen
  No Ref
  Yes 1.76 (0.20 - 15.34) 0.608
Hormonal therapy
  No Ref Ref
  Yes 2.92 (0.90 - 9.48) 0.074 2.10 (0.60 - 7.37) 0.249


↓  Table 3. Sociodemographic and Clinical Factors Associated With Late Amenorrhea After Breast Cancer Treatment
 
Variables Crude OR (95% CI) P Adjusted OR (95% CI) P
*P < 0.05. OR: odds ratio; CI: confidence interval; Ref: reference; ER: estrogen receptor; PR: progesterone receptor; BMI: body mass index; WHO: World Health Organization; SD: standard deviation.
Age, years
  ≤ 45 Ref Ref
  > 45 4.50 (1.72 - 11.77) 0.002 4.00 (1.23 - 13.01) 0.021*
Parity
  ≤ 1 Ref Ref
  > 1 0.40 (0.14 - 1.10) 0.077 0.52 (0.15 - 1.79) 0.298
Stage
  I-III Ref Ref
  IV 0.13 (0.03 - 0.49) 0.003 0.20 (0.04 - 0.90) 0.036*
ER status
  Negative Ref
  Positive 3.58 (1.34 - 9.54) 0.011
PR status
  Negative Ref
  Positive 2.50 (1.01 - 6.17) 0.047
BMI (WHO Asia-Pacific) (mean ± SD)
  Obese Ref
  Overweight 1.19 (0.34 - 4.19) 0.790
  Normal 1.35 (0.47 - 3.88) 0.578
  Underweight 0.92 (0.19 - 4.54) 0.922
Radiotherapy
  No Ref
  Yes 1.06 (0.40 - 2.83) 0.911
Number of chemotherapy cycles
  < 8 Ref Ref
  ≥ 8 2.75 (1.09 - 6.96) 0.033 2.66 (0.85 - 8.35) 0.094
Anthracycline-taxane regimen
  No Ref
  Yes 1.69 (0.39 - 7.30) 0.480
Hormonal therapy
  No Ref Ref
  Yes 5.00 (1.87 - 13.36) 0.001 4.96 (1.58 - 15.53) 0.006*