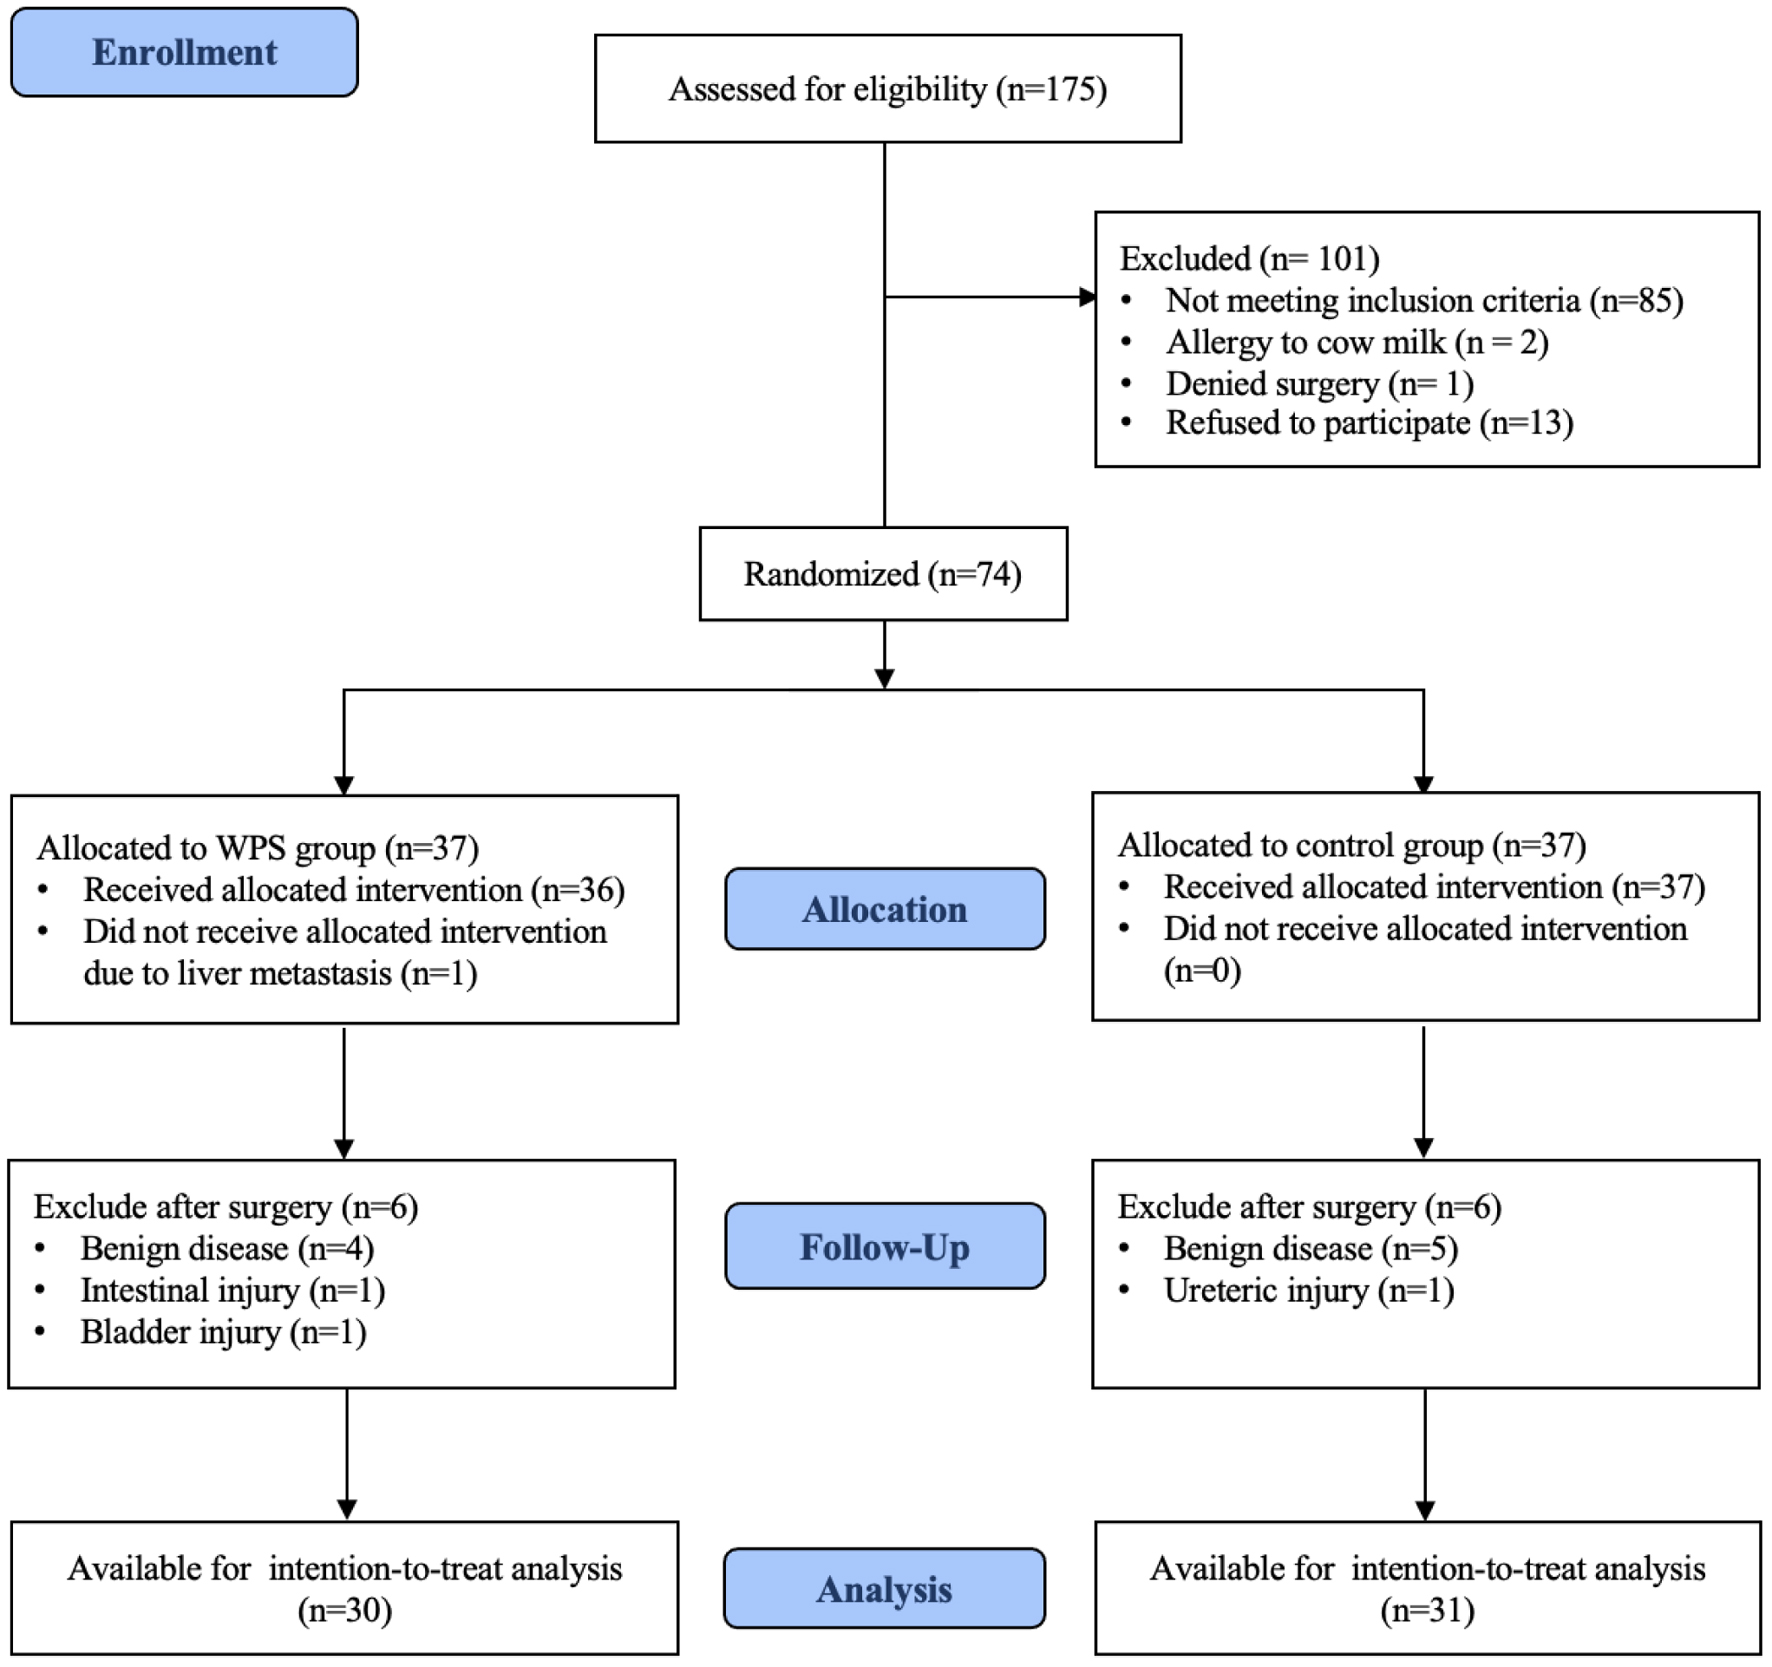
↓ Figure 1. Participant flow diagram after
randomization to either whey protein supplementation (WPS) or control group.
| World Journal of Oncology, ISSN 1920-4531 print, 1920-454X online, Open Access |
| Article copyright, the authors; Journal compilation copyright, World J Oncol and Elmer Press Inc |
| Journal website https://wjon.elmerpub.com |
Original Article
Volume 16, Number 1, February 2025, pages 70-82
Effect of Whey Protein Supplementation on Postoperative Outcomes After Gynecological Cancer Surgery: A Randomized Controlled Trial
Figures
Tables
| Characteristics | Total (n = 61) | WPS group (n = 30) | Control group (n = 31) | P-value |
|---|---|---|---|---|
| aDissociative disorder and old pulmonary tuberculosis. bNormal nutrition: score 0 - 5; level 1: score 6 - 12; level 2: score 13 - 19; level 3: score 20 - 25. cP-value from Student’s t-test. dP-value from Fischer’s exact test. eP-value from Chi-square test. BMI: body mass index; kg: kilogram; n: number; m: meter; SD: standard deviation; RJ-SGA: Rajavithi Subjective Global Assessment; WPS: whey protein supplementation. | ||||
| Age (years), mean ± SD | 51.0 ± 11.8 | 48.8 ± 12.1 | 53.2 ± 11.3 | 0.151c |
| BMI (kg/m2), mean ± SD | 25.2 ± 6.5 | 25.9 ± 7.4 | 24.5 ± 5.5 | 0.372c |
| Ethnicity, n (%) | 0.514d | |||
| Thai | 56 (91.8) | 29 (96.7) | 27 (87.0) | |
| Myanmar | 3 (4.9) | 1 (3.3) | 2 (6.5) | |
| Laos | 2 (3.3) | 0 (0.0) | 2 (6.5) | |
| Underlying disease, n (%) | ||||
| None | 51 (83.6) | 26 (86.8) | 25 (80.7) | 0.731d |
| Dyslipidemia | 5 (8.3) | 1 (3.3) | 4 (12.9) | 0.354d |
| Asthma | 2 (3.3) | 1 (3.3) | 1 (3.2) | 1.000d |
| Allergic rhinitis | 1 (1.6) | 1 (3.3) | 0 (0.0) | 0.492d |
| Thyroid disease | 1 (1.6) | 0 (0.0) | 1 (3.2) | 1.000d |
| Othersa | 1 (1.6) | 1 (3.3) | 0 (0.0) | 0.492d |
| Menopausal status, n (%) | 0.249e | |||
| No | 24 (39.3) | 14 (46.7) | 10 (32.3) | |
| Yes | 37 (60.7) | 16 (53.3) | 21 (67.7) | |
| Previous surgery, n (%) | 0.413e | |||
| No | 46 (75.4) | 24 (80.0) | 22 (71.0) | |
| Yes | 15 (34.6) | 6 (20.0) | 9 (29.0) | |
| Smoking, n (%) | 0.492d | |||
| No | 60 (98.4) | 29 (96.7) | 31 (100.0) | |
| Yes | 1 (1.6) | 1 (3.3) | 0 (0.0) | |
| Nutritional status by RJ-SGAb, n (%) | 0.508d | |||
| Normal nutrition | 0 (0.0) | 0 (0.0) | 0 (0.0) | |
| Malnutrition level 1 | 50 (82.0) | 26 (86.7) | 24 (77.4) | |
| Malnutrition level 2 | 11 (18.0) | 4 (13.3) | 7 (22.6) | |
| Malnutrition level 3 | 0 (0.0) | 0 (0.0) | 0 (0.0) | |
| Characteristics | Total (n = 61) | WPS group (n = 30) | Control group (n = 31) | P-value |
|---|---|---|---|---|
| aCellular fibroma, endometrial hyperplasia, endometrioid adenofibroma, metastatic adenocarcinoma, ovarian fibroma, mature cystic teratoma, and endometrioma. bTumor biopsy and peritoneal biopsy. cP-value from Chi-square test. dP-value from Fischer’s exact test. eP-value from Student’s t-test. fP-value from Mann-Whitney U test. BOT: borderline ovarian tumor; BSO: bilateral salpingo-oophorectomy; EBL: estimated blood loss; mL: milliliter; h: hour; n: number; PRC: packed red cell; SD: standard deviation; TAH: total abdominal hysterectomy; USO: unilateral salpingo-oophorectomy; WPS: whey protein supplementation. | ||||
| Pre-operative diagnosis, n (%) | 0.055c | |||
| Suspected uterine cancer | 27 (44.3) | 17 (56.7) | 10 (32.3) | |
| Suspected ovarian cancer | 34 (55.7) | 13 (43.3) | 21 (67.7) | |
| Postoperative diagnosis, n (%) | 0.178d | |||
| Endometrial cancer | 23 (37.7) | 14 (46.7) | 9 (29.0) | |
| Ovarian cancer | 20 (32.8) | 9 (30.0) | 11 (35.5) | |
| BOT | 10 (6.4) | 2 (6.7) | 8 (25.8) | |
| Uterine sarcoma | 1 (1.6) | 1 (3.3) | 0 (0.0) | |
| Othersa | 7 (11.5) | 4 (13.3) | 3 (9.7) | |
| Surgical procedure, n (%) | 0.591d | |||
| USO/BSO | 6 (9.8) | 3 (10.0) | 3 (9.7) | |
| TAH with USO/BSO | 53 (86.9) | 27 (90.0) | 26 (83.9) | |
| Othersb | 2 (3.3) | 0 (0.0) | 2 (6.4) | |
| Lymphadenectomy, n (%) | 0.906c | |||
| Not done | 24 (39.3) | 11 (36.7) | 13 (41.9) | |
| Pelvic node | 16 (26.3) | 8 (26.7) | 8 (25.8) | |
| Pelvic and paraaortic node | 21 (34.4) | 11 (36.6) | 10 (32.3) | |
| Abdominal adhesiolysis, n (%) | 20 (32.8) | 9 (30.0) | 11 (35.5) | 0.648c |
| Operative time (h), mean ± SD | 2.45 ± 0.80 | 2.48 ± 0.82 | 2.49 ± 0.79 | 0.963e |
| EBL (mL), median (range) | 369.2 (20.0 - 1,600.0) | 289.0 (20.0 - 800.0) | 446.8 (50.0 - 1,600.0) | 0.188f |
| PRC transfusion, n (%) | 13 (21.3) | 3 (10.0) | 10 (32.3) | 0.059d |
| Serum albumin (g/L) | Total (n = 61) | WPS group (n = 30) | Control group (n = 31) | MD/RD (95% CI) | P-value |
|---|---|---|---|---|---|
| aHypoalbuminemia defined as serum albumin less than 3.5 g/L. bP-value from generalized linear mixed model analysis (GLMM). cP-value from Student’s t-test. dP-value from Fischer’s exact test. *Significant P-value < 0.05. CI: confidence interval; g: gram; L: liter; MD: mean difference; n: number; OR: odds ratio; RD: risk difference; SD: standard deviation; WPS: whey protein supplementation. | |||||
| Pre-operative serum albumin, mean ± SD | 4.04 ± 0.47 | 4.04 ± 0.47 | 3.82 ± 0.59 | 0.21 (-0.59, 0.49) | 0.123c |
| Postoperative serum albumin, mean ± SD | 3.17 ± 0.48 | 3.31 ± 0.41 | 3.04 ± 0.51 | 0.27 (0.03, 0.51) | 0.026*c |
| Treatment effect, MD (95% CI) | 0.24 (0.02, 0.46) | Ref. | |||
| P-value | 0.031*b | - | |||
| Hypoalbuminemiaa | |||||
| Pre-operative, n (%) | 11 (18.0) | 3 (10.0) | 8 (25.8) | -0.16 (-0.35, 0.03) | 0.182d |
| Postoperative, n (%) | 42 (68.9) | 16 (53.3) | 26 (83.9) | -0.31 (-0.53, -0.08) | 0.013d* |
| Treatment effect, OR (95% CI) | 0.38 (0.18, 0.80) | Ref. | |||
| P-value | 0.011*b | - | |||
| Outcome | WPS group (n = 30) | Control group (n = 31) | Mean difference (95% CI) | P-value |
|---|---|---|---|---|
| aAdditional analgesic drugs defined as intravenous non-steroidal anti-inflammatory drug. bP-value from Student’s t-test. cP-value from Fischer’s exact test. *Significant P-value < 0.05. CI: confidence interval; MD: mean difference; n: number; SD: standard deviation; WPS: whey protein supplementation. | ||||
| Primary outcomes | ||||
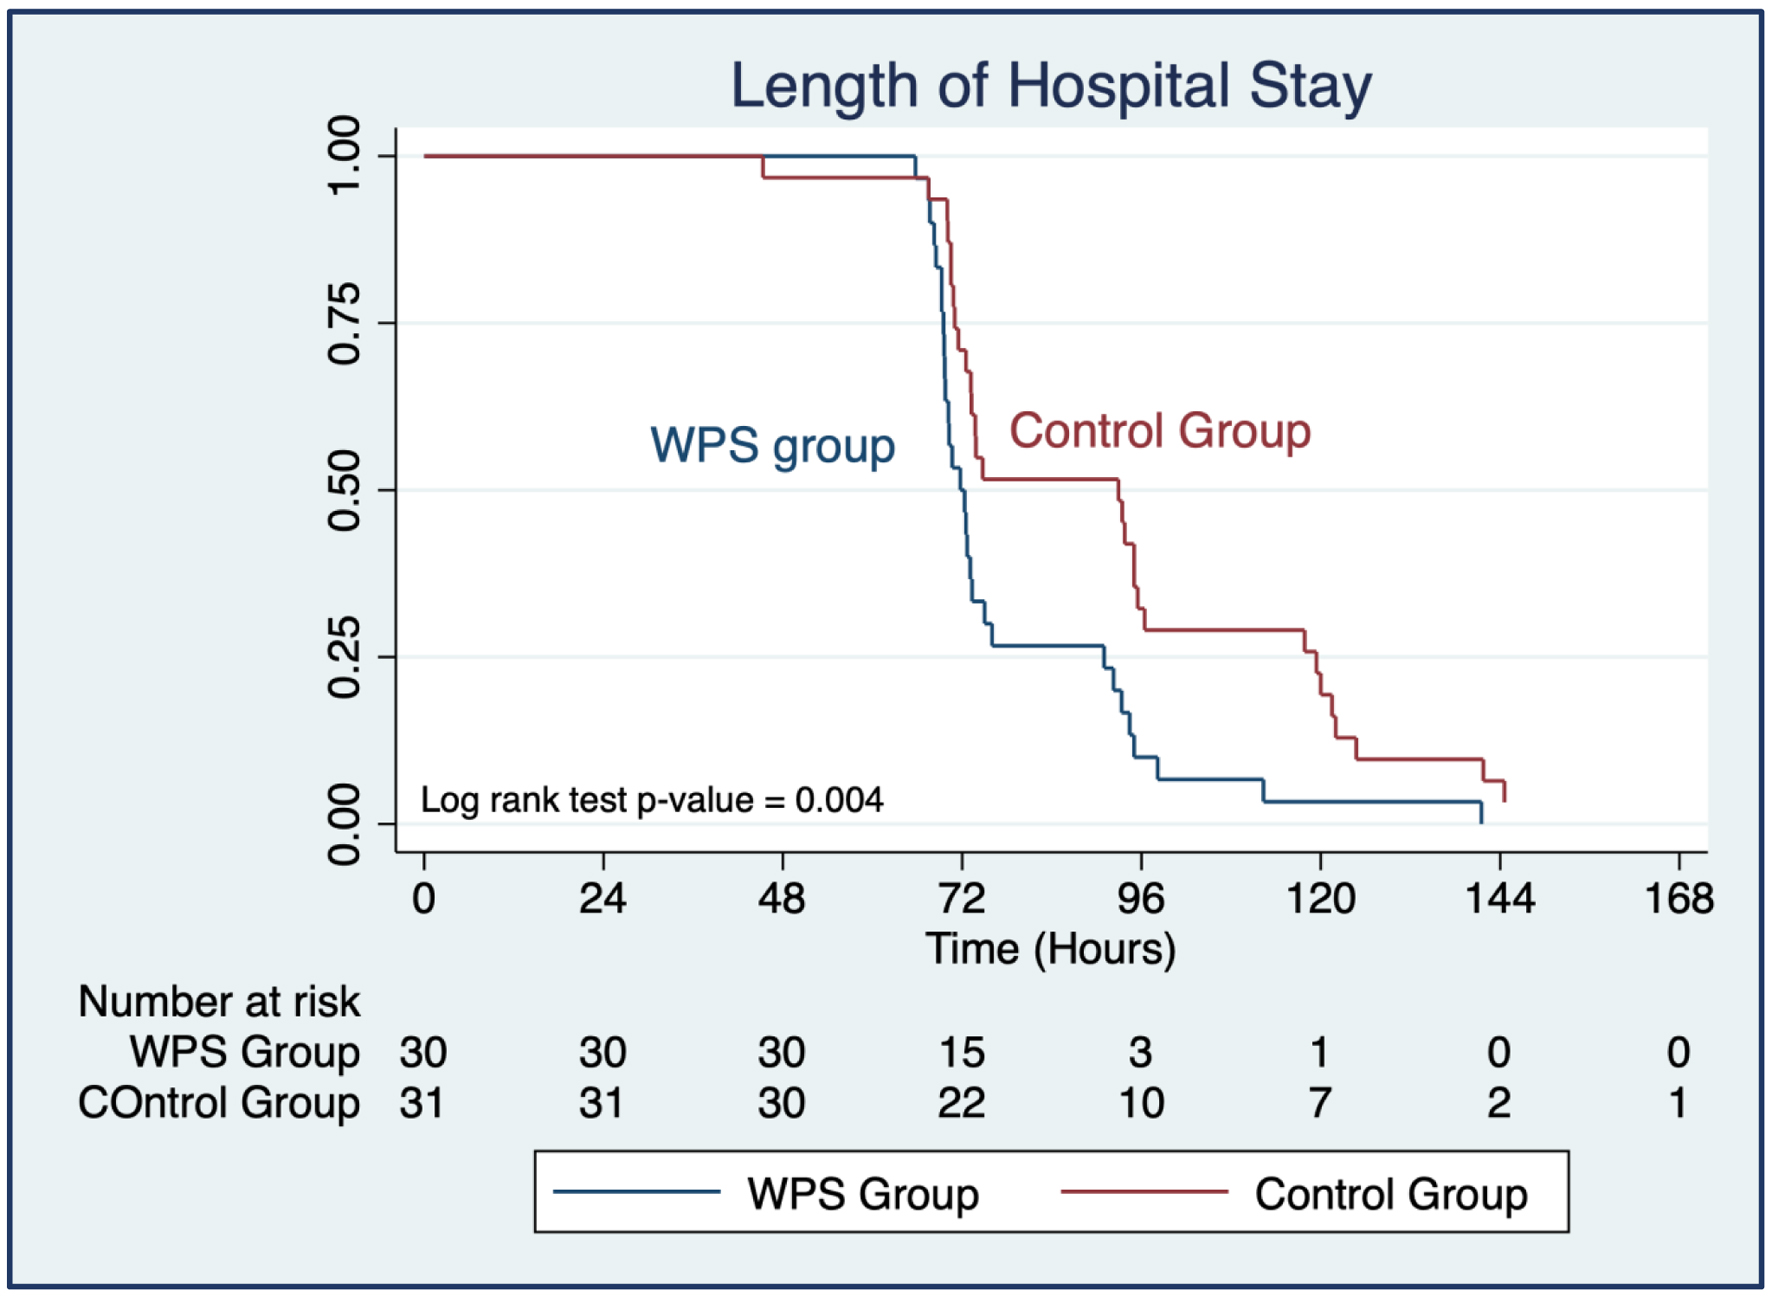
| Length of hospital stay (h), mean ± SD | 79.0 ± 16.7 | 93.3 ± 28.4 | -14.3 (-26.3, -2.3) | 0.021*b |
| Secondary outcomes | ||||
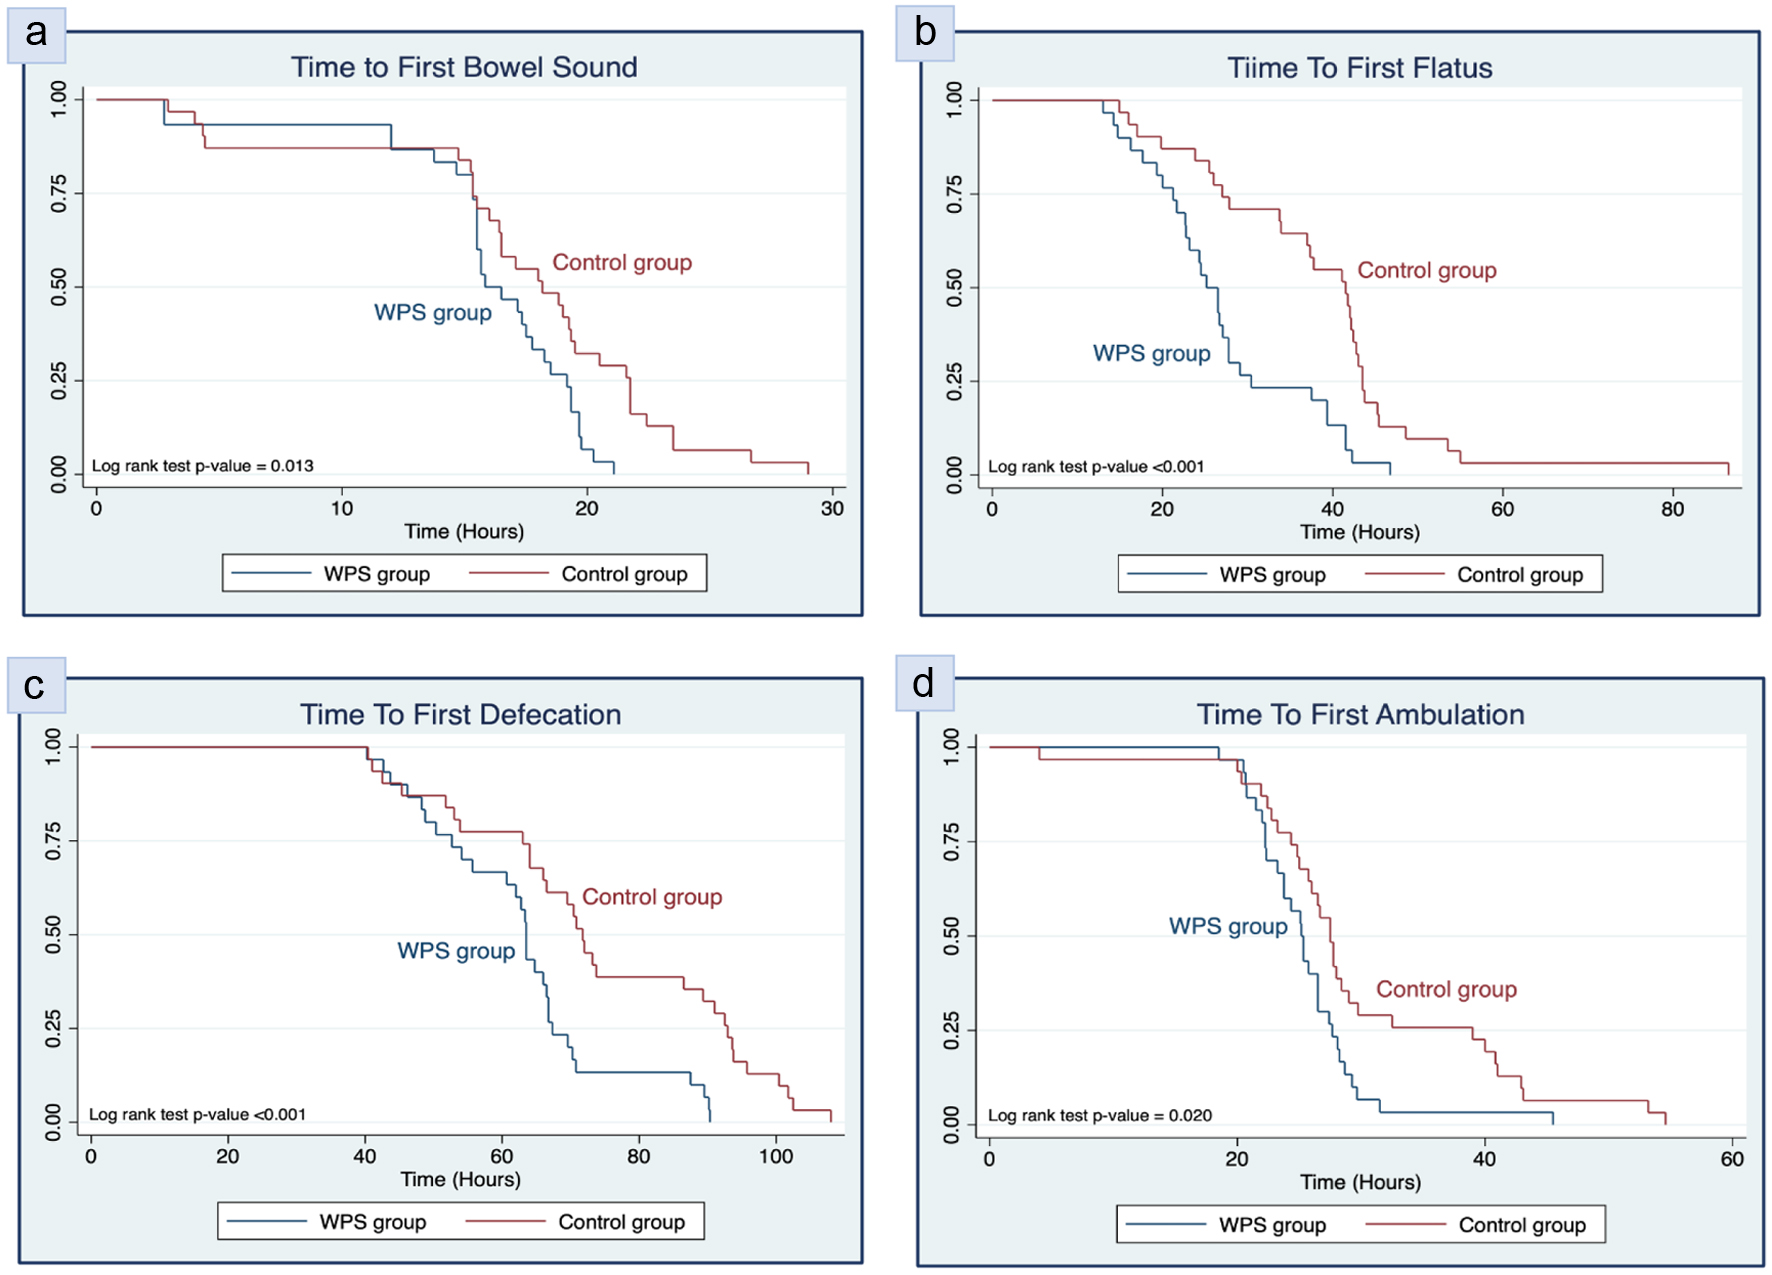
| Time to first bowel sound (h), mean ± SD | 16.0 ± 4.3 | 17.4 ± 6.3 | -1.4 (-4.2, 1.3) | 0.309b |
| Time to first passage of flatus (h), mean ± SD | 27.0 ± 9.1 | 38.0 ± 14.0 | -11.0 (-17.1, -4.9) | < 0.001*b |
| Time to first defecation (h), mean ± SD | 62.9 ± 13.7 | 74.2 ± 19.9 | -11.3 (-20.1, -2.5) | 0.013*b |
| Time to first ambulation (h), mean ± SD | 25.6 ± 4.9 | 29.9 ± 10.3 | -4.3 (-8.4, -0.1) | 0.043*b |
| Additional analgesic druga, n (%) | 0.425c | |||
| No | 28 (93.3) | 26 (83.9) | - | |
| Yes | 2 (6.7) | 5 (16.1) | - | |
| Outcome | Total (n = 61) | WPS group (n = 30) | Control group (n = 31) | P-value |
|---|---|---|---|---|
| aP-value from Fischer’s exact test. n: number; SD: standard deviation; WPS: whey protein supplementation. | ||||
| Fever, n (%) | 1.000a | |||
| No | 60 (98.4) | 30 (100.0) | 30 (96.8) | |
| Yes | 1 (1.6) | 0 (0.0) | 1 (3.2) | |
| Postoperative nausea/vomiting, n (%) | 0.053a | |||
| No | 53 (86.9) | 29 (96.7) | 24 (77.4) | |
| Yes | 8 (13.1) | 1 (3.3) | 7 (22.6) | |
| Wound infection on postoperative day 7, n (%) | 1.000a | |||
| No | 59 (96.7) | 29 (96.7) | 30 (96.8) | |
| Yes | 2 (3.3) | 1 (3.3) | 1 (3.2) | |
| Wound infection on postoperative day 14, n (%) | 0.492a | |||
| No | 60 (98.4) | 25 (96.7) | 31 (100.0) | |
| Yes | 1 (1.6) | 1 (3.3) | 0 (0.0) | |
| Readmission within 30 days, n (%) | 1.000a | |||
| No | 59 (96.7) | 29 (96.7) | 30 (96.8) | |
| Yes | 2 (3.3) | 1 (3.3) | 1 (3.2) | |
| Readmission cause, n (%) | 1.000a | |||
| Wound dehiscence | 1 (1.6) | 1 (3.3) | 0 (0.0) | |
| Gut obstruction | 1 (1.6) | 0 (0.0) | 1 (3.2) | |