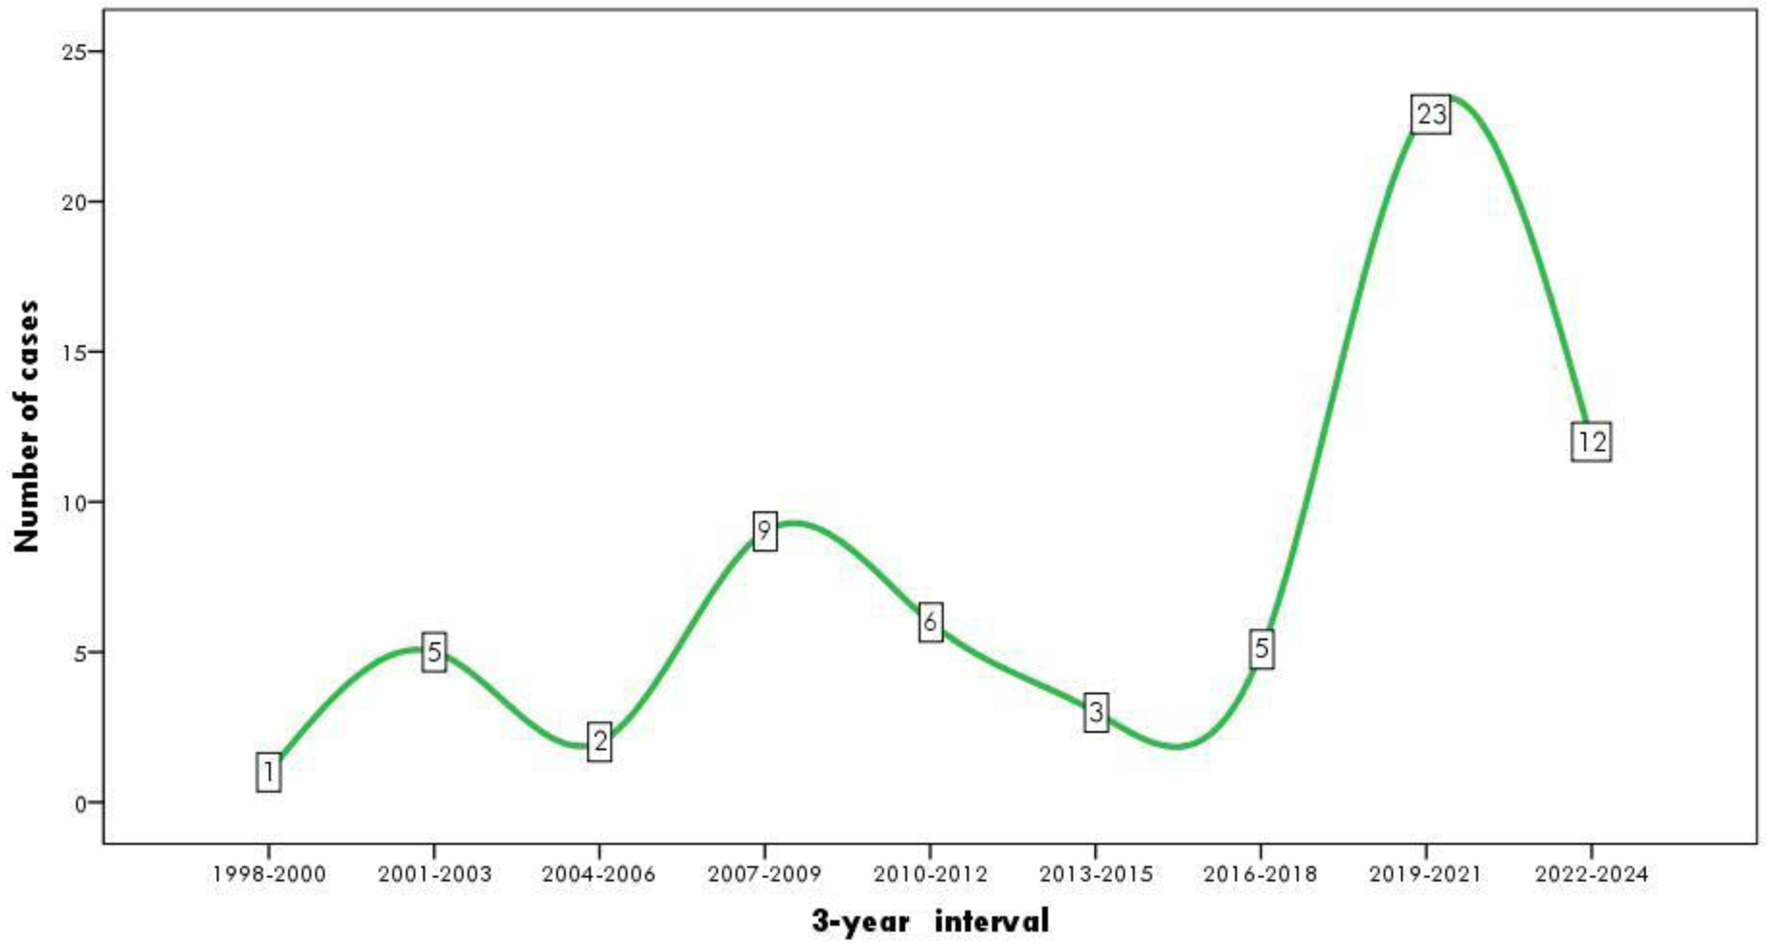
↓ Figure 1. The trend of ATC cases during 1998 -
2024. ATC: anaplastic thyroid carcinoma.
| World Journal of Oncology, ISSN 1920-4531 print, 1920-454X online, Open Access |
| Article copyright, the authors; Journal compilation copyright, World J Oncol and Elmer Press Inc |
| Journal website https://wjon.elmerpub.com |
Original Article
Volume 16, Number 1, February 2025, pages 113-119
Survival Analysis of Anaplastic Thyroid Carcinoma With Various Therapeutic Modalities: Twenty-Seven Years’ Experience in a Single Cancer Center
Figures
Tables
| Variables | N = 42 |
|---|---|
| RT: radiotherapy; SD: standard deviation. | |
| Age (years) (mean ± SD) | 62.57 ± 13.42 |
| Gender | |
| Female | 24 (57.1%) |
| Male | 18 (42.9%) |
| T | |
| T4a | 24 (57.1%) |
| T4b | 18 (42.9%) |
| N | |
| N0 | 16 (28.1%) |
| N1 | 17 (40.5%) |
| N1b | 1 (2.4%) |
| N2a | 1 (2.4%) |
| N2b | 2 (4.8%) |
| N2c | 4 (9.5%) |
| N3 | 1 (2.4%) |
| M | |
| M0 | 26 (61.9%) |
| M1 | 16 (38.1%) |
| Metastasis location | |
| Lung | 14 (82.3%) |
| Bone | 3 (17.6%) |
| Others | 3 (17.6%) |
| Karnofsky performance score | |
| ≤ 80 | 27 (64.3%) |
| > 80 | 15 (35.7%) |
| Stage | |
| IVa | 15 (35.7%) |
| IVb | 10 (23.8%) |
| IVc | 17 (40.5%) |
| Survival time (days) | |
| Mean ± SD | 44.64 ± 42.23 |
| Median | 27.50 |
| Therapeutic modalities | |
| Surgery + chemotherapy/RT | 5 (11.9%) |
| Surgery only | 21 (50.0%) |
| Chemotherapy/RT only | 5 (11.9%) |
| No therapy | 11 (26.2%) |
| Types of surgery | |
| Isthmectomy | 1 (3.8%) |
| Isthmolobectomy | 6 (23.1%) |
| Total thyroidectomy | 5 (19.2%) |
| Tracheostomy only | 5 (19.2%) |
| Isthmectomy + tracheostomy | 7 (26.9%) |
| Total thyroidectomy + tracheostomy | 2 (7.8%) |
| Variables | Survival time (days) (mean ± SD) | Mean difference | P-value | 95% CI |
|---|---|---|---|---|
| Mann-Whitney U test was used. CI: confidence interval; SD: standard deviation. | ||||
| Age | ||||
| > 60 years | 38.76 ± 31.07 | -5.86 | 0.567 | -26.43 to 14.70 |
| ≤ 60 years | 44.63 ± 32.83 | |||
| Gender | ||||
| Female | 35.52 ± 27.30 | -12.58 | 0.208 | -32.48 to 7.30 |
| Male | 48.11 ± 35.71 | |||
| T | ||||
| T4a | 40.09 ± 35.69 | -2.19 | 0.828 | -22.48 to 18.10 |
| T4b | 42.28 ± 26.13 | |||
| N | ||||
| N0 | 52.06 ± 37.13 | 18.06 | 0.073 | -1.74 to 37.87 |
| N+ | 34.00 ± 25.67 | |||
| M | ||||
| M0 | 42.23 ± 34.76 | 3.23 | 0.756 | -17.66 to 24.12 |
| M1 | 39.00 ± 25.87 | |||
| Stage | ||||
| IVa/IVb | 45.21 ± 34.68 | 10.03 | 0.321 | -30.22 to 10.16 |
| IVc | 35.18 ± 26.23 | |||
| Karnofsky score | ||||
| ≤ 80 | 37.59 ± 33.60 | -19.74 | 0.149 | -46.84 to 7.36 |
| > 80 | 57.33 ± 53.47 | |||
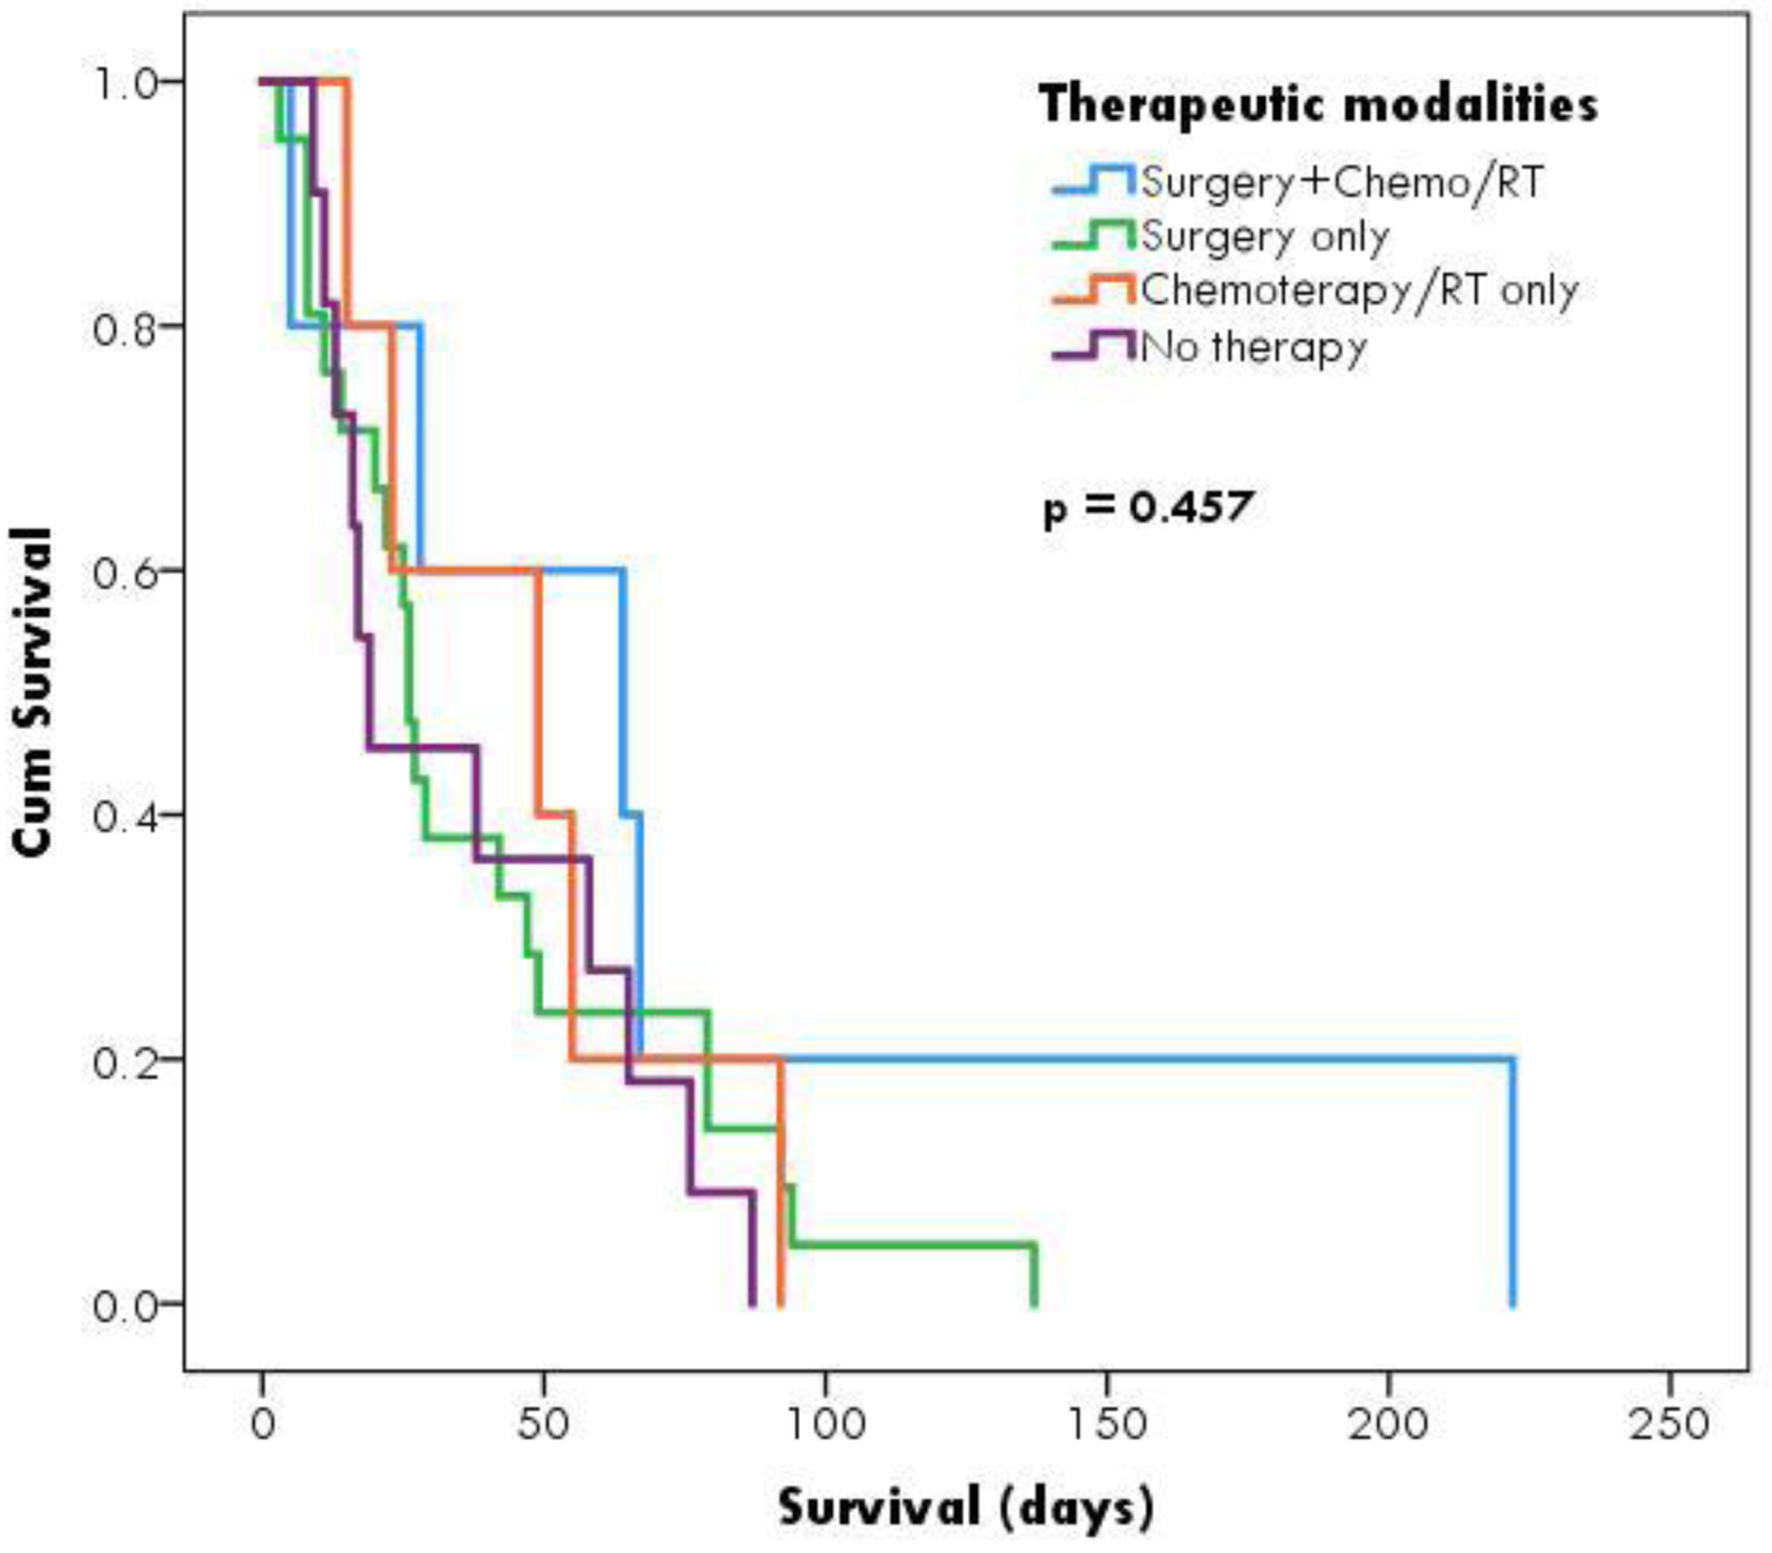
| Therapeutic modalities | Median survival (days) | Standard error | P-value |
|---|---|---|---|
| RT: radiotherapy. | |||
| Surgery + chemotherapy/RT | 64 | 39.43 | 0.457 |
| Surgery only | 26 | 1.52 | |
| Chemotherapy/RT only | 49 | 28.48 | |
| No therapy | 19 | 12.11 | |