Figures
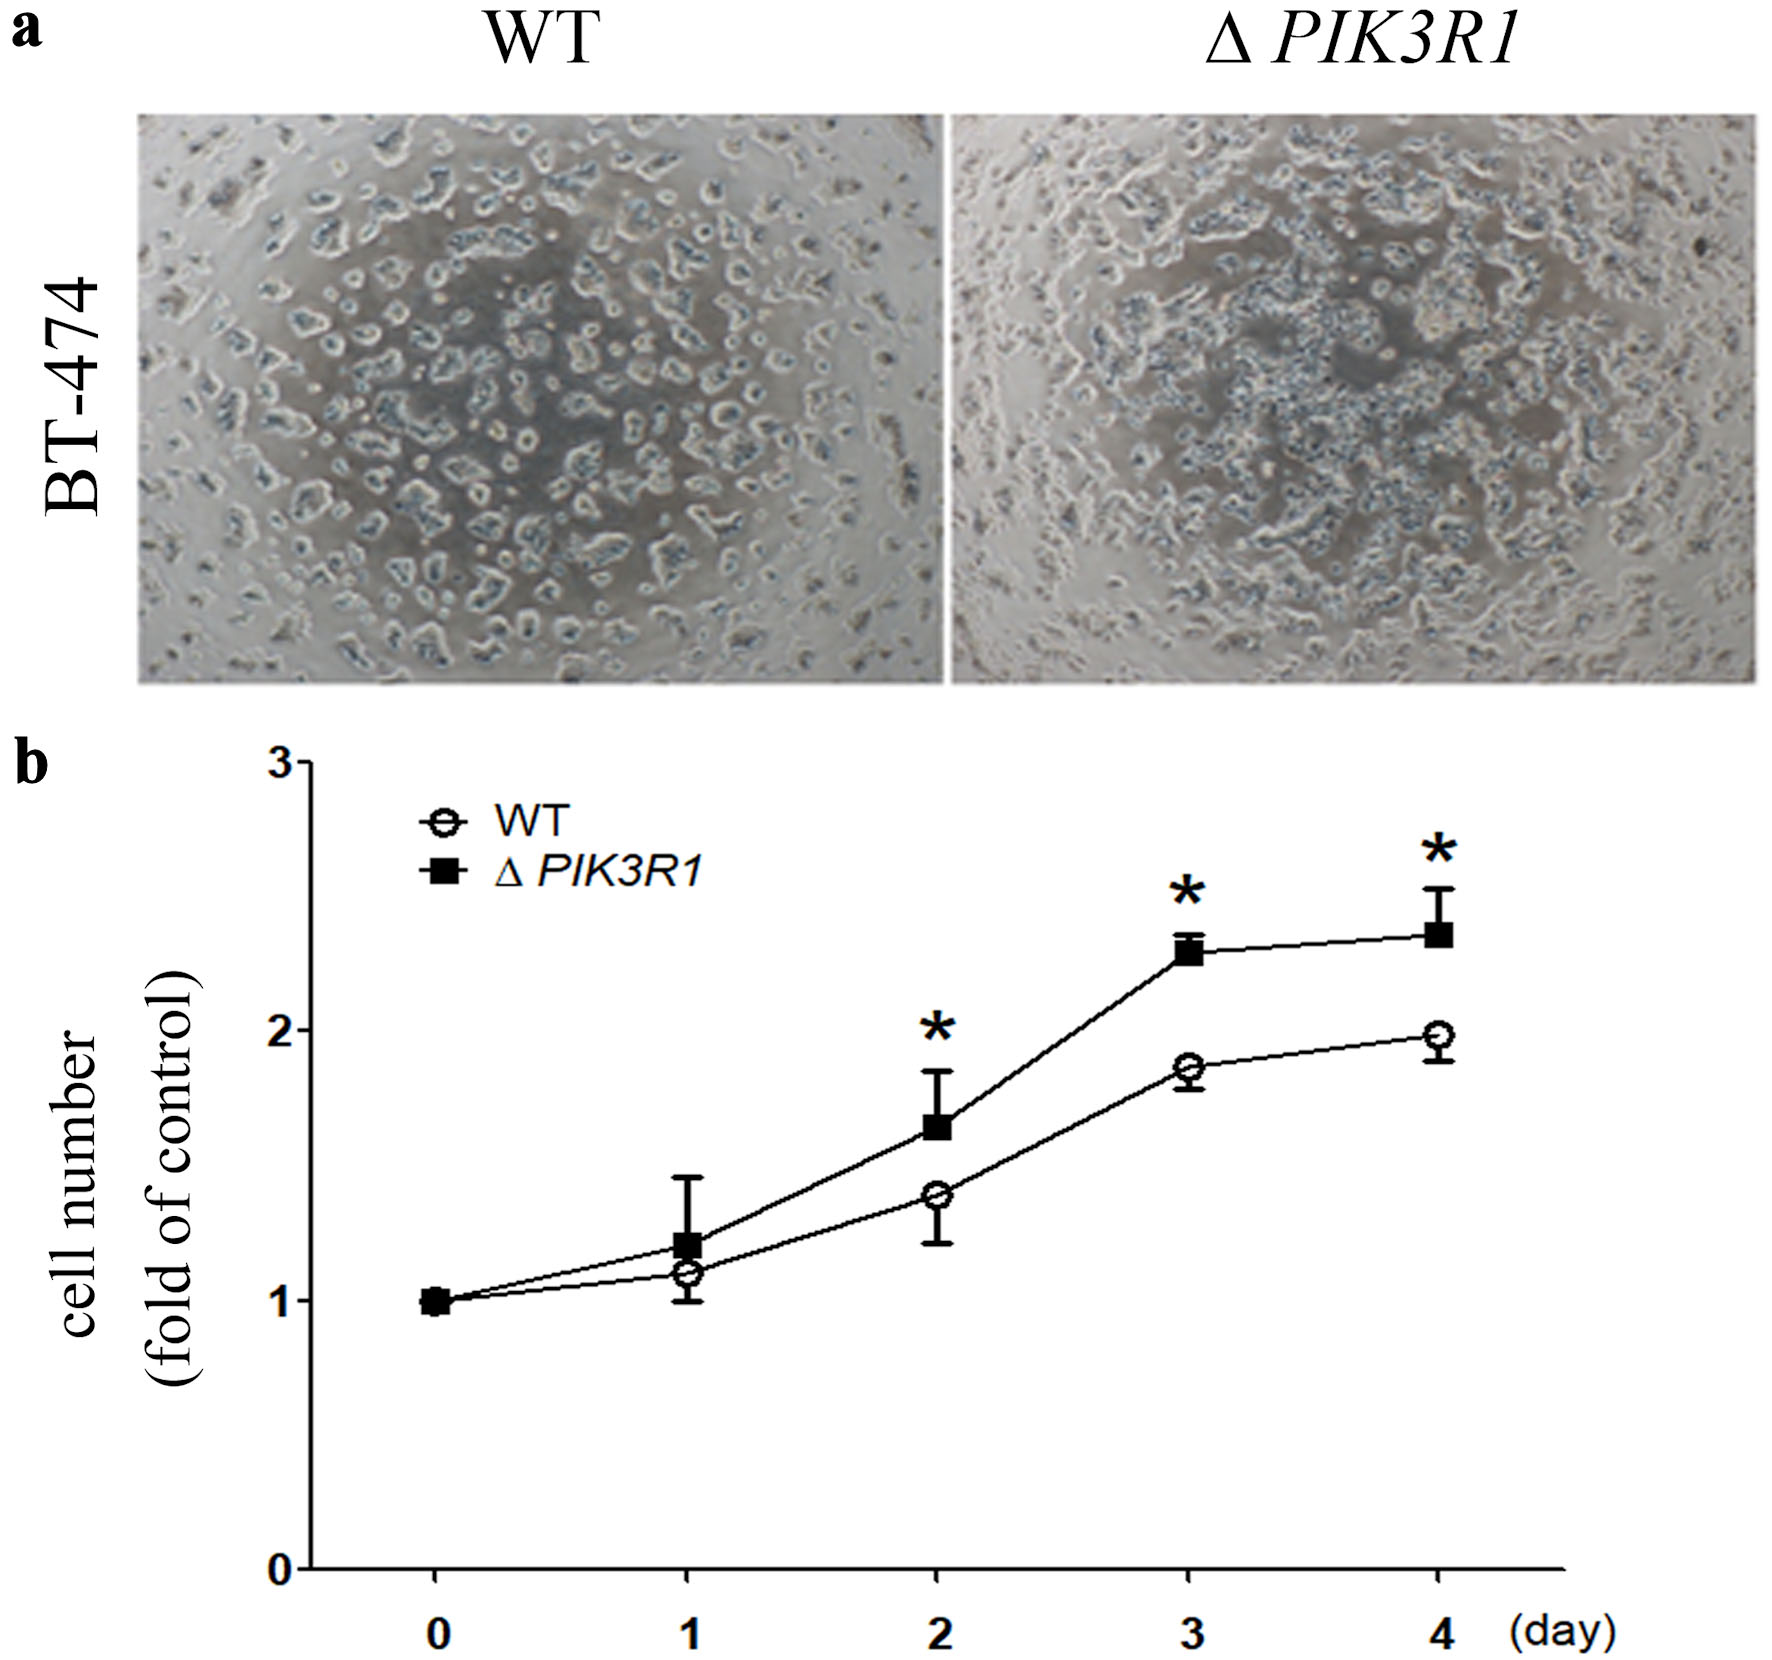
↓ Figure 1. Role of PIK3R1 on cell proliferation
in human breast cancer BT-474 cell line. After the PIK3R1 gene was silenced in the BT-474 cell
line, the resulting two cell lines (WT and ΔPIK3R1) were cultured and photographed under low power
(× 10) using a microscope (a). Cells numbers (WT and ΔPIK3R1) were quantified using the
trypan blue exclusion assay (b). Asterisks indicate a P value < 0.05 (two-way ANOVA). WT: wild type;
ANOVA: analysis of variance.
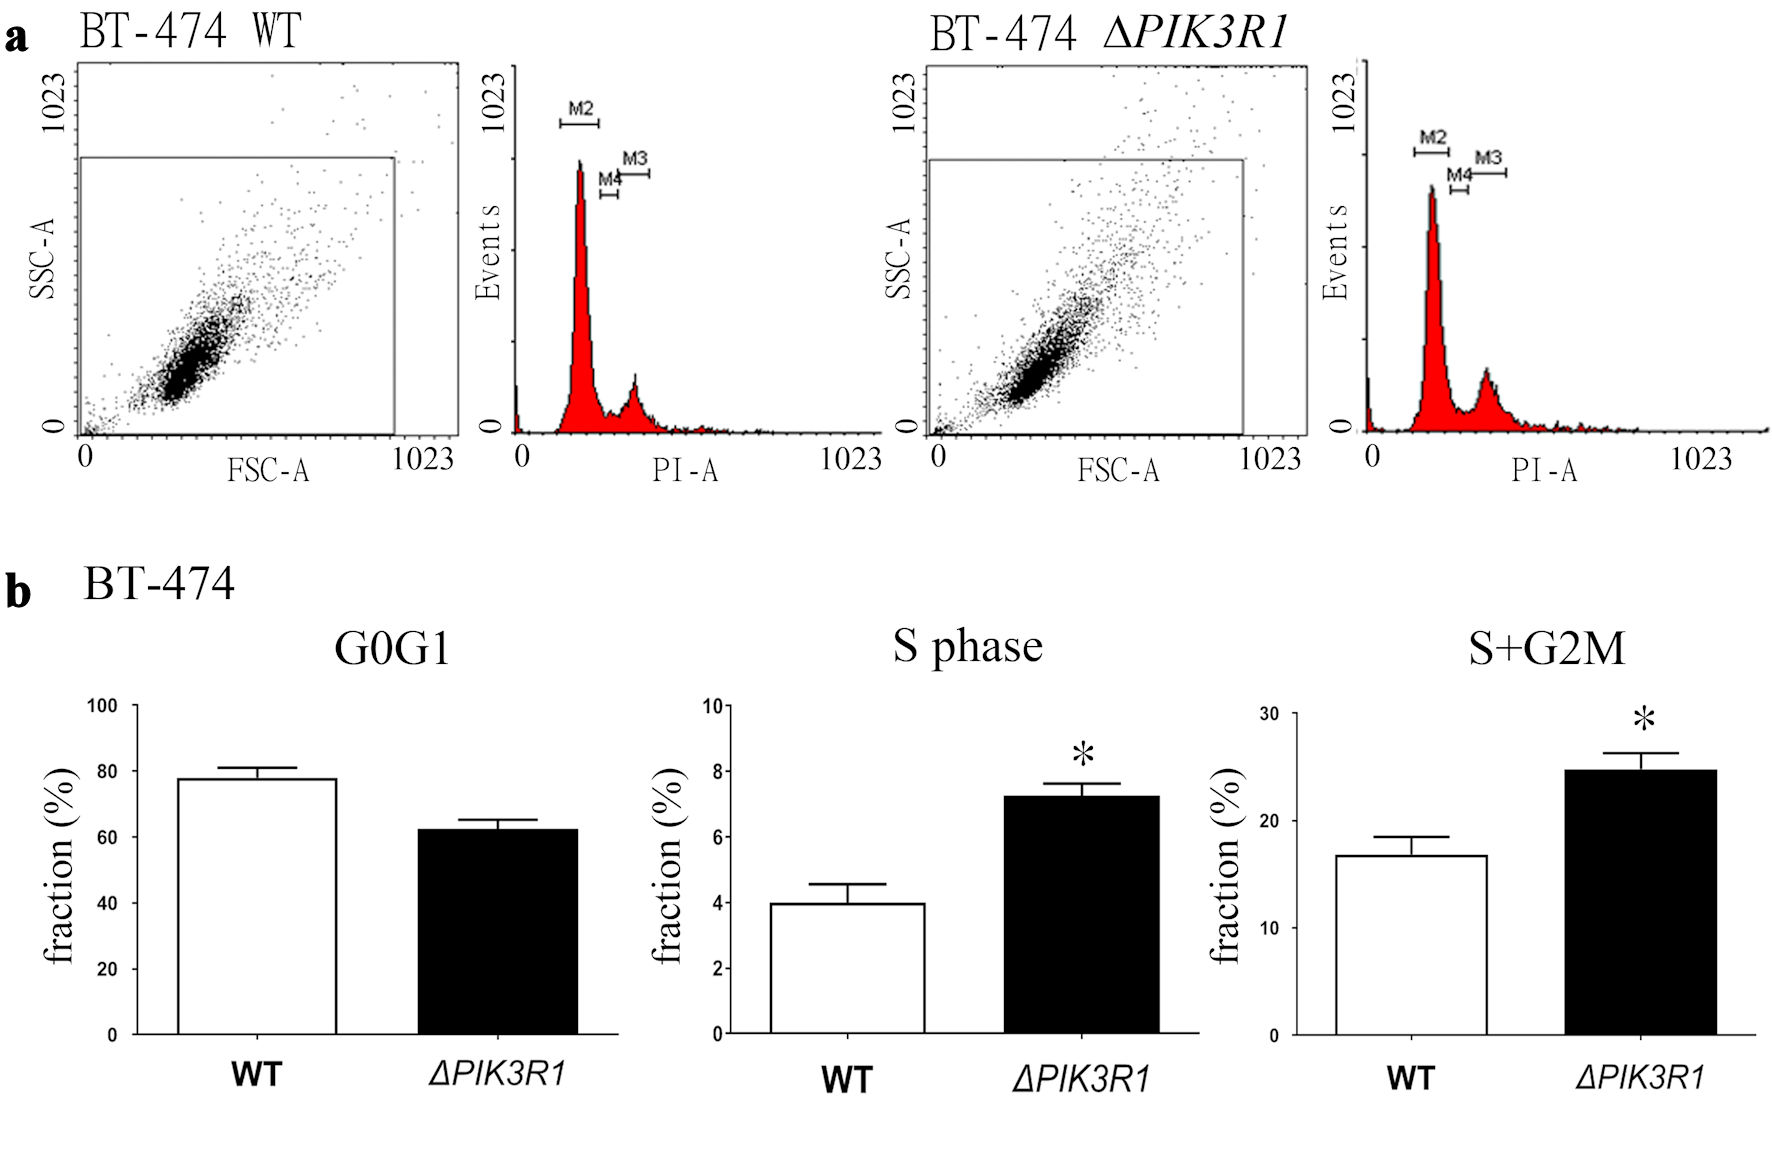
↓ Figure 2. Cell cycle analysis of the
ΔPIK3R1 and WT breast cancer BT-474 breast cancer cell lines. (a) For cell cycle analysis, 1
× 106 cells (both WT and ΔPIK3R1) were seeded as described in the Methods. (b) The
results are presented and quantified as the various cell cycle fraction (%), namely G0/G1 phase, S
phase, and G2/M phase. Asterisks indicate a P value < 0.05 by Mann-Whitney U test. FSC: forward
scatter; SSC: side scatter; PI: propidium iodide; WT: wild type.
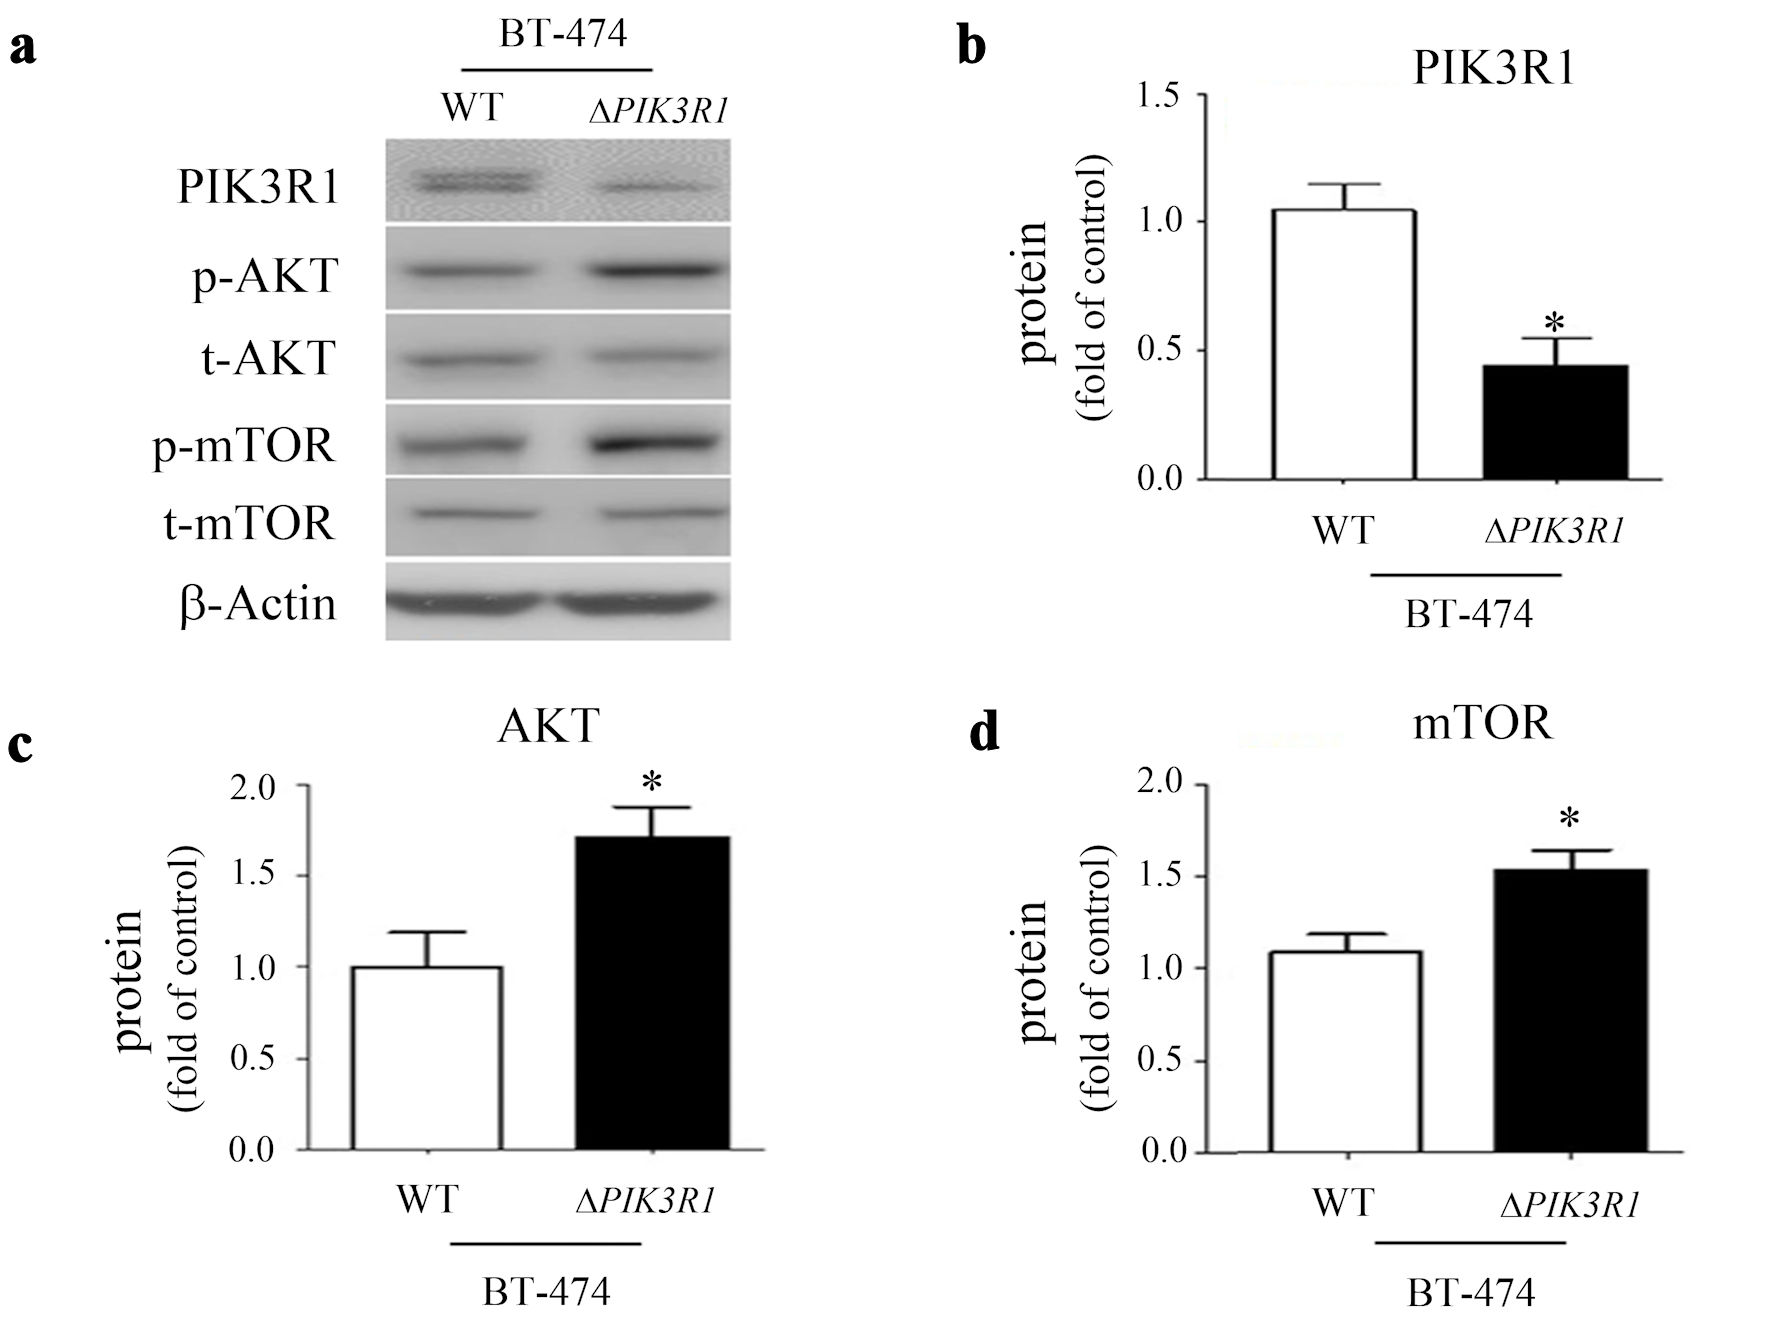
↓ Figure 3. The role of PIK3R1 in cell growth
signaling. Cell lysates obtained from BT-474 (both WT and ΔPIK3R1 cell lines) were subjected to
Western blot analysis and probed with various primary antibodies, namely PIK3R1/p85, p-AKT, t-AKT,
p-mTOR, mTOR and beta-actin (a). The protein expressions of PIK3R1/p85 (b), AKT (c) and mTOR (d) were
quantified as a relative ratio (t-protein/p-protein) and presented as fold of control
(ΔPIK3R1/WT). Asterisks indicate a P value < 0.05 by Mann-Whitney U test. WT: wild type.
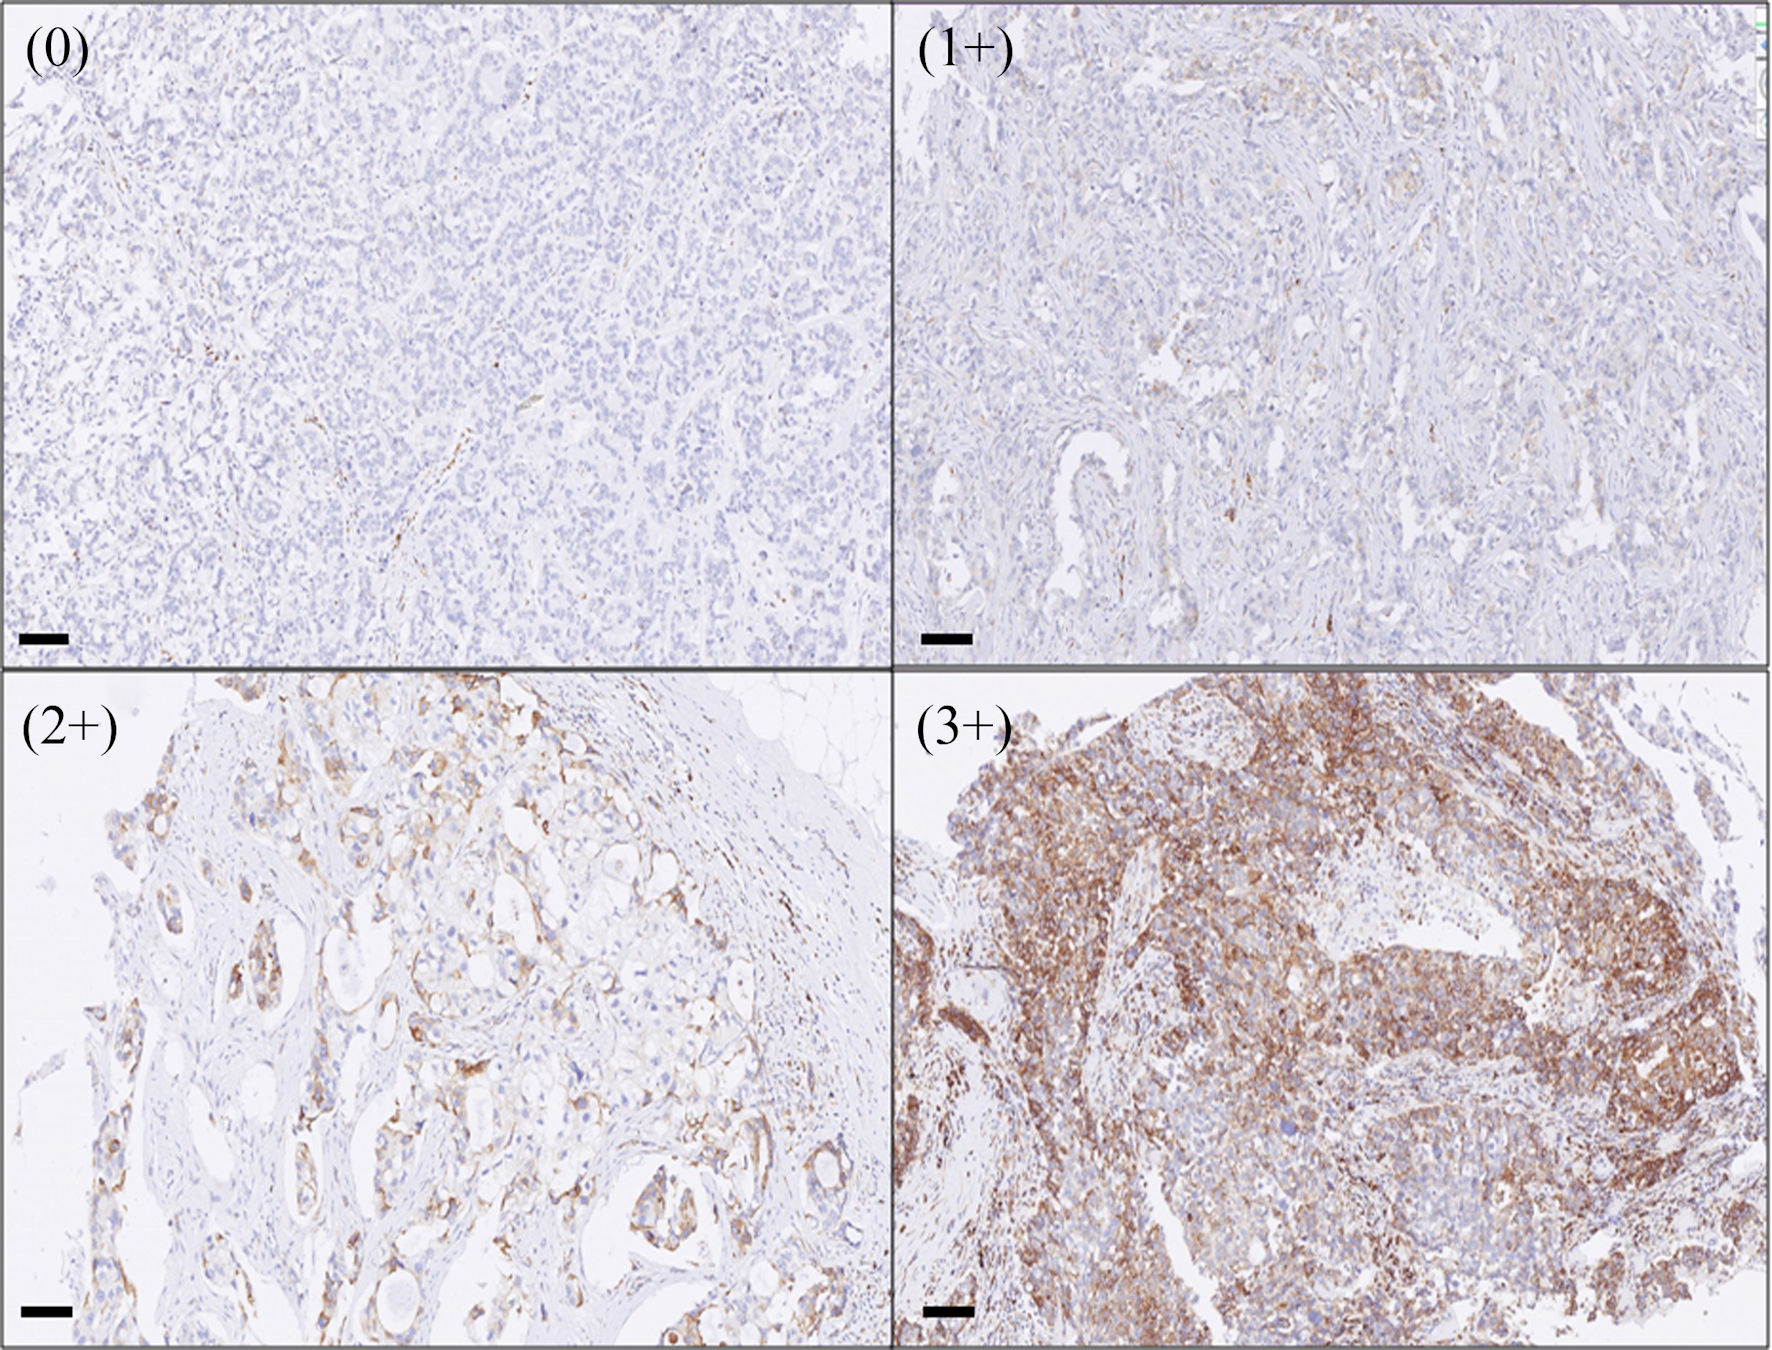
↓ Figure 4. The expression of PIK3R1 in human
breast cancer tumor tissue. When human breast tissues were stained with PIK3R1 antibody as described in
the Methods, the positivity of the protein expression was semi-quantified and expressed as 0 (< 10%),
1+ (11-25%), 2+ (26-50%), 3+ (> 50% of cells examined). Bars = 100 µm.
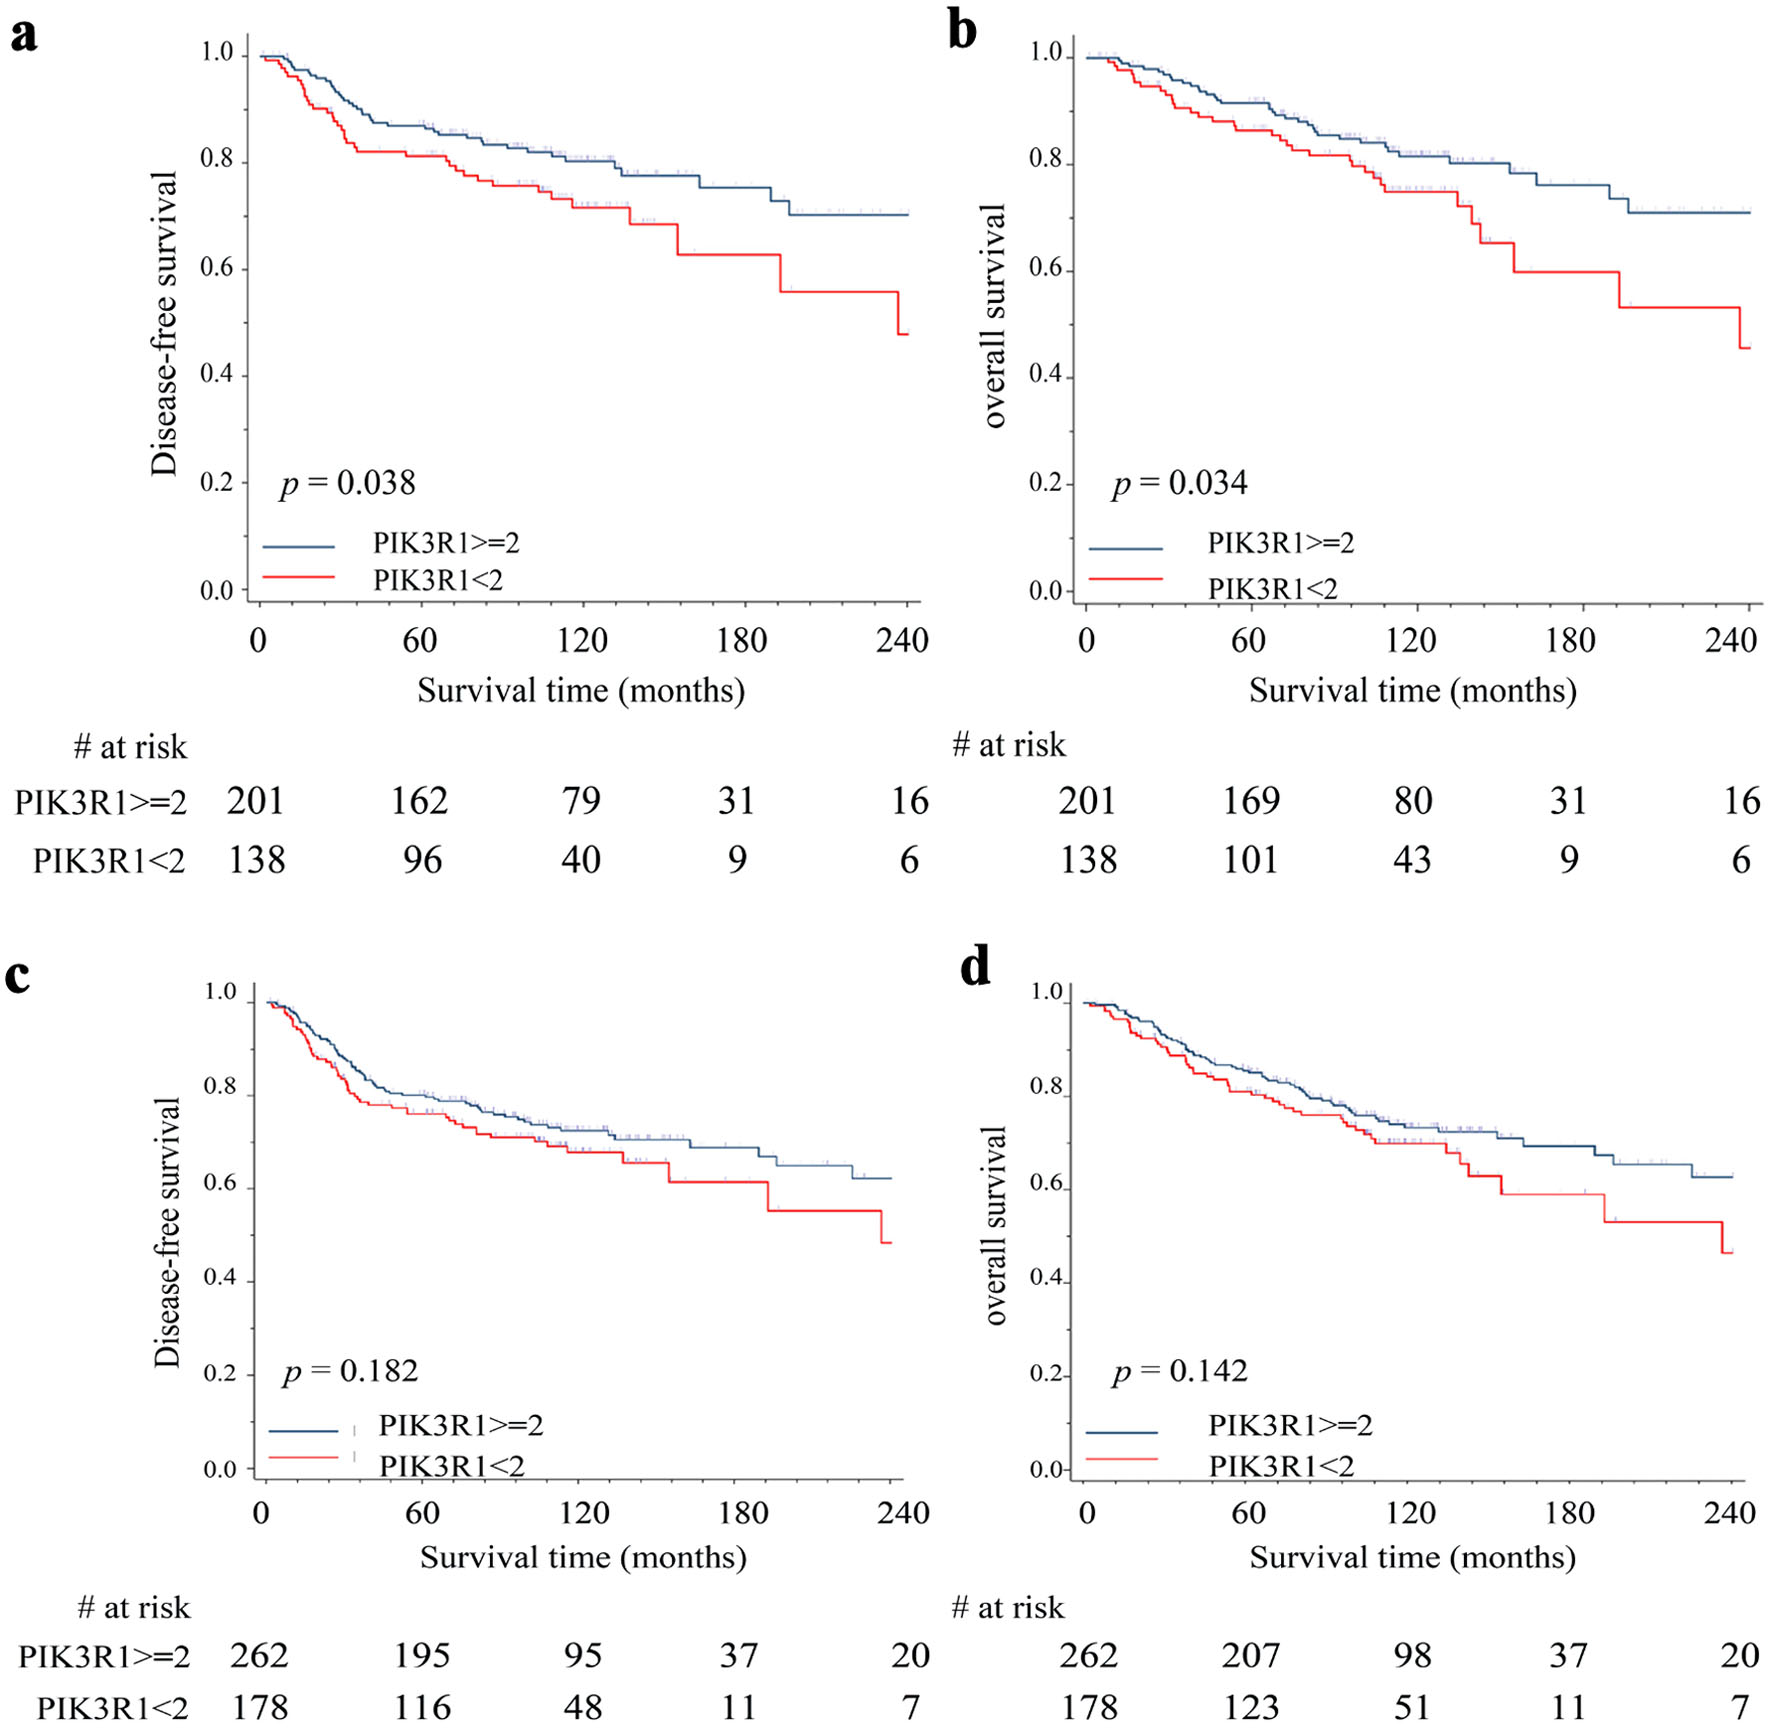
↓ Figure 5. Correlation between PIK3R1 expression
level and patient clinical outcomes. We performed immunohistochemical staining on surgically removed
tumor tissues (breast cancer tissue array) with anti-PIK3R1 antibody and correlated the results with
patient DFS/OS. Kaplan-Meier analysis was used to estimate patients’ outcome including DFS (a)
and OS (b) in stage I/II patients (n = 339) and in all stage patients DFS (n = 440) (c) and OS (d). High
expression of PIK3R1 protein indicates immunohistochemical staining score ≥ 2+; low expression of
PIK3R1 protein indicates immunohistochemical staining score < 2+. A P value < 0.05 indicates
statistical significance. DFS: disease-free survival; OS: overall survival.
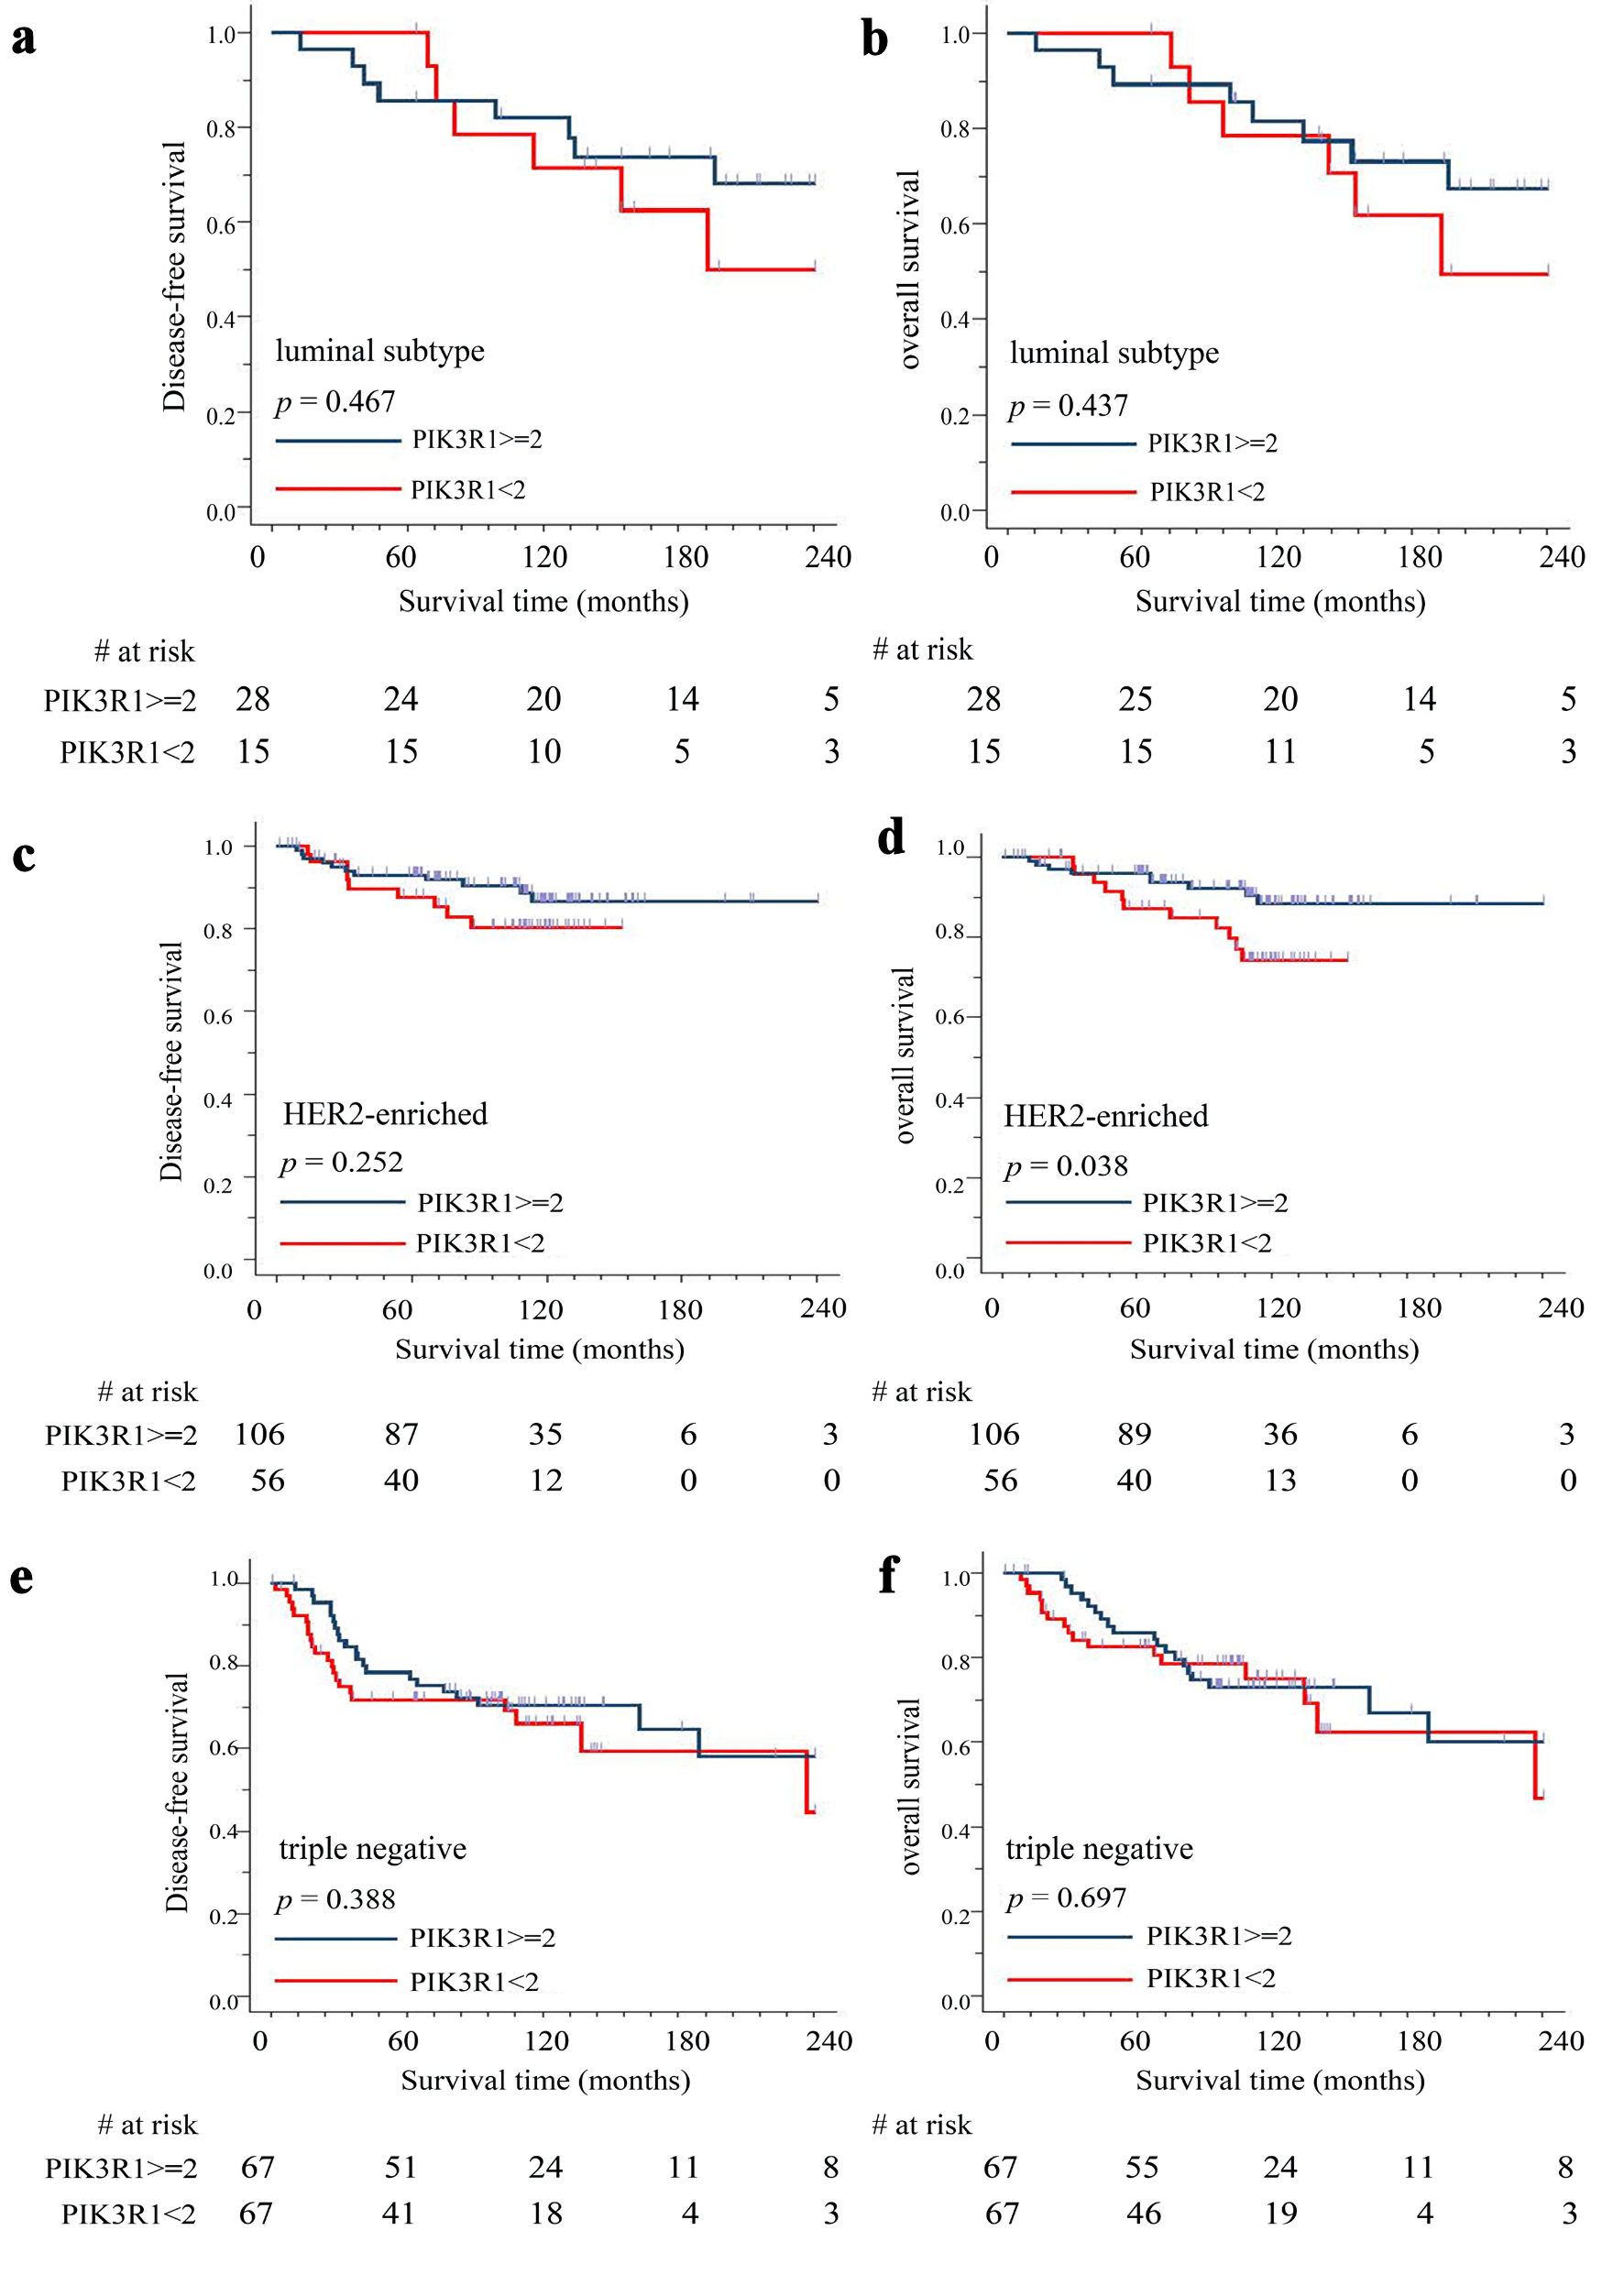
↓ Figure 6. Correlation between PIK3R1 expression
level and patient outcomes by different breast cancer subtypes. We performed immunohistochemical
staining on surgically removed tumor tissues (breast cancer tissue array) with anti-PIK3R1 antibody and
correlated the results with patient DFS/OS. Kaplan-Meier analysis was used to estimate stage I/II
patients’ outcome (n = 339) including disease-free survival (DFS) and overall survival (OS) in
luminal subtype DFS (n = 43) (a) and OS (b), HER2-enriched subtype DFS (n = 162) (c) and OS (d), and
triple-negative subtype DFS (n = 134) (e) and OS (f). High expression of PIK3R1 protein indicates
immunohistochemical staining score ≥ 2+; low expression of PIK3R1 protein indicates
immunohistochemical staining score < 2+. A P value < 0.05 indicates statistical significance.