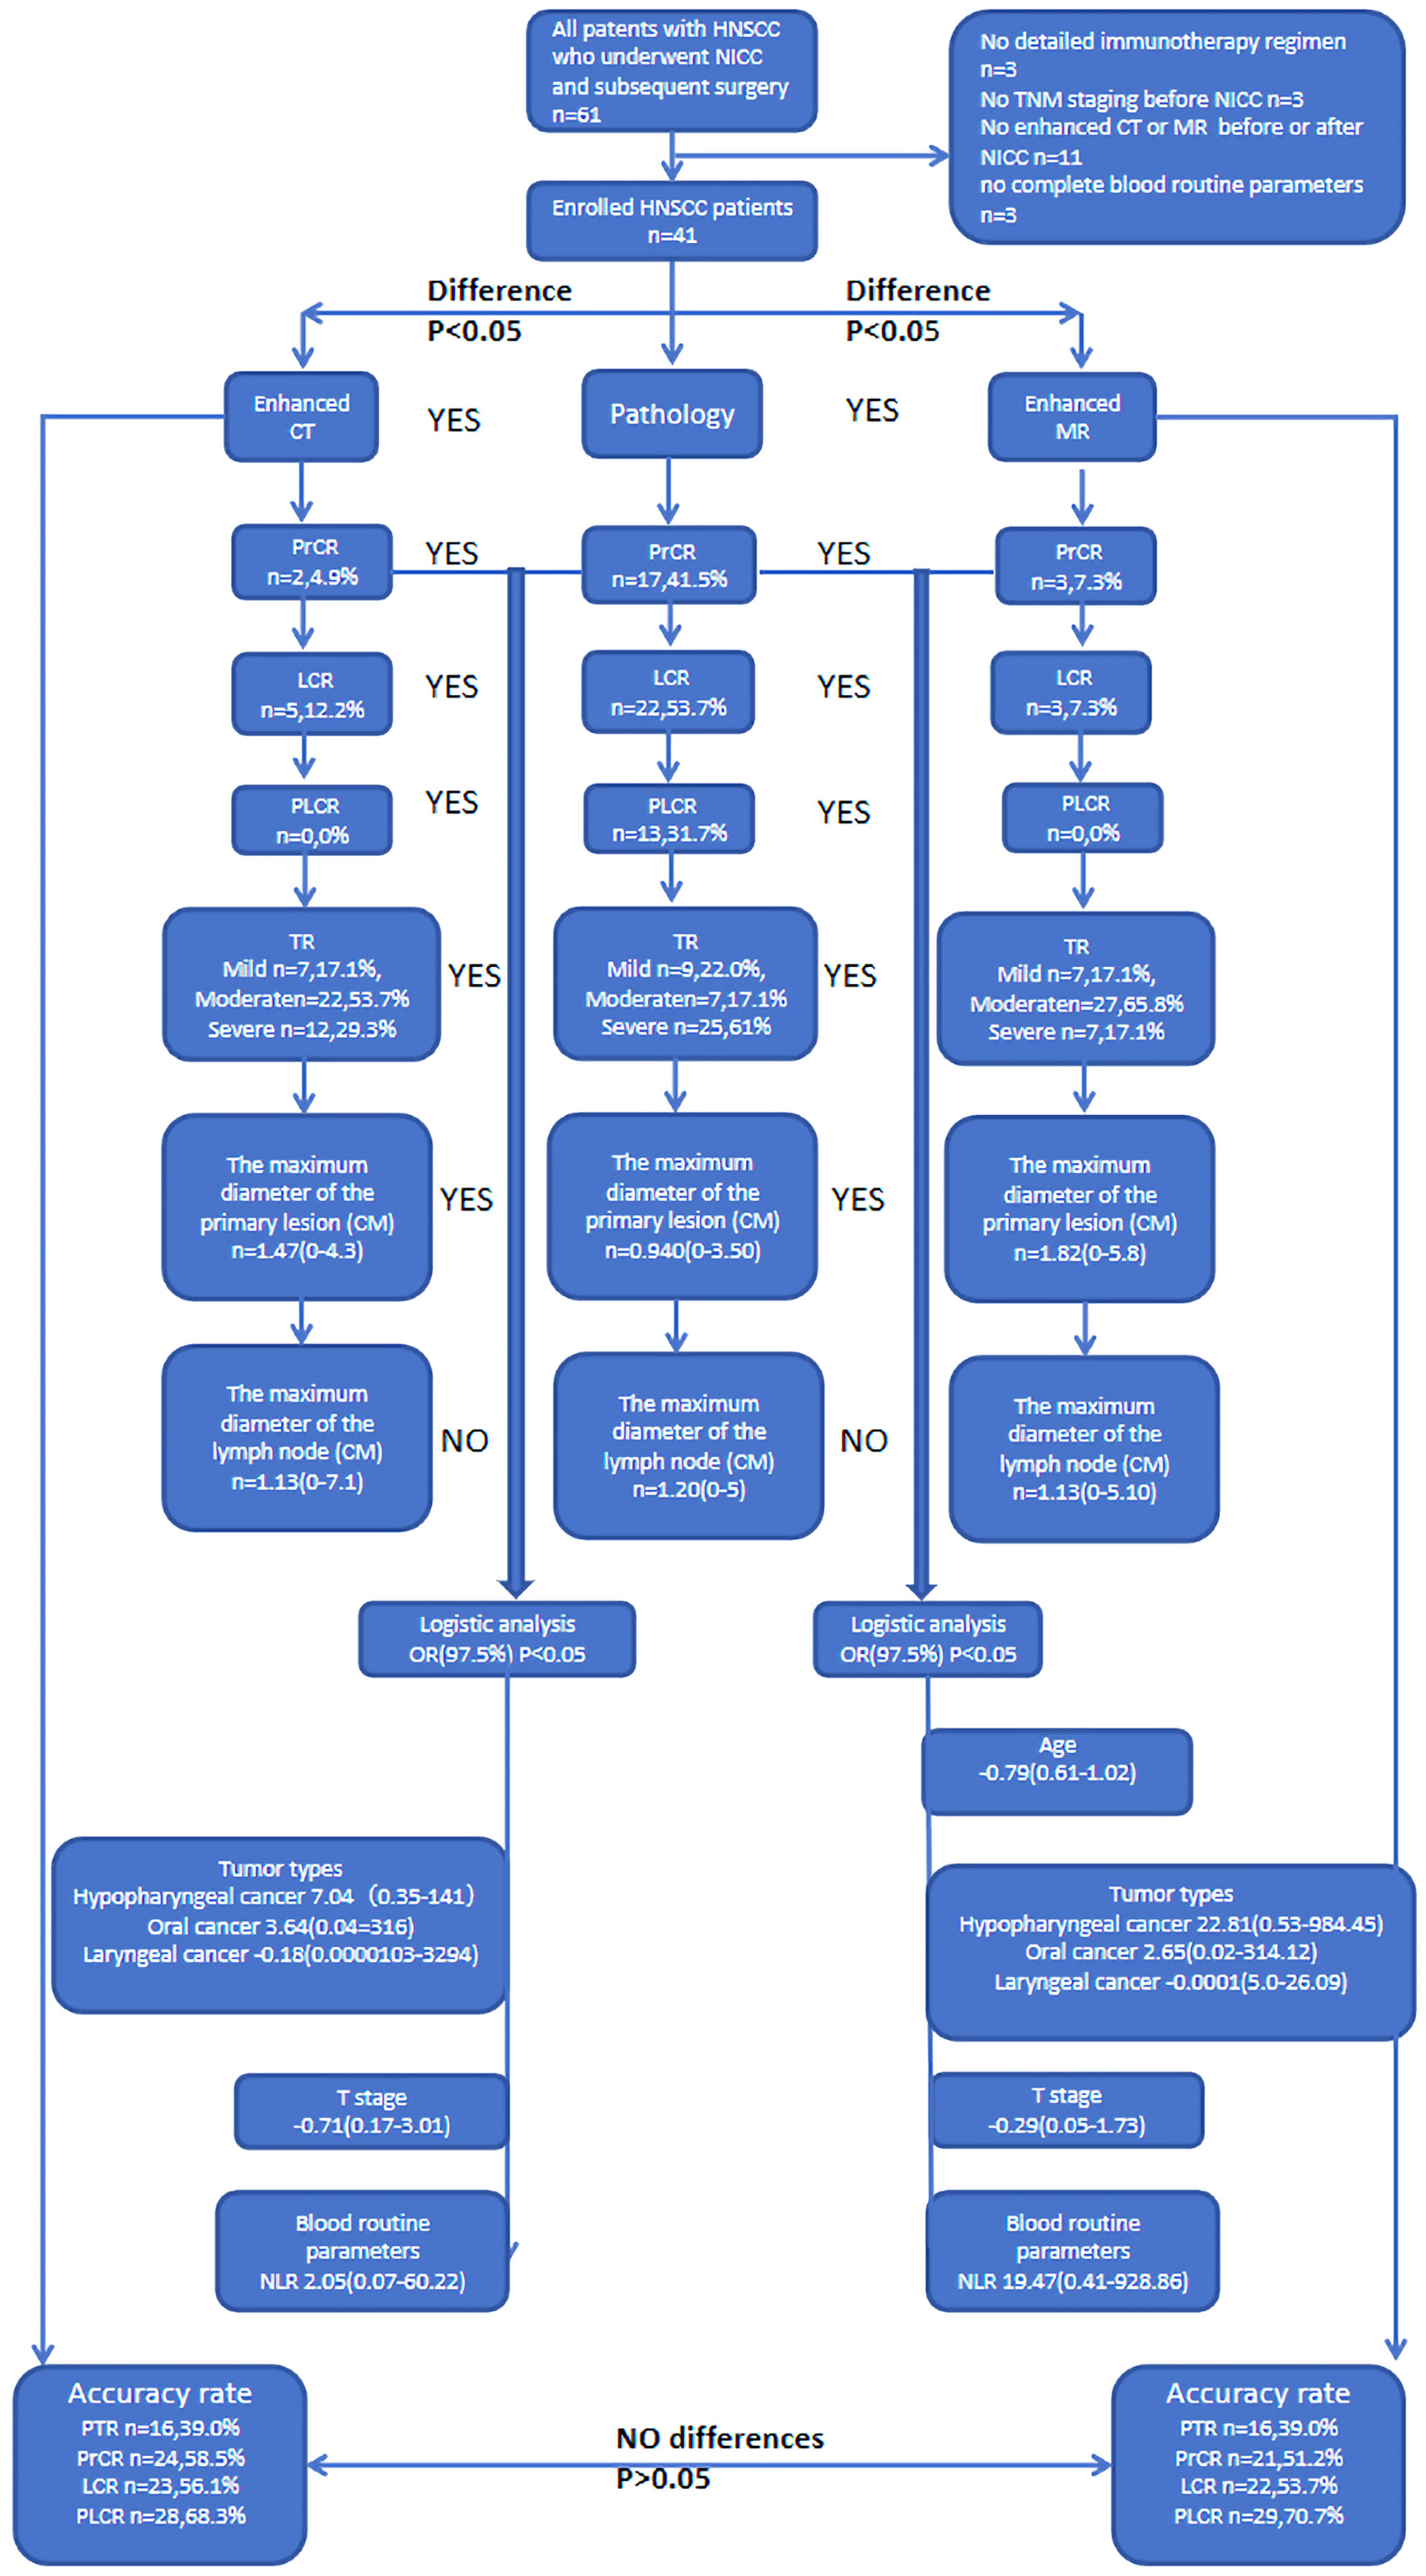
↓ Figure 1. Flow chart.
| World Journal of Oncology, ISSN 1920-4531 print, 1920-454X online, Open Access |
| Article copyright, the authors; Journal compilation copyright, World J Oncol and Elmer Press Inc |
| Journal website https://wjon.elmerpub.com |
Original Article
Volume 16, Number 1, February 2025, pages 59-69
Discordant Responses Between Imaging Examination and Surgical Pathology of Head and Heck Squamous Cell Carcinoma After Neoadjuvant Immunotherapy Combined With Chemotherapy
Figures
Tables
| Clinical characters | Number (%) |
|---|---|
| ICIs: immune checkpoint inhibitors; NLR: the ratio of neutrophils to lymphocytes; NEU: neutrophil; LYM: lymphocyte. | |
| Gender | |
| Female | 2 (4.9) |
| Male | 39 (95.1) |
| Age (years), mean (min - max) | 59.61 (34 - 75) |
| Tumor types | |
| Oropharyngeal cancer | 11 (26.8) |
| Hypopharyngeal cancer | 25 (61.0) |
| Oral cancer | 4 (9.8) |
| Laryngeal cancer | 1 (2.4) |
| Multiple cancer | |
| No | 37 (90.2) |
| Yes | 4 (9.8) |
| Differentiation | |
| High | 5 (12.2) |
| Mid | 23 (56.1) |
| Poor | 13 (31.7) |
| T state | |
| T1 | 5 (12.2) |
| T2 | 15 (36.6) |
| T3 | 8 (19.5) |
| T4a | 13 (31.7) |
| N sate | |
| N0 | 3 (7.3) |
| N1 | 1 (2.4) |
| N2a | 1 (2.4) |
| N2b | 24 (58.5) |
| N2c | 6 (14.6) |
| N3a | 0 (0) |
| N3b | 6 (14.6) |
| ICIs types | |
| Pabolizumab | 27 (65.9) |
| Tirellizumab | 10 (24.4) |
| Triplimab | 3 (7.3) |
| Sindilizumab | 1 (2.4) |
| Immunotherapy cycle | |
| 1 | 3 (7.3) |
| 2 | 31 (75.6) |
| 3 | 7 (17.1) |
| Blood routine parameters, mean (min - max) | |
| NEU (× 109/L) | 4.83 (2.15 - 12.24) |
| LYM (× 109/L) | 1.68 (0.61 - 2.91) |
| NLR | 1.68 (1.28 - 7.18) |
| Total | 41 (100) |
| Clinical characters | Pathology (%) | Enhanced CT (%) | P value |
|---|---|---|---|
| PrCR: complete response of the primary site; PLCR: complete response of the primary site and the lymph node; LCR: complete response of the lymph node; TR: tumor response; CT: computed tomography. | |||
| TR | 0.094 | ||
| Mild | 9 (22.0) | 7 (17.1) | |
| Moderate | 7 (17.1) | 22 (53.7) | |
| Severe | 25 (61.0) | 12 (29.3) | |
| PrCR | < 0.001 | ||
| Yes | 17 (41.5) | 2 (4.9) | |
| No | 24 (58.5) | 39 (95.1) | |
| LCR | < 0.001 | ||
| Yes | 22 (53.7) | 5 (12.2) | |
| No | 19 (46.3) | 36 (87.8) | |
| PLCR | < 0.001 | ||
| Yes | 13 (31.7) | 0 (0) | |
| No | 28 (68.3) | 41 (100) | |
| The maximum diameter of the primary lesion (cm), mean (min - max) | 0.940 (0 - 3.50) | 1.47 (0 - 4.3) | 0.022 |
| The maximum diameter of the lymph node (cm), mean (min - max) | 1.20 (0 - 5) | 1.13(0 - 7.1) | 0.805 |
| Clinical characters | Pathology (%) | Enhanced MR (%) | P value |
|---|---|---|---|
| PrCR: complete response of the primary site; PLCR: complete response of the primary site and the lymph node; LCR: complete response of the lymph node; TR: tumor response; MR: magnetic resonance. | |||
| TR | 0.006 | ||
| Mild | 9 (22.0) | 7 (17.1) | |
| Moderate | 7 (17.1) | 27 (65.8) | |
| Severe | 25 (61.0) | 7 (17.1) | |
| PrCR | < 0.001 | ||
| Yes | 17 (41.5) | 3 (7.3) | |
| No | 24 (58.5) | 38 (92.7) | |
| LCR | < 0.001 | ||
| Yes | 22 (53.7) | 3 (7.3) | |
| No | 19 (46.3) | 38 (92.7) | |
| PLCR | < 0.001 | ||
| Yes | 13 (31.7) | 0 (0) | |
| No | 28 (68.3) | 41 (100) | |
| The maximum diameter of the primary lesion (cm), mean (min - max) | 0.940 (0 - 3.50) | 1.82 (0 - 5.8) | < 0.001 |
| The maximum diameter of the lymph node (cm), mean (min - max) | 1.20 (0 - 5) | 1.13(0 - 5.10) | 0.779 |
| Clinical characters | Enhanced CT, OR (97.5%) | P value |
|---|---|---|
| ICIs: immune checkpoint inhibitors; CT: computed tomography; NLR: the ratio of neutrophils to lymphocytes; TR: tumor response; OR: odd ratio. | ||
| Gender, male | 1.03 (0.013 - 84.7) | 0.999 |
| Age (years) | -0.94 (0.78 - 1.15) | 0.998 |
| Tumor type | < 0.001 | |
| Hypopharyngeal cancer | 7.04 (0.35 - 141) | |
| Oral cancer | 3.64 (0.04 - 316) | |
| Laryngeal cancer | -0.18 (0.0000103 - 3,294) | |
| Multiple cancer | 1.000 | |
| Yes | 1.09 (0.023 - 51.4) | |
| Differentiation | -0.907 (0.19 - 4.37) | 0.999 |
| High | ||
| Mid | ||
| Poor | ||
| T stage | -0.71 (0.17 - 3.01) | < 0.001 |
| T1 | ||
| T2 | ||
| T3 | ||
| T4a | ||
| Immunotherapy cycle | 1.05 (0.14 - 7.79) | 1.000 |
| 1 | ||
| 2 | ||
| 3 | ||
| ICIs types | 1.09 (0.14 - 7.76) | 1.000 |
| Pabolizumab | ||
| Triplimab | ||
| Tirellizumab | ||
| Sindilizumab | ||
| Blood routine parameters | ||
| NLR | 2.05 (0.07 - 60.22) | < 0.001 |
| Clinical characters | Enhanced MR, OR (97.5%) | P value |
|---|---|---|
| ICIs: immune checkpoint inhibitors; TR: tumor response; NLR: the ratio of neutrophils to lymphocytes; OR: odd ratio; MR: magnetic resonance. | ||
| Gender, male | 1.25 (0.01 - 135.43) | 0.999 |
| Age (year) | -0.79 (0.61 - 1.02) | < 0.001 |
| Tumor type | < 0.001 | |
| Hypopharyngeal cancer | 22.81 (0.53 - 984.45) | |
| Oral cancer | 2.65 (0.02 - 314.12) | |
| Laryngeal cancer | -0.0001 (5.0 - 26.09) | |
| Multiple cancer | 1.000 | |
| Yes | -0.72 (0.010 - 53.99) | |
| Differentiation | 1.52 (0.28 - 8.33) | 0.999 |
| High | ||
| Mid | ||
| Poor | ||
| T stage | -0.29 (0.05 - 1.73) | < 0.001 |
| T1 | ||
| T2 | ||
| T3 | ||
| T4a | ||
| Immunotherapy cycle | 1.80 (0.19 - 16.99) | 0.999 |
| 1 | ||
| 2 | ||
| 3 | ||
| ICIs types | 1.07 (0.18 - 15.94) | 0.999 |
| Pabolizumab | ||
| Triplimab | ||
| Tirellizumab | ||
| Sindilizumab | ||
| Blood routine parameters | ||
| NLR | 19.47 (0.41 - 928.86) | < 0.001 |