World Journal of Oncology, ISSN 1920-4531 print, 1920-454X online, Open Access
Article copyright, the authors; Journal compilation copyright, World J Oncol and Elmer Press Inc
Journal website https://www.wjon.org

Original Article

Volume 15, Number 6, December 2024, pages 942-949


Clinicopathological Factors and Interleukin-6 Levels Associated With Low Relative Dose Intensity in Women With Breast Cancer Receiving First-Line Chemotherapy

Figure

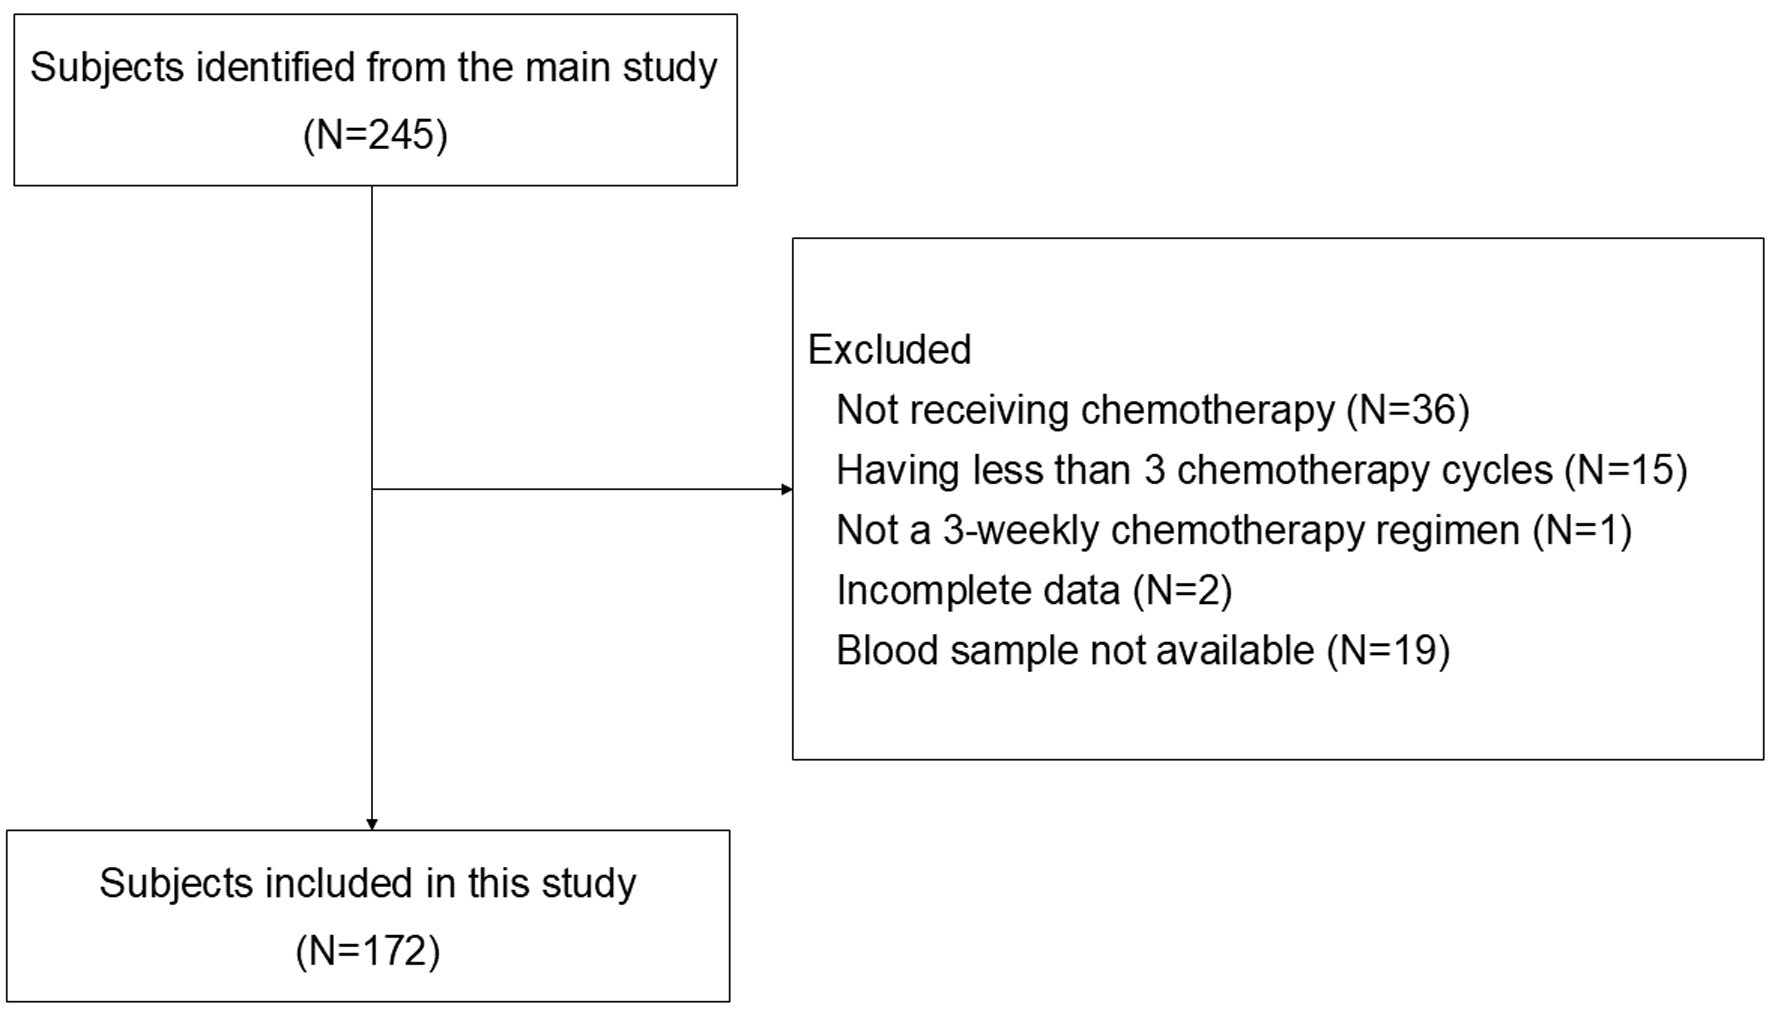
↓  Figure 1. Flowchart of subjects’ inclusion. From 245 patients in the main study, 73 patients were excluded due to not receiving chemotherapy, receiving less than 3 chemotherapy cycles, not having 3-weekly chemotherapy regimen, incomplete clinical data, and unavailability of stored blood sample. A total of 172 patients with stage I-IV BC were included for analysis.
Figure 1.

Tables

↓  Table 1. Baseline Characteristics (N = 172)
 
Variables Frequency (%)
SD: standard deviation; ER: estrogen receptor; PR: progesterone receptor; HER2: human epidermal growth factor receptor 2; AC-T: anthracycline/cyclophosphamide followed by taxane; AC: anthracycline/cyclophosphamide; AC-TH: anthracycline/cyclophosphamide followed by taxane and trastuzuma; T: taxane.
Age (years, mean ± SD) 52.07 ± 9.03
  ≤ 60 years 141 (82.0)
  > 60 years 31 (18.0)
Body mass index (kg/m2, mean ± SD) 23.94 ± 4.42
  ≥ 23 kg/m2 96 (55.8)
  < 23 kg/m2 76 (44.2)
Comorbidity presence
  No 73 (42.4)
  Yes 99 (57.6)
Diabetes mellitus comorbidity
  No 152 (88.4)
  Yes 20 (11.6)
Hypertension comorbidity
  No 132 (76.7)
  Yes 40 (23.3)
Cancer stage
  Stage I-II 52 (30.2)
  Stage III-IV 120 (69.8)
ER, PR, HER2 status
  ER+ or PR+, HER2- 85 (49.4)
  HER2+ 55 (32.0)
  ER-, PR-, HER2- 32 (18.6)
Chemotherapy setting
  Adjuvant/neoadjuvant 133 (77.3)
  Palliative 39 (22.7)
Chemotherapy regimen
  AC 18 (10.5)
  T 25 (14.5)
  AC-T 123 (71.5)
  Other (capecitabine) 6 (3.5)
Pre-treatment laboratory parameters
  Glucose (mg/dL, mean ± SD) 114.04 ± 35.94
  Albumin (g/dL, mean ± SD) 4.30 ± 0.56
  Vitamin D (ng/mL, mean ± SD) 9.19 ± 4.14


↓  Table 2. Clinicopathological and Pro-Inflammatory Factors Associated With RDI < 85%
 
Variables RDI < 85% (n = 23) RDI ≥ 85% (n = 149) Crude OR 95% CI P value Adjusted OR 95% CI P value
*P < 0.05. RDI: relative dose intensity; OR: odds ratio; 95% CI: 95% confidence interval; ER: estrogen receptor; PR: progesterone receptor; HER2: human epidermal growth factor receptor 2; AC-T: anthracycline/cyclophosphamide followed by taxane; CRP: C-reactive protein.
Age
  ≤ 60 years 17 (73.9) 124 (83.2) Ref
  > 60 years 6 (26.1) 25 (16.8) 1.75 0.63 - 4.88 0.284
Body mass index
  ≥ 23 kg/m2 10 (43.5) 86 (57.7) Ref Ref
  < 23 kg/m2 13 (56.5) 63 (42.3) 1.77 0.73 - 4.30 0.205 1.77 0.59 - 5.36 0.310
Comorbidity presence
  No 7 (30.4) 66 (44.3) Ref Ref
  Yes 16 (69.6) 83 (55.7) 1.82 0.71 - 4.68 0.215 0.87 0.25 - 2.96 0.820
Diabetes mellitus
  No 16 (69.6) 136 (91.3) Ref Ref
  Yes 7 (30.4) 13 (8.7) 4.58 1.59 - 13.14 0.005 4.78 1.03 - 22.27 0.046*
Hypertension
  No 17 (73.9) 115 (77.2) Ref
  Yes 6 (26.1) 34 (22.8) 1.19 0.44 - 3.26 0.730
Cancer stage
  Stage I-II 4 (17.4) 48 (32.2) Ref Ref
  Stage III-IV 19 (82.6) 101 (67.8) 2.26 0.73 - 6.99 0.158 1.03 0.24 - 4.45 0.964
ER, PR, HER2 status
  ER+ or PR+, HER2- 9 (39.1) 76 (51.0) Ref Ref
  HER2+ 8 (34.8) 47 (31.5) 1.44 0.52 - 3.98 0.485 1.64 0.46 - 5.87 0.447
  ER-, PR-, HER2- 6 (26.1) 36 (17.5) 1.95 0.63 - 6.00 0.245 6.45 1.39 - 29.83 0.017*
Chemotherapy setting
  Adjuvant/neoadjuvant 12 (52.2) 121 (81.2) Ref Ref
  Palliative 11 (47.8) 28 (18.8) 3.96 1.58 - 9.89 0.003 2.49 0.61 - 10.12 0.203
Chemotherapy regimen
  AC-T 14 (60.9) 109 (73.2) Ref Ref
  Other 9 (39.1) 40 (26.8) 1.75 0.70 - 4.36 0.228 0.99 0.29 - 3.39 0.986
Glucose
  ≤ 105.5 mg/dL 8 (40.0) 73 (54.5) Ref Ref
  > 105.5 mg/dL 12 (60.0) 61 (45.5) 1.79 0.69 - 4.67 0.231 0.99 0.29 - 3.39 0.986
Albumin
  ≥ 4.4 g/dL 7 (31.8) 78 (52.4) Ref Ref
  < 4.4 g/dL 15 (68.2) 71 (47.6) 2.35 0.91 - 6.10 0.078 2.19 0.59 - 8.04 0.239
Vitamin D
  ≥ 8.6 ng/mL 14 (60.9) 74 (49.7) Ref
  < 8.6 ng/mL 9 (39.1) 75 (50.3) 0.63 0.26 - 1.55 0.320
CRP
  ≤ 5 mg/L 10 (43.5) 75 (50.3) Ref
  > 5 mg/L 13 (56.5) 74 (49.7) 1.32 0.54 - 3.19 0.541
IL-6
  ≤ 0.5 pg/mL 12 (52.2) 125 (83.9) Ref Ref
  > 0.5 pg/mL 11 (47.8) 24 (16.1) 4.77 1.89 - 12.07 0.001 3.45 1.01 - 11.79 0.049*