Figures

Figure 1. Immunoblot of SCR or MK2 shRNA of (a) T24 and (b) HTB9 with and without 10 Gy radiation at 2, 24 and 48 h for p38, MK2 and HSP27 with their respective phosphoproteins and vinculin as a loading control. SCR: scrambled control; MK2: mitogen-activated protein kinase activated protein kinase 2; shRNA: short hairpin RNA; HSP27: heat shock protein 27.

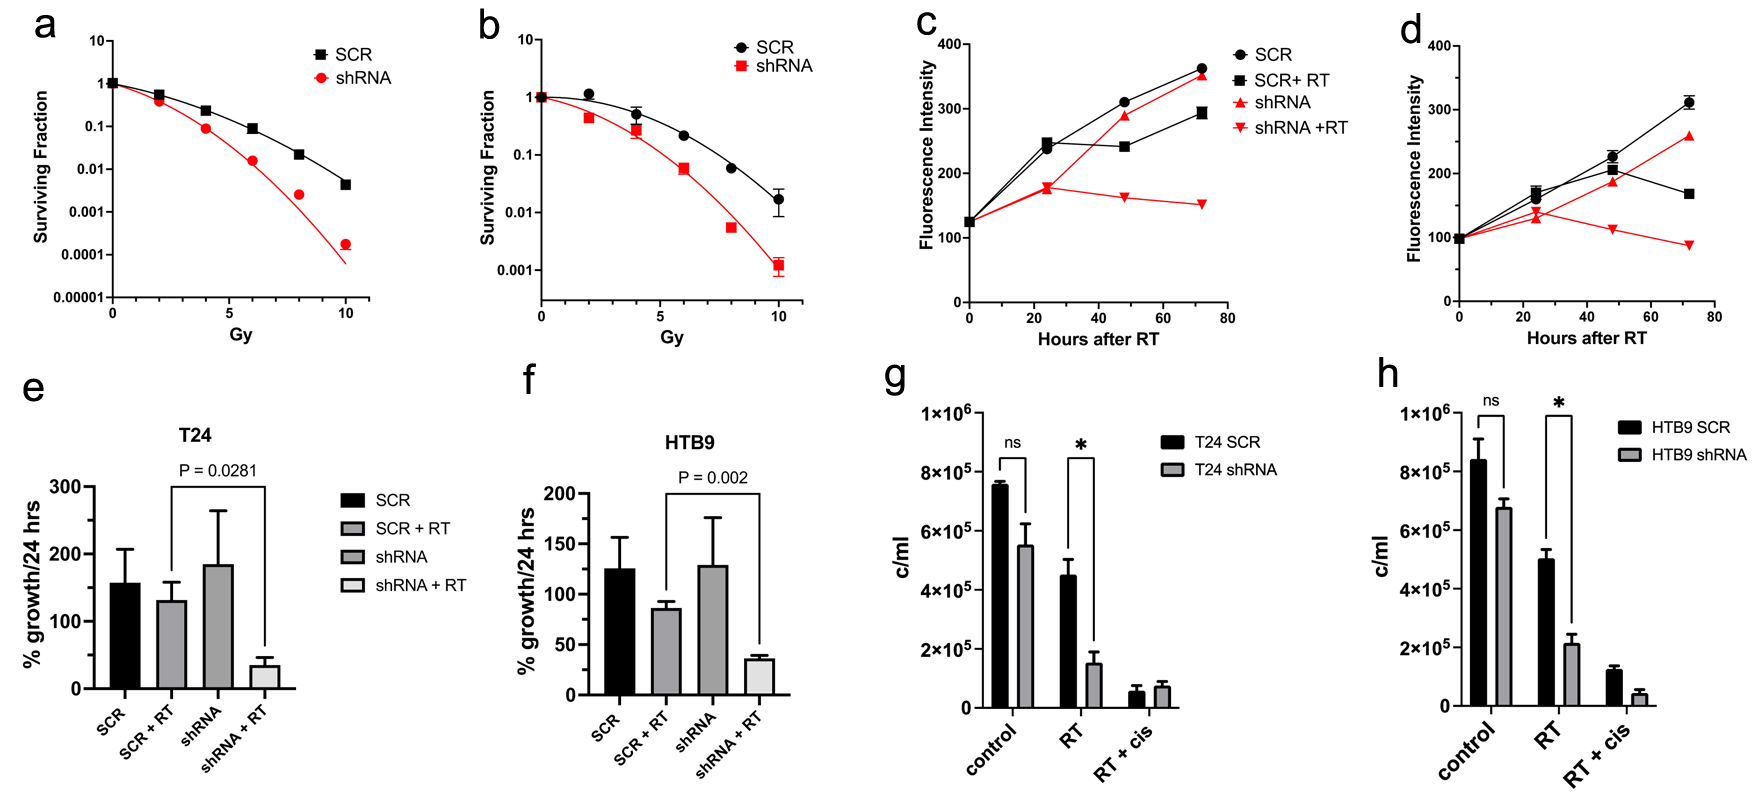
Figure 2. Clonogenic survival curves of SCR vs. shRNA for the cell lines of (a) T24 and (b) HTB9 cells treated with increasing doses of radiation from 2 to 10 Gy. The data are mean ± SEM, N = 3. Proliferation measurements comparing SCR vs. MK2 shRNA for 72 h of (c) T24 and (d) HTB9 cells with and without 10 Gy radiation. Data are representative of three experiments performed in triplicate. Maximum rate of growth in 24 h expressed as percentage of the maximum growth in SCR cells without RT in (e) T24 and (f) HTB9 cells. Data are mean ± SEM, n = 3. Live cell counts of cells by trypan blue exclusion of (g) T24 SCR vs. shRNA and (h) HTB9 SCR vs. shRNA after 48 h of 10 Gy RT. For a positive control, 25 mM cisplatin + 10 Gy RT was used. SCR: scrambled control; MK2: mitogen-activated protein kinase activated protein kinase 2; shRNA: short hairpin RNA; RT: radiotherapy; SEM: standard error of the mean.

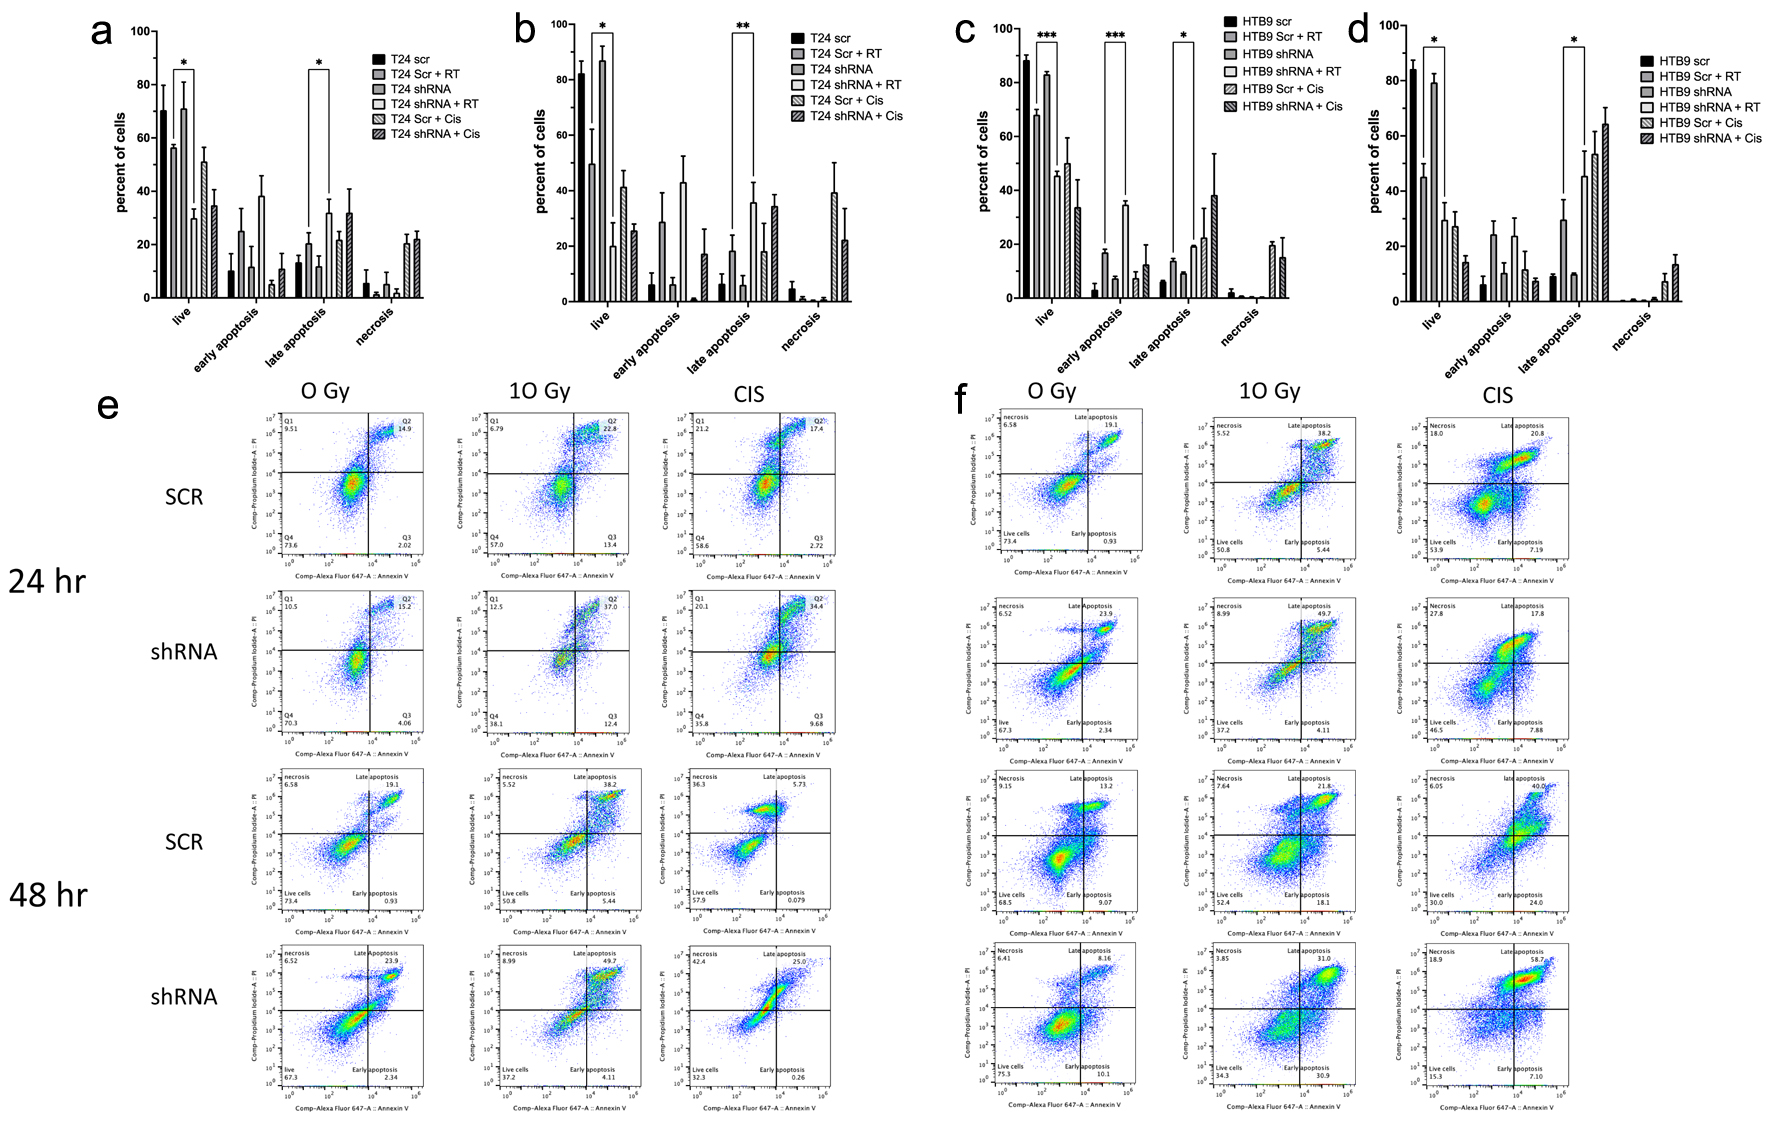
Figure 3. The analysis of apoptosis by annexin binding and flow cytometery. Data showing T24 SCR vs. shRNA cells at (a) 24 h and (b) 48 h post 10 Gy RT are shown in a histogram (data are mean ± SEM, n = 3) and are also as dot plots (e) from representative experiments. HTB9 SCR vs. shRNA cells show (c) 24 and (d) 48 h after RT in both histogram and dot blots (f) in a similar fashion. For a positive control, 10 mM cisplatin was used in both sets of data. All data are shown as mean ± SEM, n = 3. SCR: scrambled control; shRNA: short hairpin RNA; RT: radiotherapy; SEM: standard error of the mean.

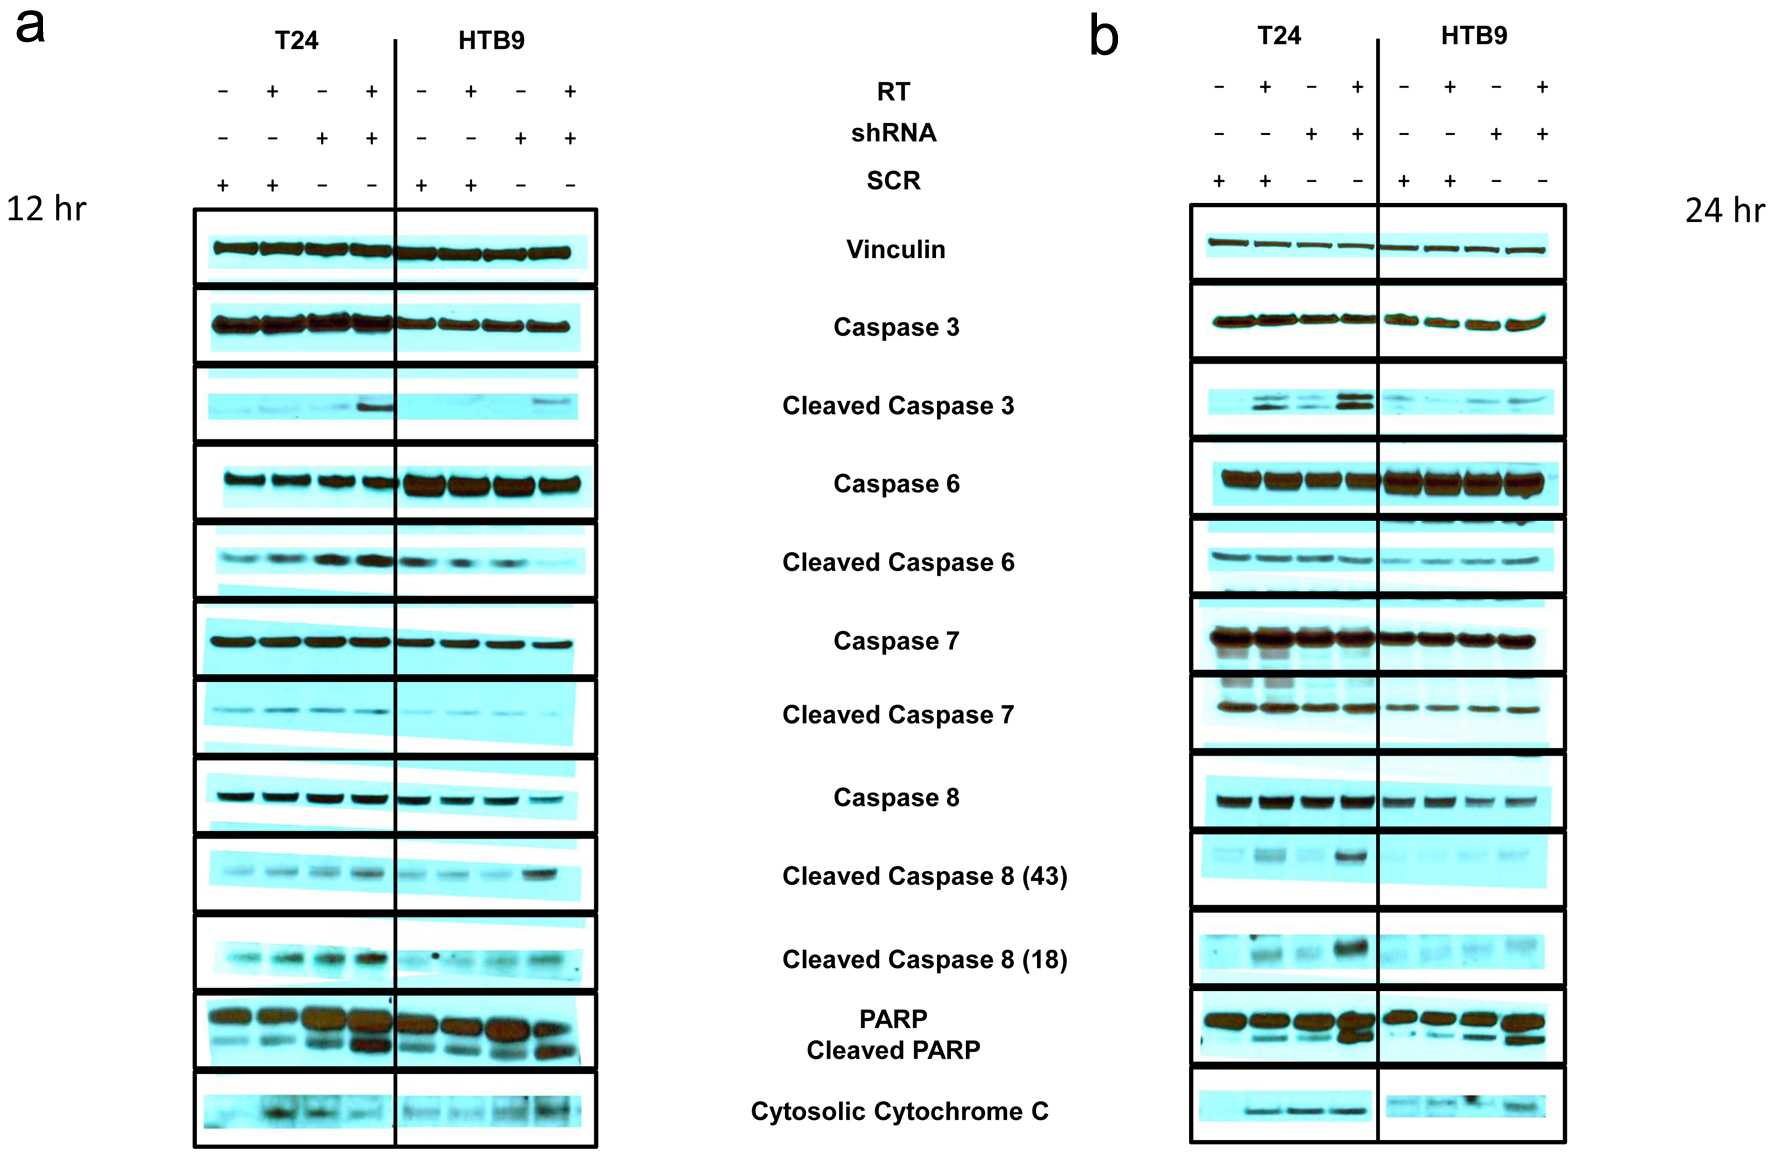
Figure 4. Immunoblot of apoptosis markers (a) 12 h and (b) 24 h after radiation in T24 SCR vs. shRNA with and without 10 Gy RT (left panels) and HTB9 SCR vs. shRNA with and without RT (right panels). Vinculin is used as a loading control. SCR: scrambled control; shRNA: short hairpin RNA; RT: radiotherapy.

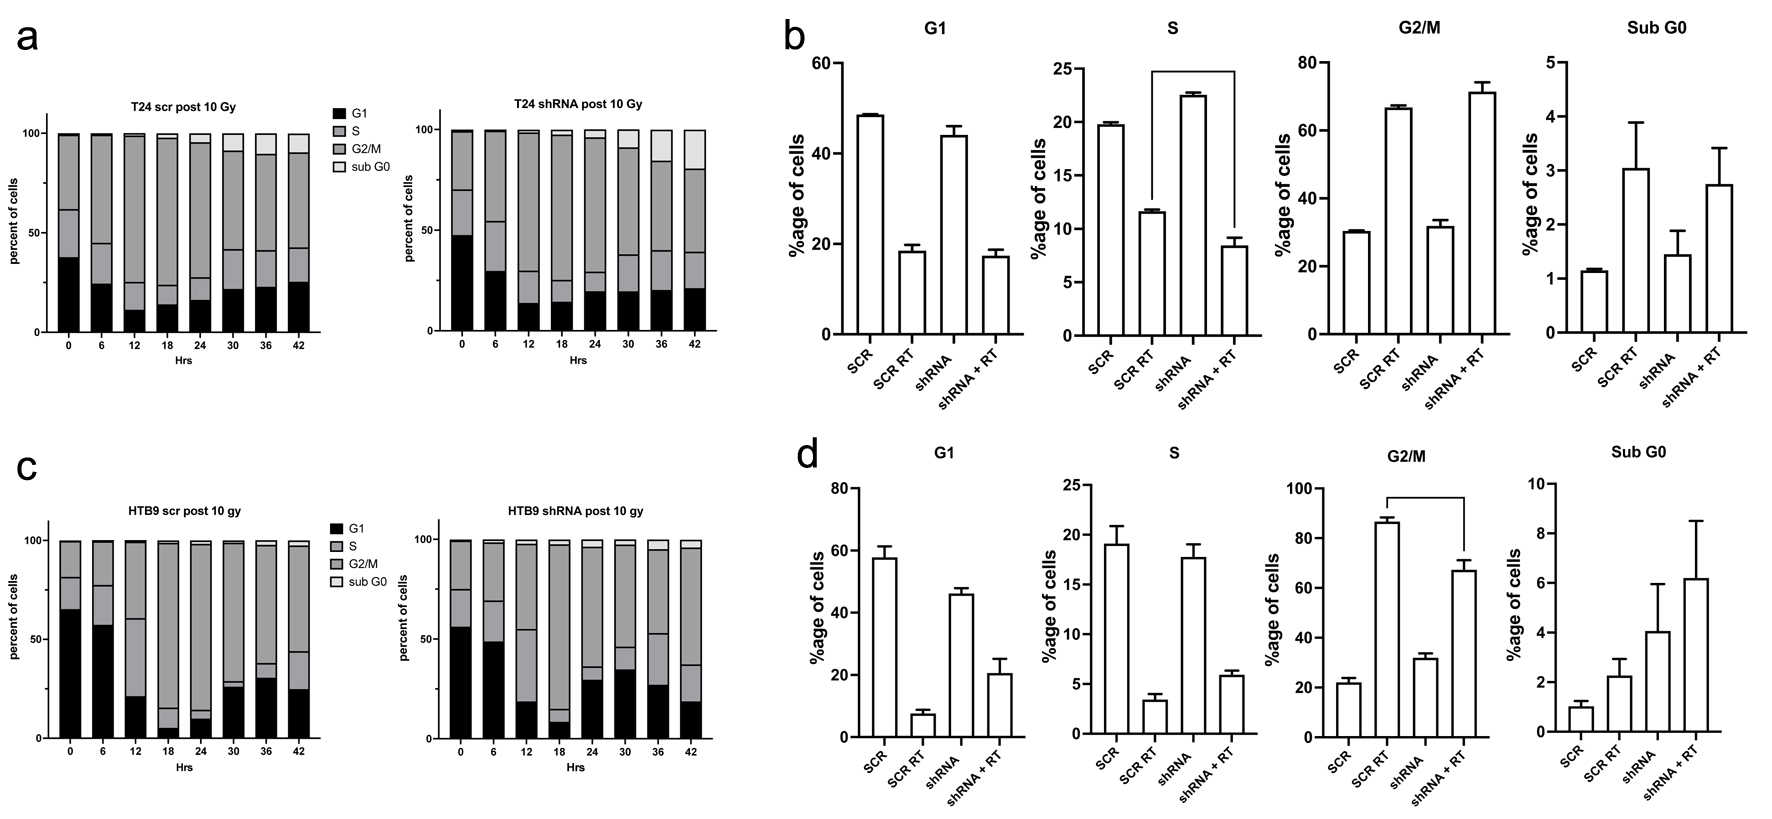
Figure 5. Cell cycle analysis of T24 SCR vs. shRNA cells (a, b) and HTB9 SCR vs. shRNA cells (c, d) as determined by propidium iodine (PI) staining post 10 Gy RT. a and c show a representative time course of the changes in cell cycle progression after a dose of 10 Gy irradiation to (a) T24 SCR vs. shRNA cells and (b) HTB9 SCR vs. shRNA cells. c and d show histograms of the differences in the percentage population of cells in the various cell cycle stages 24 h after 10 Gy RT (mean ± SEM, n = 3). SCR: scrambled control; shRNA: short hairpin RNA; RT: radiotherapy; SEM: standard error of the mean.


