Figures
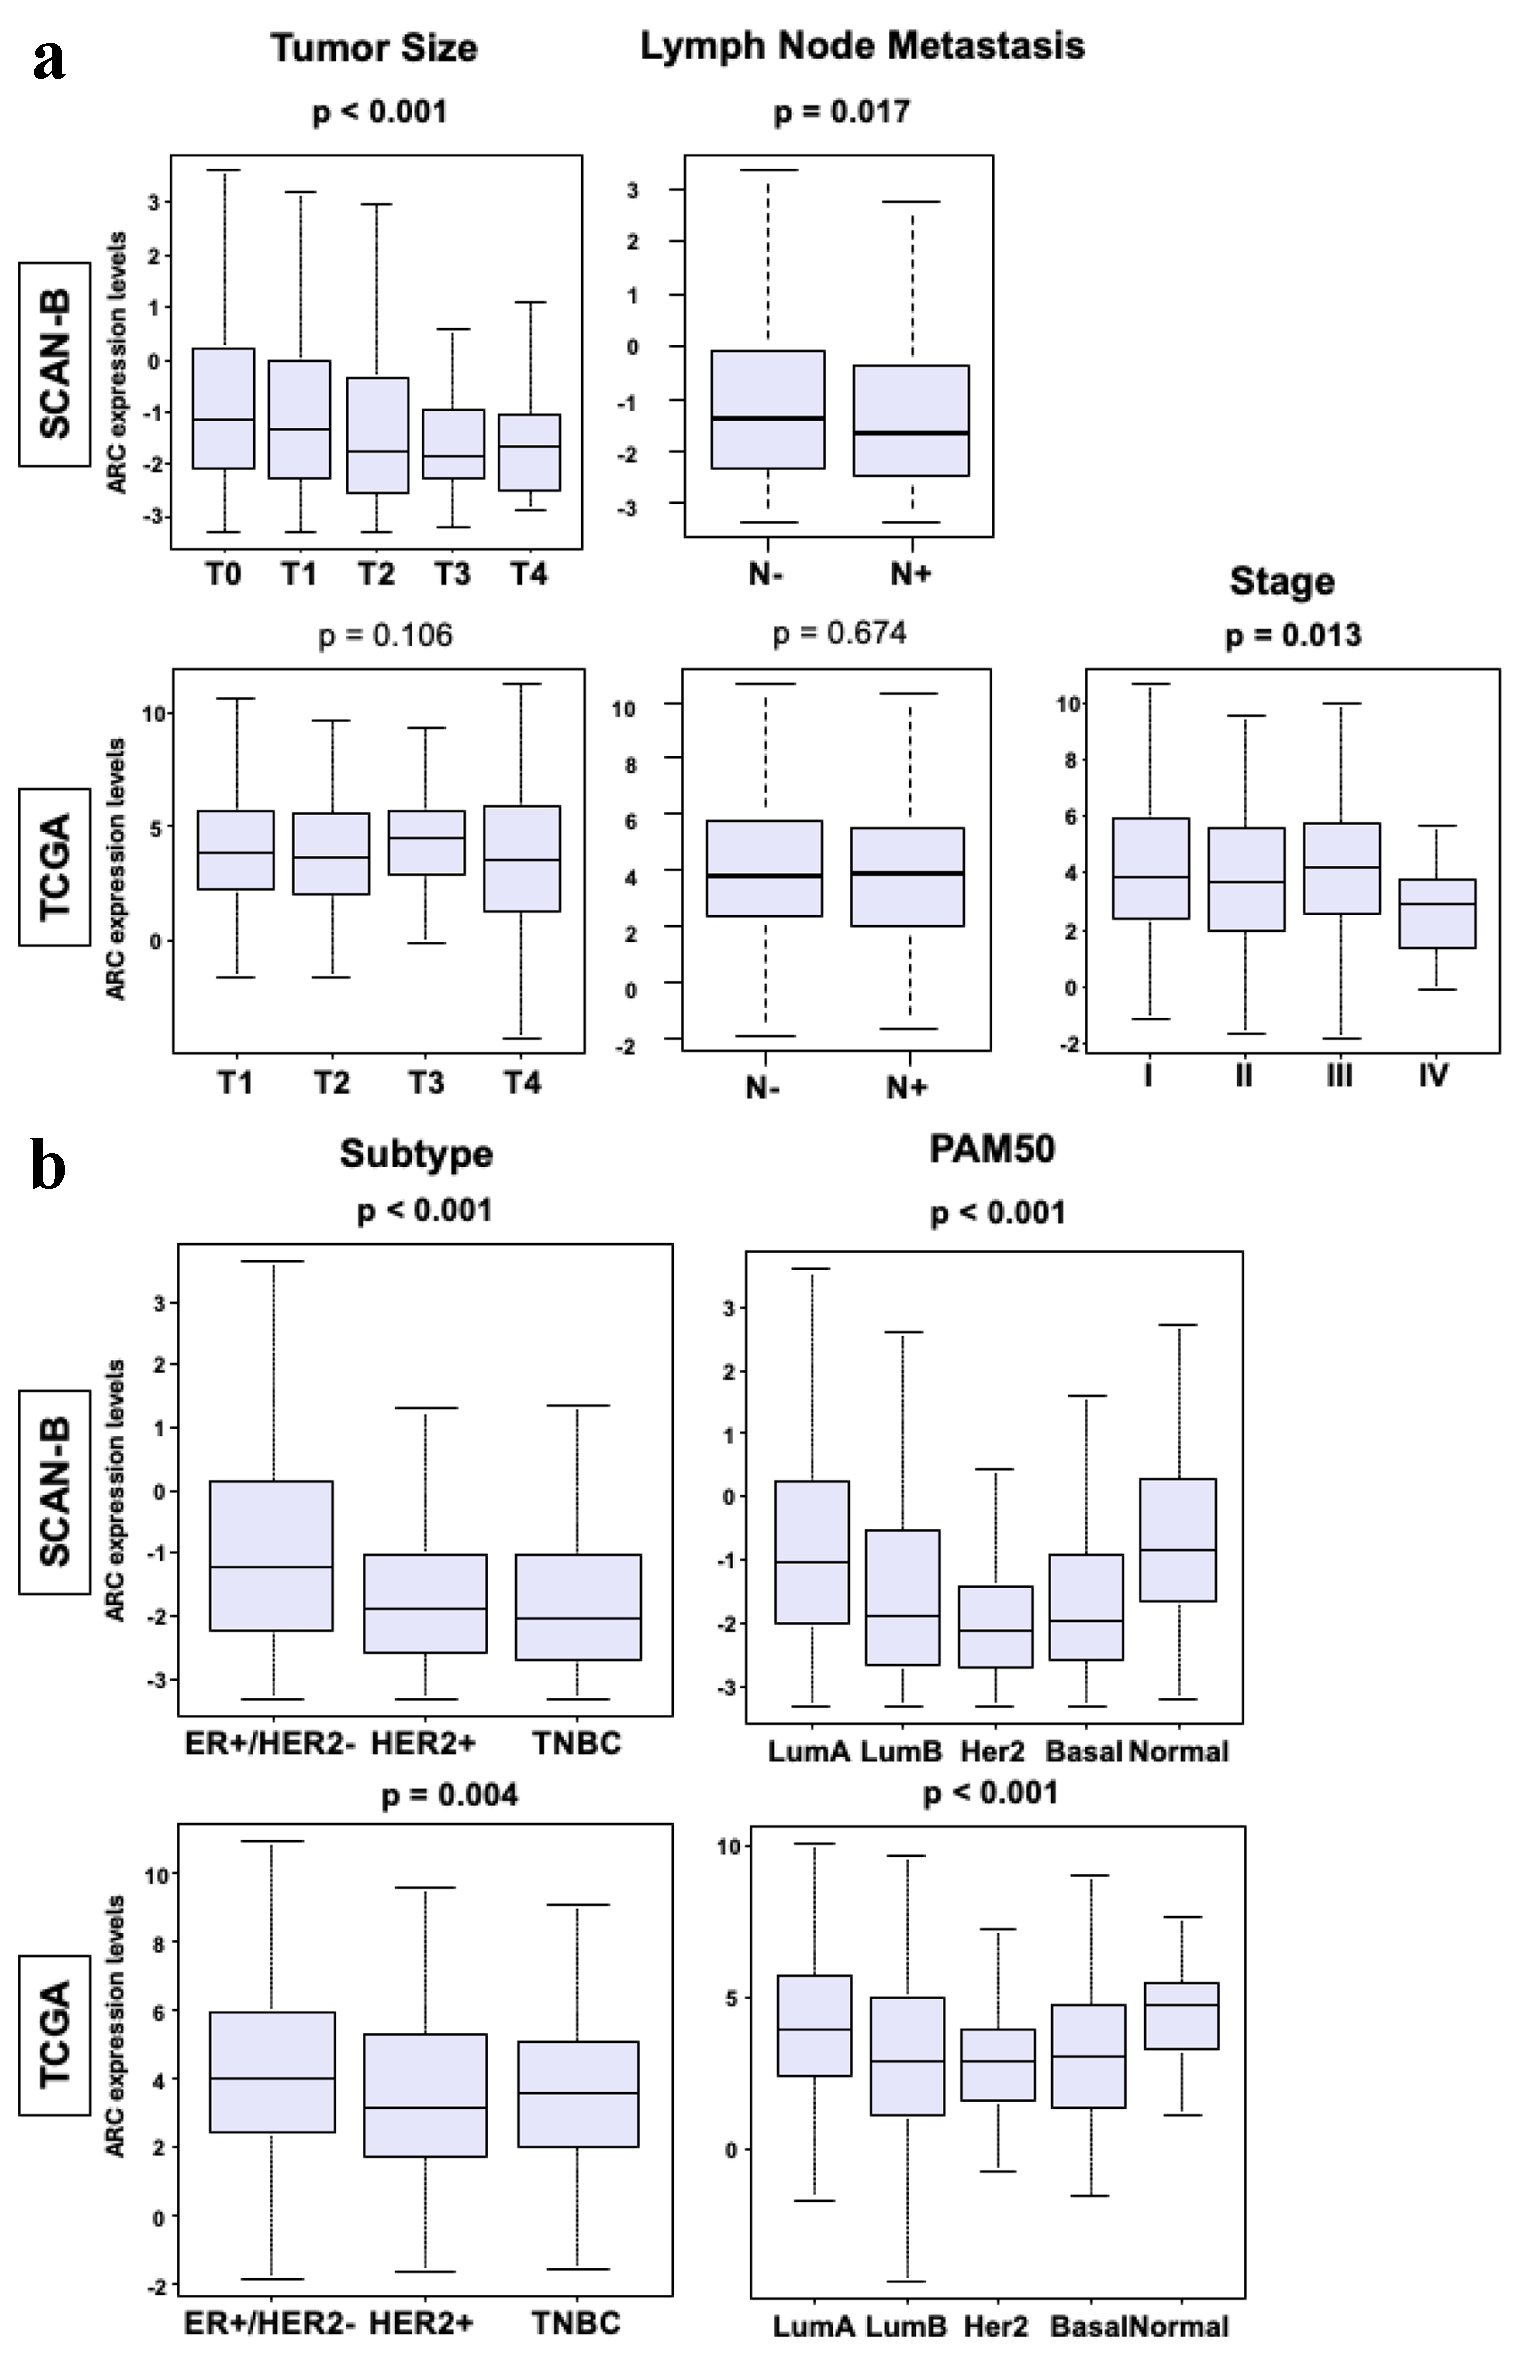
↓ Figure 1. Clinical parameters of breast cancers
in SCAN-B and TCGA cohorts. (a) Box plots of tumor size, lymph node metastasis and stage in the SCAN-B
and TCGA cohorts. The Y-axis demonstrates ARC expression level. The X-axis represents tumor size (T1,
T2, T3 and T4), patients with and without lymph node metastasis, and stage (I, II, III and IV) in each
cohort. (b) Box plot of the subtypes of breast cancer in SCAN-B and TCGA cohorts. The X-axis represents
ER-positive/HER2-negative, HER2-positive, TNBC, luminal A type, luminal B type, HER2-positive, basal
type, or normal type. The Y-axis demonstrates ARC expression level. The Mann-Whitney U test and
Fisher’s exact test were used to calculate P-values. ARC: activity-regulated
cytoskeleton-associated protein; ER: estrogen receptor; HER2: human epidermal growth factor receptor 2;
SCAN-B: Sweden Cancerome Analysis Network - Breast; TCGA: The Cancer Genome Atlas; TNBC: triple negative
breast cancer.
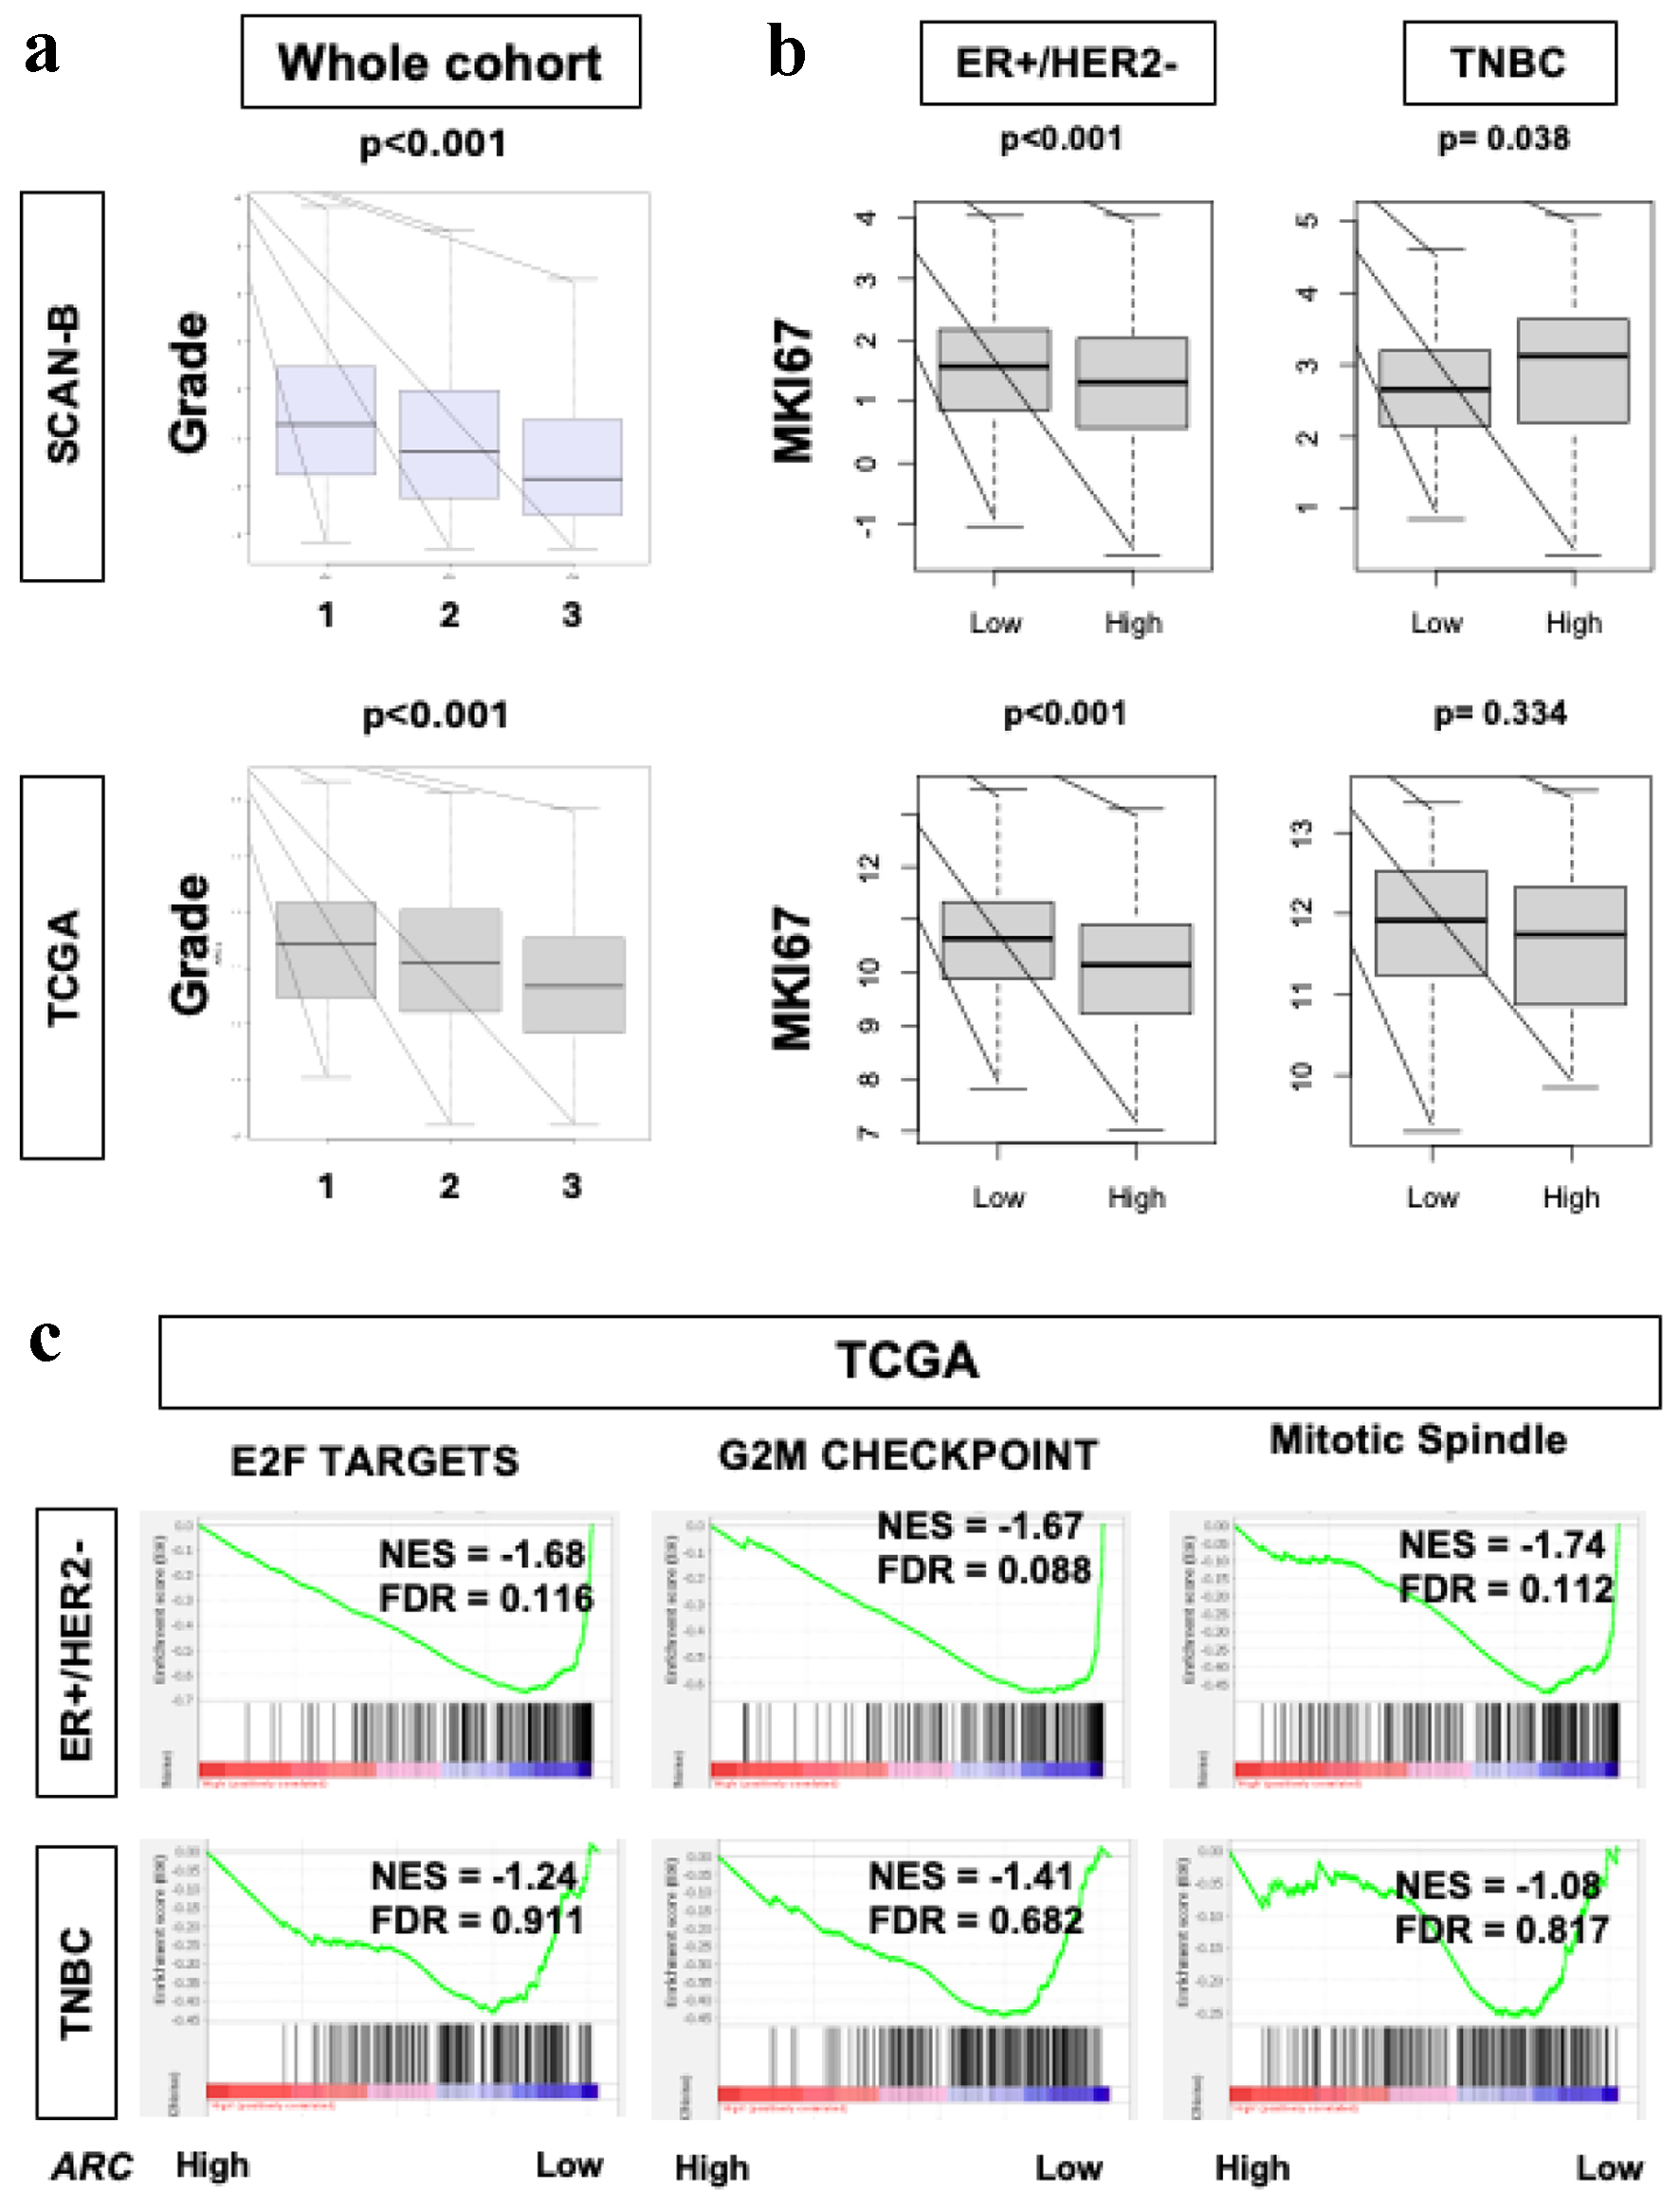
↓ Figure 2. Cell proliferation rates in
ER-positive/HER2-negative breast cancers in SCAN-B and TCGA. (a) Box plot demonstrating histological
grade in the SCAN-B and TCGA cohorts. X-axis represents grade (1, 2 and 3). Fisher’s exact test
was used to calculate P-values. (b) Box plots of MKi67 expression in SCAN-B and TCGA cohorts and within
the ER-positive/HER2-negative and TNBC subgroups. Mann-Whitney U test was used to calculate P-values.
(c) GSEA of Hallmark collection (E2F targets, G2M checkpoint, and MTOR1 signaling) and their
relationship with ARC protein expression in SCAN-B and TCGA cohorts. Median cut-off was used to perform
the analysis. NES and FDR were determined with the GSEA method. ARC: activity-regulated
cytoskeleton-associated protein; ER: estrogen receptor; FDR: false discovery rate; GSEA: Gene Set
Enrichment Analysis; HER2: human epidermal growth factor receptor 2; NES: normalized enrichment score;
SCAN-B: Sweden Cancerome Analysis Network - Breast; TCGA: The Cancer Genome Atlas; TNBC: triple negative
breast cancer.
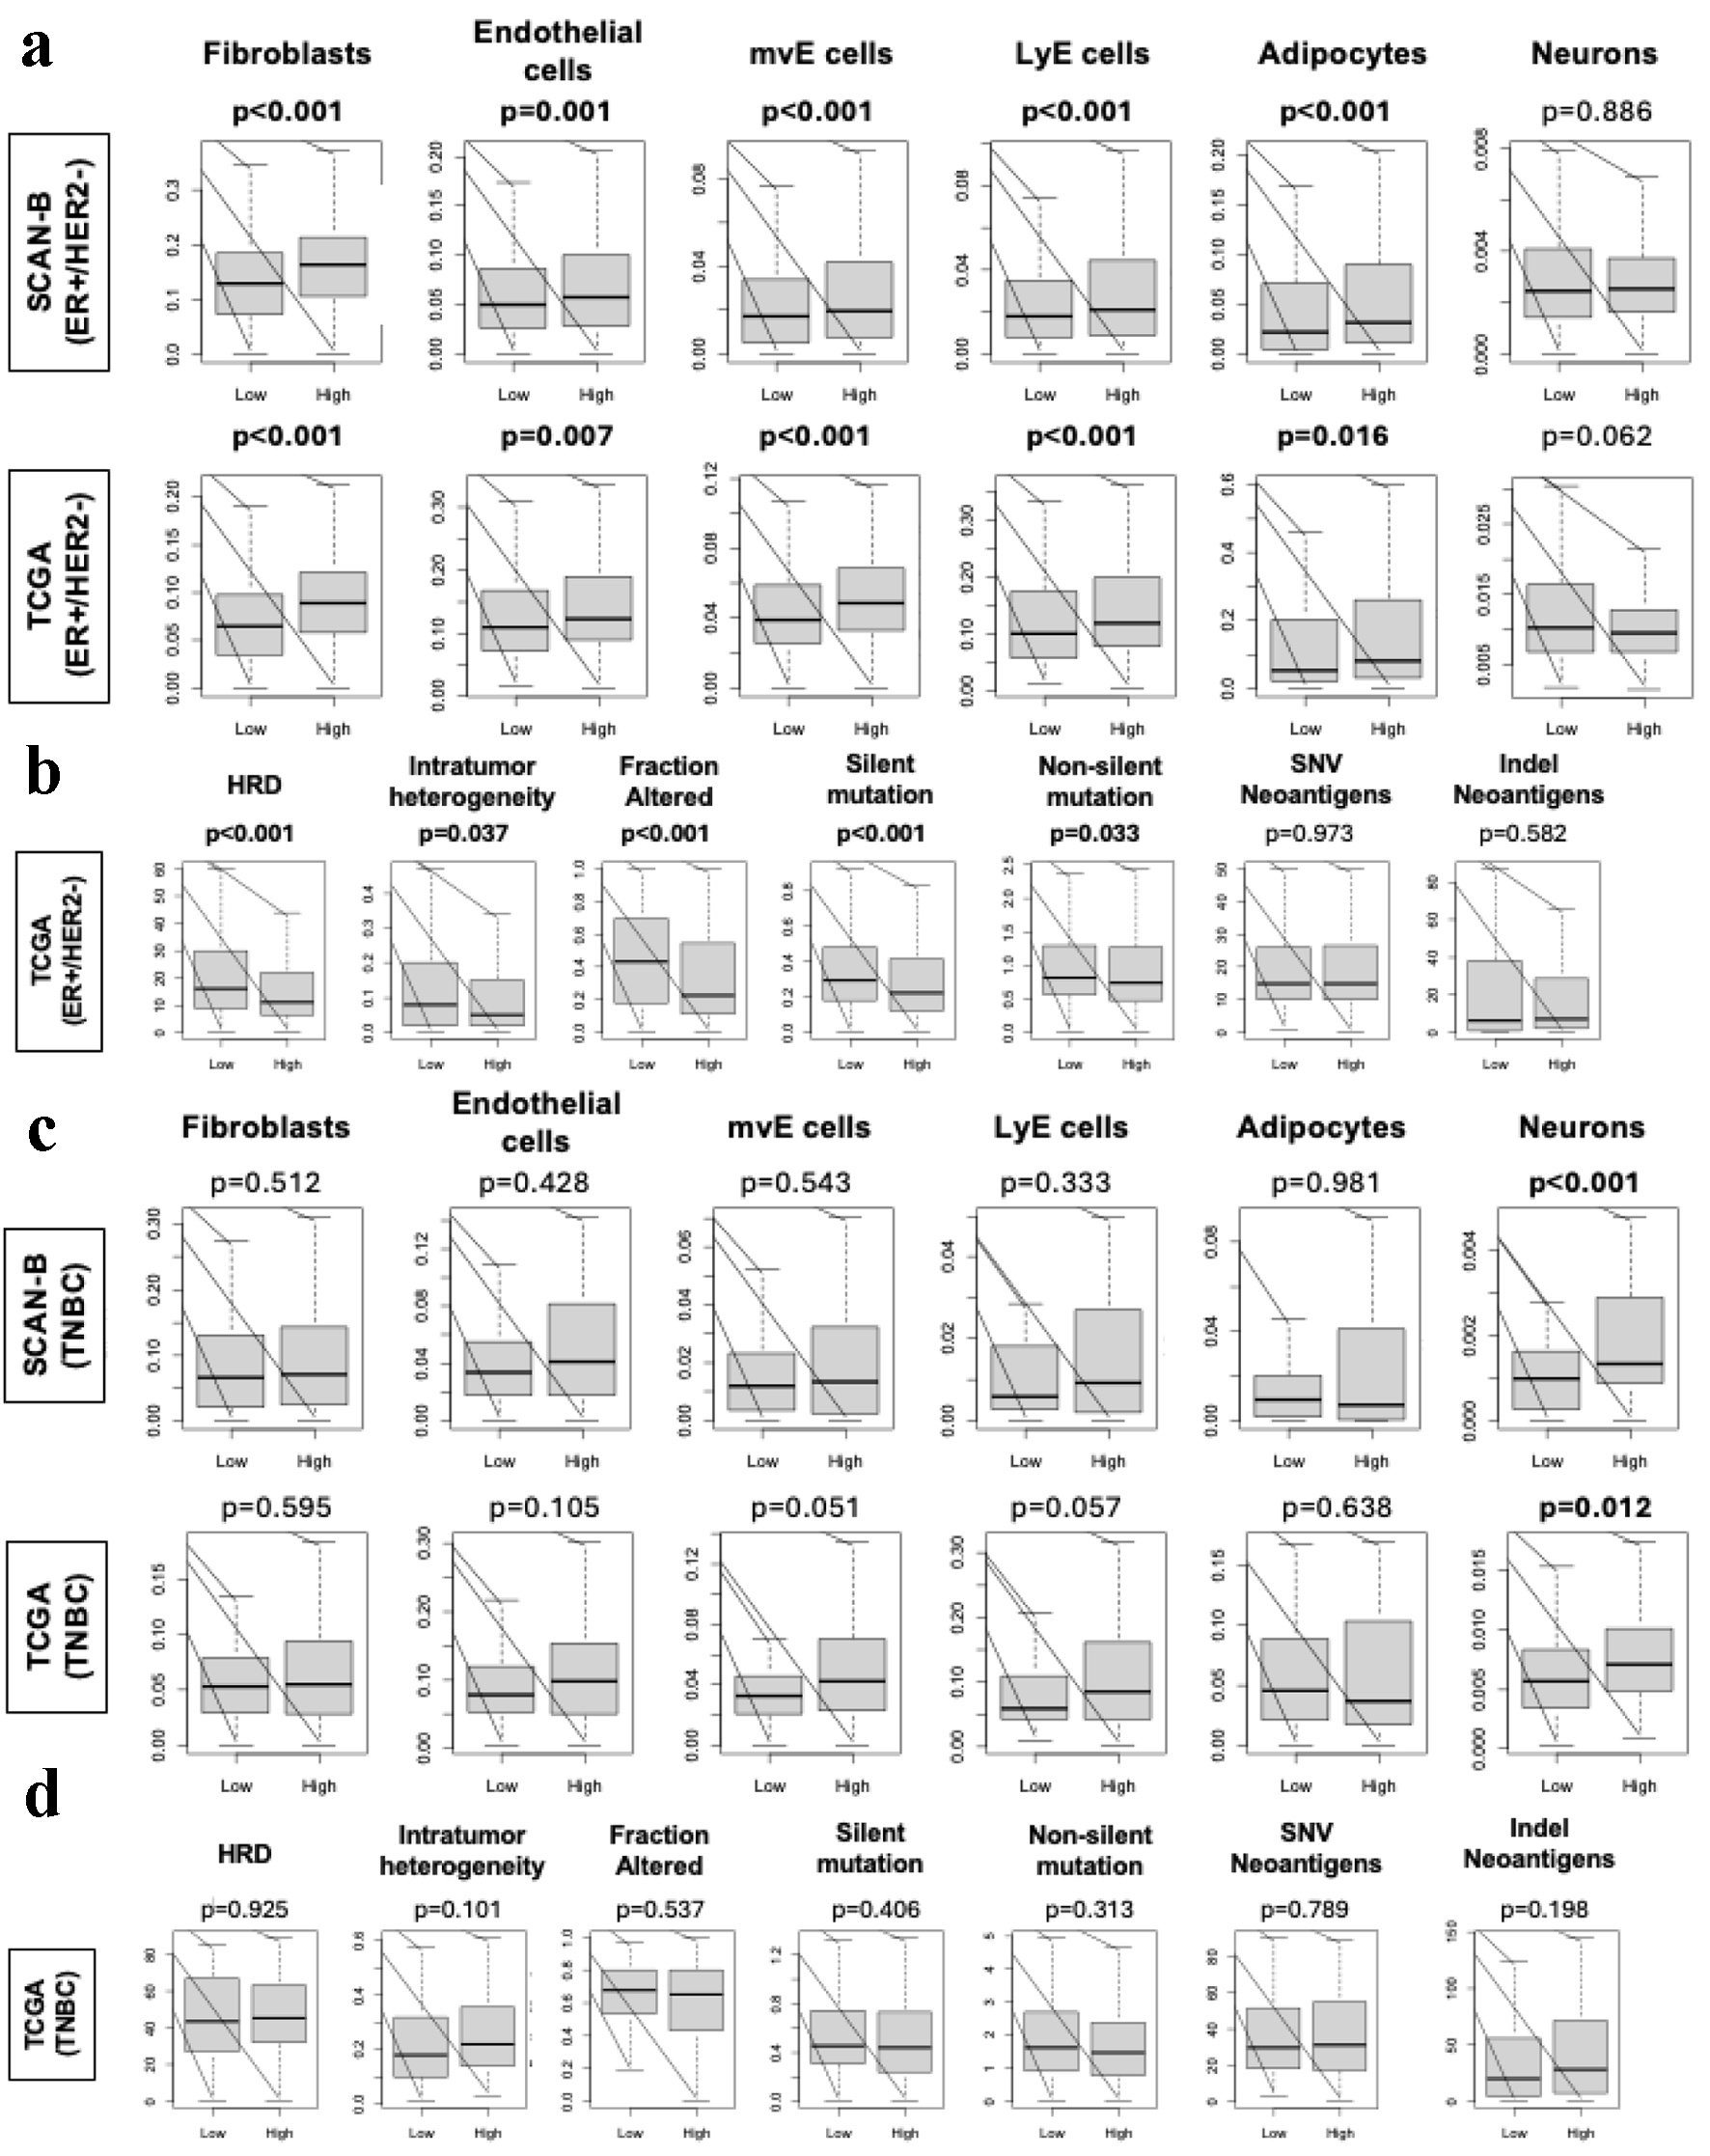
↓ Figure 3. Stromal cell infiltration and
mutation rates amongst ER-positive/HER2-negative and TNBC in SCAN-B and TCGA. (a) Box plots of stromal
cells, including fibroblasts, endothelial cells, mvE cells, LyE cells, and adipocytes, and neurons in
the ER-positive/HER2-negative patients in SCAN-B and TCGA cohorts. Box plot of stromal fraction based on
Thorrson et al. (b) Box plots show HRD, intratumoral heterogeneity, fraction altered, silent and
non-silent mutation rate, and SNV and indel neoantigens in the ER-positive/HER2-negative patients within
the TCGA cohort based on scoring by Thorsson et al. P-values were determined using Mann-Whitney U test.
(c) Box plots of stromal cells, including fibroblasts, endothelial cells, mvE cells, LyE cells, and
adipocytes, and neurons in the TNBC patients in SCAN-B and TCGA cohorts. Box plot of stromal fraction
based on Thorrson et al. (d) Box plots show HRD, intratumoral heterogeneity, fraction altered, silent
and non-silent mutation rate, and SNV and indel neoantigens in the TNBC patients within the TCGA cohort
based on scoring by Thorsson et al. P-values were determined using Mann-Whitney U test. ER: estrogen
receptor; HER2: human epidermal growth factor receptor 2; HRD: homologous recombination deficiency;
SCAN-B: Sweden Cancerome Analysis Network - Breast; SNV: single nucleotide variant; TCGA: The Cancer
Genome Atlas; TNBC: triple negative breast cancer.
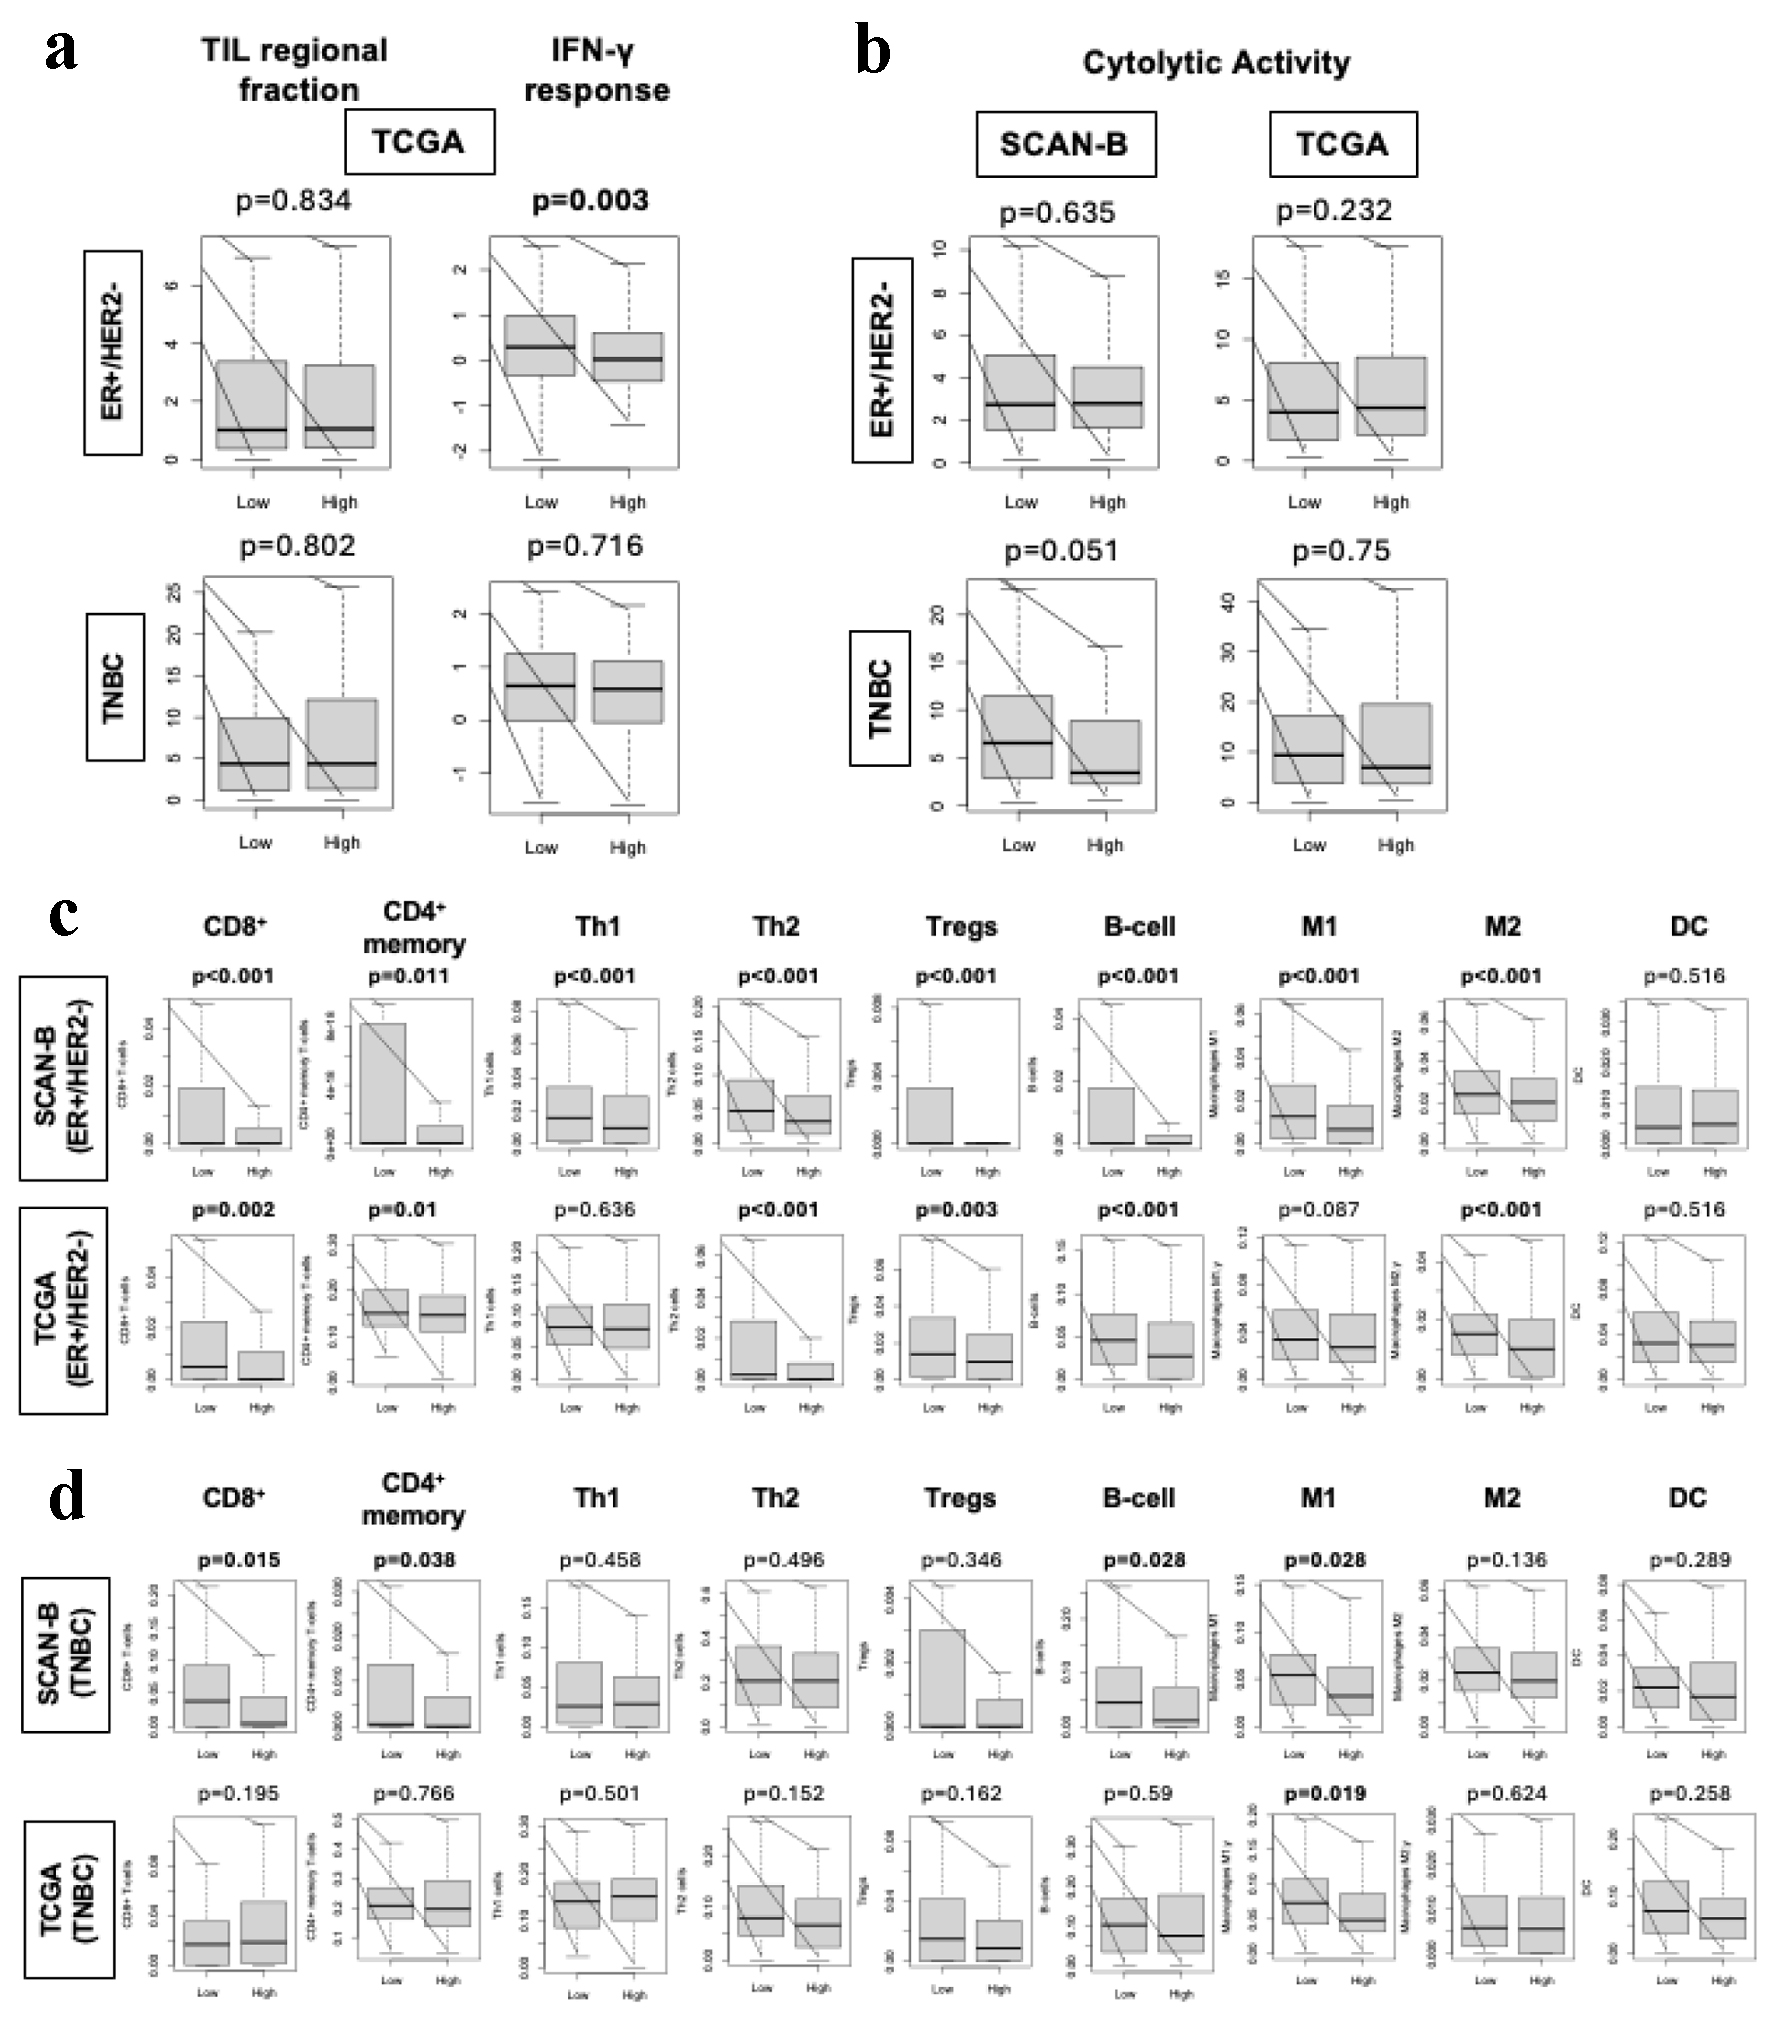
↓ Figure 4. Immune response in
ER-positive/HER2-negative and TNBC tumor microenvironment. (a) Box plots of TILs regional fraction and
INF-gamma response based on Thorrson et al in the ER-positive/HER2-negative and TNBC patients within the
TCGA cohort. (b) Box plots of cytolytic activity in ER-positive/HER2-negative and TNBC patients within
the SCAN-B and TCGA cohorts. (c) Box plots of immune cells, including CD8 cells, CD4 memory cells, Th1,
Th2, Tregs, M1 and M2 macrophages, DCs, and B cells in the ER-positive/HER2-negative patients in the
SCAN-B and TCGA cohorts. Mann-Whitney U test was used to determine P-values. (d) Box plots of immune
cells, including CD8 cells, CD4 memory cells, Th1, Th2, Tregs, M1 and M2 macrophages, DCs, and B cells
in the TNBC patients in the SCAN-B and TCGA cohorts. Mann-Whitney U test was used to determine P-values.
DCs: dendritic cells; ER: estrogen receptor; HER2: human epidermal growth factor receptor 2; SCAN-B:
Sweden Cancerome Analysis Network - Breast; TCGA: The Cancer Genome Atlas; Th1: T helper type 1; Th2: T
helper type 2; TILs: tumor-infiltrating lymphocytes; TNBC: triple negative breast cancer; Tregs:
regulatory T cells.
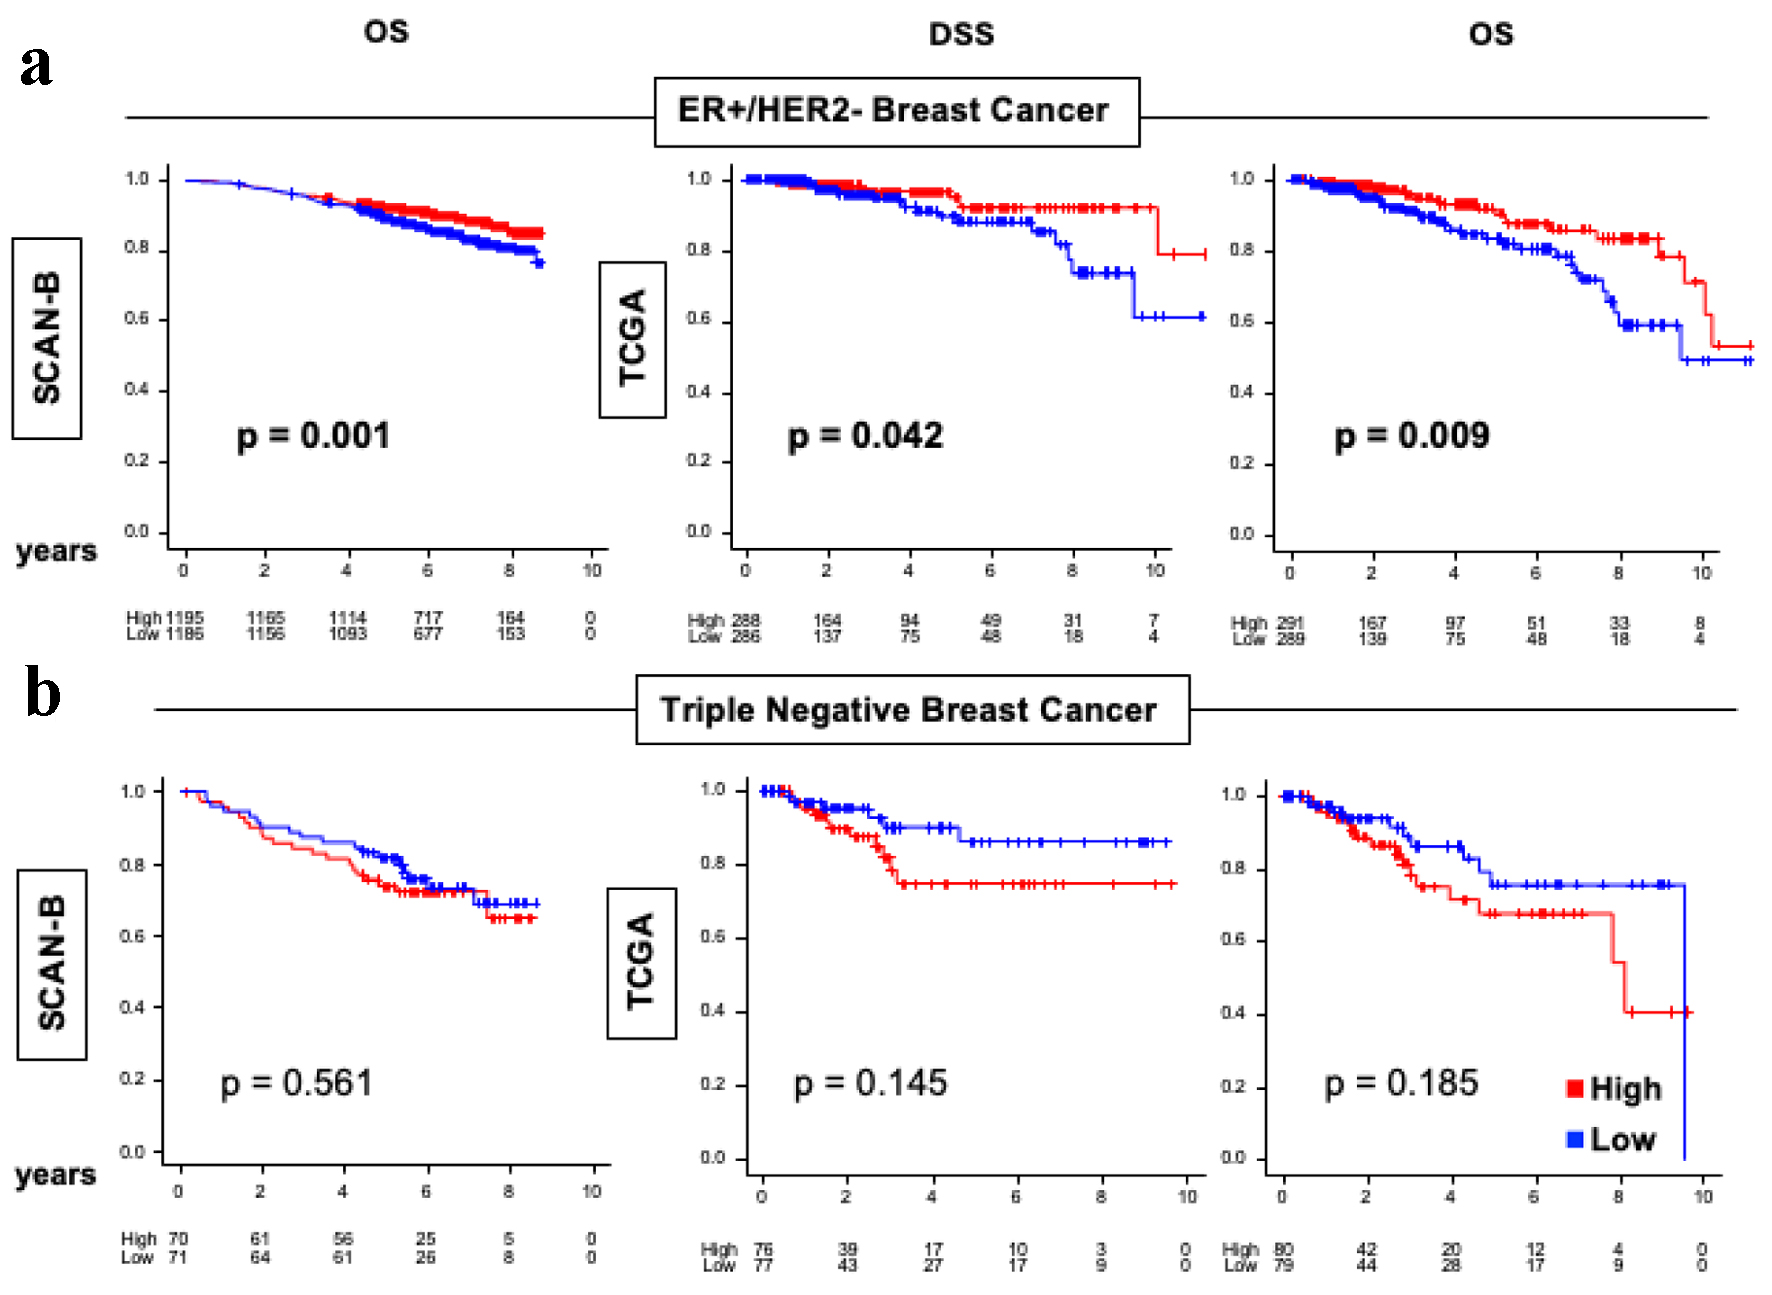
↓ Figure 5. OS and DSS of
ER-positive/HER2-negative and TNBC in the SCAN-B and TCGA cohorts. (a) Kaplan-Meier plots for OS in
SCAN-B (n = 3,273) cohort and DSS and OS in TCGA (n = 1,069) cohorts within ER-positive/HER2-negative
breast cancers. (b) Kaplan-Meier plots for OS in SCAN-B (n = 3,273) cohort and DSS and OS in TCGA (n =
1,069) cohorts within TNBC. Log-rank test was conducted to determine P-values. The red lines represent
high ARC protein expression, and the blue lines represent low ARC protein expression. ARC:
activity-regulated cytoskeleton-associated protein; ER: estrogen receptor; HER2: human epidermal growth
factor receptor 2; OS: overall survival; DSS: disease-specific survival; SCAN-B: Sweden Cancerome
Analysis Network - Breast; TCGA: The Cancer Genome Atlas; TNBC: triple negative breast cancer.
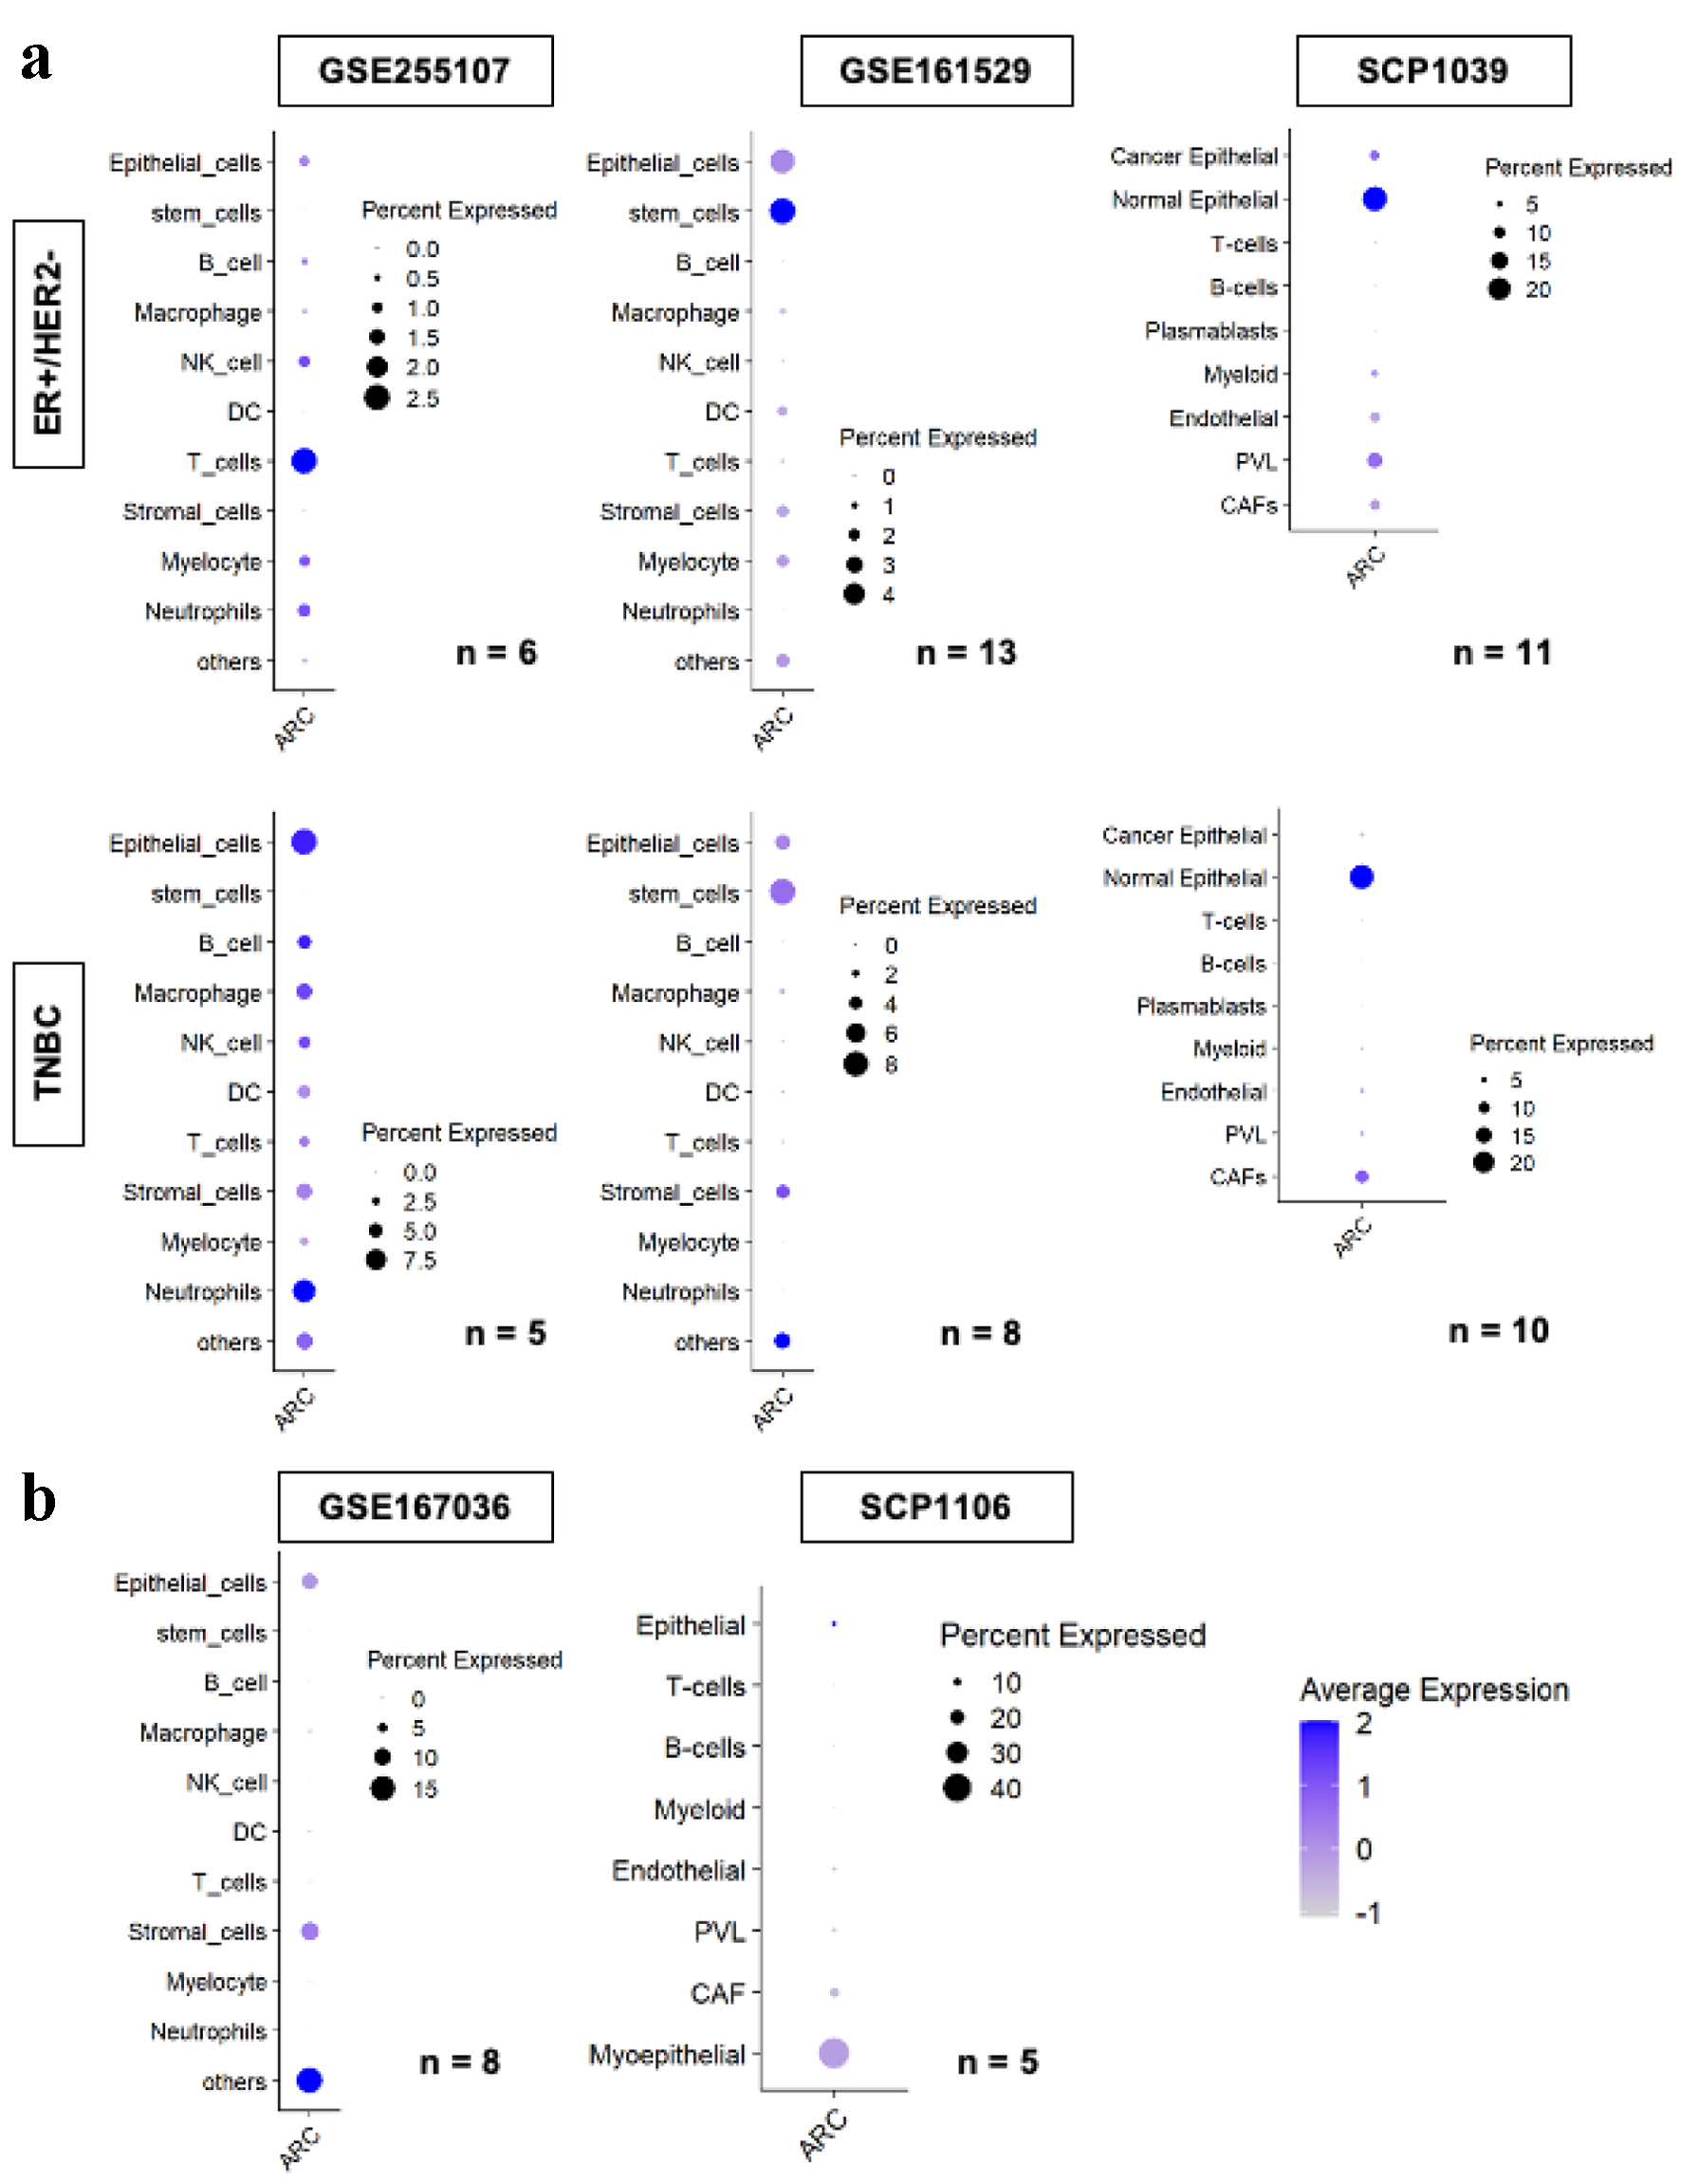
↓ Figure 6. ARC gene expression by cell types in
the tumor microenvironment amongst multiple single cell sequence cohorts. ARC expression of each cell
type by subtype, ER+/HER2- in the upper row, and TNBC in the lower row, analyzed
by single cell RNA sequencing in GSE255107, GSE161529, and SCP1039 cohorts (a) and GSE167036 and SCP1106
cohorts (b). Size of the circles indicates the percent of cells expressed ARC, and the darkness of the
blue color indicates the average ARC expression in the cell type. “n” indicates the number
of patients analyzed in the cohort. ARC: activity-regulated cytoskeleton-associated protein; ER:
estrogen receptor; HER2: human epidermal growth factor receptor 2; TNBC: triple negative breast
cancer.